the Creative Commons Attribution 4.0 License.
the Creative Commons Attribution 4.0 License.
 | 13 May 2020
Occurrence climatology of equatorial plasma bubbles derived using FormoSat-3 ∕ COSMIC GPS radio occultation data
Ankur Kepkar
Christina Arras
Jens Wickert
Harald Schuh
Mahdi Alizadeh
Lung-Chih Tsai
The Global Positioning System – Radio Occultation (GPS-RO) observations from FormoSat-3 ∕ COSMIC are used to comprehend the global distribution of equatorial plasma bubbles which are characterized by depletion regions of plasma in the F region of the ionosphere. Plasma bubbles that cause intense scintillation of the radio signals are identified based on the S4 index derived from the 1 Hz raw signal-to-noise ratio measurements between 2007 and 2017. The analyses revealed that bubbles influenced by background plasma density occurred along the geomagnetic equator and had an occurrence peak around the dip equator during high solar activity. The peak shifted between the African and American sectors, depending on different solar conditions. Plasma bubbles usually developed around 19:00 local time (LT), with maximum occurrence around 21:00 LT during solar maximum and ∼22:00 LT during solar minimum. The occurrence of bubbles showed a strong dependence on longitudes, seasons, and solar cycle with the peak occurrence rate in the African sector around the March equinox during high solar activity, which is consistent with previous studies. The GPS-RO technique allows an extended analysis of the altitudinal distribution of global equatorial plasma bubbles obtained from high vertical resolution profiles, thus making it a convenient tool which could be further used with other techniques to provide a comprehensive view of such ionospheric irregularities.


The equatorial plasma bubbles (EPBs) are regions of plasma depletion, which are prominent in the F region of the ionosphere. These EPBs generally exist in clusters (Singh et al., 1997) and often diminish the radio waves (e.g., GPS signals) penetrating through it, causing problems for the users of the satellite data. These plasma bubbles primarily occur at low latitudes and induce rapid fluctuations in the amplitude as well as phase of the radio signals. This distortion is often termed scintillation (Yeh and Liu, 1982). EPBs are also known by their generic name of Equatorial Spread F (ESF), which is perceived as a spread or diffused echoes in the ionosonde readings (Booker and Wells, 1938; Whalen, 1997). Furthermore, they appear as plume-like structures in radar observations (Kudeki and Bhattacharyya, 1999) and emission depletions in airglow images (Sahai et al., 2000).
EPBs are a night-time phenomenon and are initiated through the Rayleigh–Taylor instability (RTI) mechanism in the bottom side of the F region (Sultan, 1996; Woodman, 2009). Various theories related to seed perturbation like atmospheric gravity waves (AGWs) as well as vertical shear of zonal plasma drift are considered amongst the probable sources to trigger the RTI mechanism (Kudeki et al., 2007; Abdu et al., 2009; Huang et al., 2011; Taori et al., 2011). Other than these seed sources, off-equatorial ionospheric phenomena such as sporadic-E layers and medium-scale traveling ionospheric disturbances have also been considered for possible seed activity along the equipotential magnetic field lines (Abdu et al., 2003; Tsunoda, 2007). The AGWs with wavelengths larger than 100 km seed the equatorial plasma bubble by causing perturbations in the lower thermosphere, i.e., E region. This E region then maps it onto the bottom side of the F region along the magnetic field lines through electro-dynamical coupling during the late afternoon period (Röttger, 1981; Tsunoda, 2010; Huang et al., 2011; Retterer and Roddy, 2014; Tsunoda, 2015). Furthermore, an important activity at the Equator, i.e., pre-reversal enhancement (PRE), plays a significant role in influencing the plasma bubble growth and vertically lifting it after the sunset. PRE is a phenomenon that causes an enhancement in the zonal eastward electric field at the sunset terminator before the electric field reverses in the westward direction during the night (Abadi et al., 2015). This phenomenon creates a vertical electromagnetic (E × B) drift that influences the growth rate of the RTI by lifting the plasma to the height where the ion-neutral collision rate is low (Farley et al., 1970; Fejer and Kelley, 1980; Abadi et al., 2015). EPBs occur within hours right after sunset, and the degree to which they extend in the latitude and altitude depends solely on the magnitude of PRE (Farley et al., 1970; Abdu et al., 2003; Abadi et al., 2015).
The depletions in the equatorial plasma were initially identified from in situ satellite measurements by Hanson and Sanatani (1973) and later confirmed by McClure et al. (1977). Since then, various techniques such as ground-based observations (Woodman and La Hoz, 1976; Farley et al., 1970; Whalen, 1997; Kudeki and Bhattacharyya, 1999), airglow imagers (Sahai et al., 1994, 2000; Martinis and Mendillo, 2007), satellite-based in situ measurements (Burke et al., 2004a; Park et al., 2005; Gentile et al., 2006; Stolle et al., 2006; Xiong et al., 2010; Dao et al., 2011) as well as Global Navigation Satellite System (GNSS) ground-based measurements (Basu et al., 1999; Carrano and Groves, 2007; Nishioka et al., 2008) have been used to study EPBs. Although these techniques contributed enormously towards the understanding of the ionospheric irregularities, they lacked in delivering critical information in one aspect or the other. For example, the ground-based sounders and globally distributed GNSS ground receivers, which provide crucial information related to the ionosphere, remain restricted to a landmass. On the other hand, the in situ satellite instruments explore the prevailing conditions in the ionosphere along the orbital track but fail to provide crucial insight into the vertical ionospheric conditions. Nonetheless, in recent times, the GPS-RO technique has been widely used for ionospheric investigation owing to its extensive sounding capabilities along with high-resolution altitudinal measurements, both globally as well as vertically for envisaging four-dimensional prospects of the ionosphere (Wickert et al., 2001; Arras et al., 2008; Wickert et al., 2009; Carter et al., 2013; Liu et al., 2016; Tsai et al., 2017, 2018).
The GPS-RO is a space-based technique which involves two satellites, i.e., GPS and Low Earth Orbiter (LEO), operating on a high-low satellite-to-satellite tracking (HL-SST) mode (Wickert et al., 2001, 2009). The operational principle is mainly based on LEO satellites tracking the radio signals from the GPS satellites, causing the signal to bend as it penetrates the Earth's ionosphere and atmosphere. The GPS-RO profiles are retrieved from the bending angle, which is the fundamental observable, obtained from bending of the signal as a function of asymptotic ray-miss distance from the center of curvature of the Earth under the assumption of spherical symmetry (Kursinski et al., 1997, 1999). In the ionosphere, electron density profiles are obtained using the onion peeling algorithm (Lei et al., 2007), while in the stratosphere and troposphere, temperature and pressure profiles are obtained from refractivity profiles (Wickert et al., 2002; Jakowski et al., 2004). In addition to providing such a wealth of information, the GPS-RO technique mitigates various technical shortcomings by operating under all weather conditions and providing long-term stability without requiring calibration (Rocken et al., 1997). Due to GPS-LEO geometry, this technique provides measurements with a high vertical resolution that are globally distributed. In the past, various LEO missions contributed enormously towards radio occultation operations that led to the rise of one mission to another, starting from GPS ∕ MET (GPS ∕ METeorology), CHAMP (CHAllenging Minisatellite Payload), GRACE (GRAvity recovery and Climate Experiment), FormoSat-3 ∕ COSMIC (Formosa Satellite-3 ∕ Constellation Observing System for Meteorology, Ionosphere, and Climate) (Anthes et al., 2008; Wickert et al., 2009; Arras et al., 2010) to the FormoSat-7 ∕ COSMIC 2 mission.
In this study, EPBs are analyzed using the GPS-RO measurements from the FormoSat-3 ∕ COSMIC satellites. The FormoSat-3 ∕ COSMIC mission is a constellation of six micro-satellites, which provided ∼2000 continuous real-time neutral atmospheric and ionospheric profiles daily (Anthes et al., 2008). However, after orbiting for more than 13 years and exceeding its planned lifespan of 5 years, the number of RO profiles has significantly reduced to approximately 20 % since the middle of 2016. This is because currently only one out of six satellites is operational under degraded mode (Chu et al., 2018). The present study comprises measurements taken during the years 2007–2017 that include nearly 5.5 million ionospheric profiles.
To investigate EPBs, ionPhs (ionospheric excess Phases) data are used which belong to the level 1b dataset. These FormoSat-3 ∕ COSMIC observation files are freely available on the web portal of the COSMIC Data Analysis and Archival Center (CDAAC) database, which are managed by University Corporation for Atmospheric Research (UCAR), Colorado, United States of America. Furthermore, the CDAAC also provides “ScnLv1” scintillation datasets which contain offline constructed S4 data calculated from 50 Hz that are recorded at 1 Hz. But from the several thousand ScnLv1 profiles that are retrieved daily, only less than one-fourth of the profiles can be reconstructed for the F-region altitude of the ionosphere (Tsai et al., 2017). The derivation of ionPhs profiles is based on the assumption of spherical symmetry; however, this is not valid for EPBs (Jakowski et al., 2004; Arras, 2010). The ionPhs datasets are retrieved at a 1 Hz sampling rate with ∼2 km of altitude resolution along the vertical range of ∼60 km above the Earth's surface up to the orbital height of the LEOs (∼800 km).
The raw signal-to-noise ratio (SNR) of the GPS L1 (1575 MHz) ionPhs measurements was used to detect plasma bubbles. This is because the GPS L1 measurements show strong signal characteristics and are received with a relatively higher intensity when compared to the GPS L2 (1227 MHz) signals, which are weaker and noisier. On the other aspect, SNR measurements were preferred over electron density profiles since they were directly available and no further treatment was required. Additionally, from the literature, it is known that amplitude variation in the SNR profile has a direct influence on the vertical gradient of the electron density, which provides critical information on the underlying space weather conditions (Wickert et al., 2004; Arras et al., 2008). From Fig. 1, it is clear that the EPB's signature characterized by sharp depletion in the electron density corresponds to intense oscillations in the SNR profiles. Subsequently, these fluctuations produce a high value of the amplitude scintillation index.
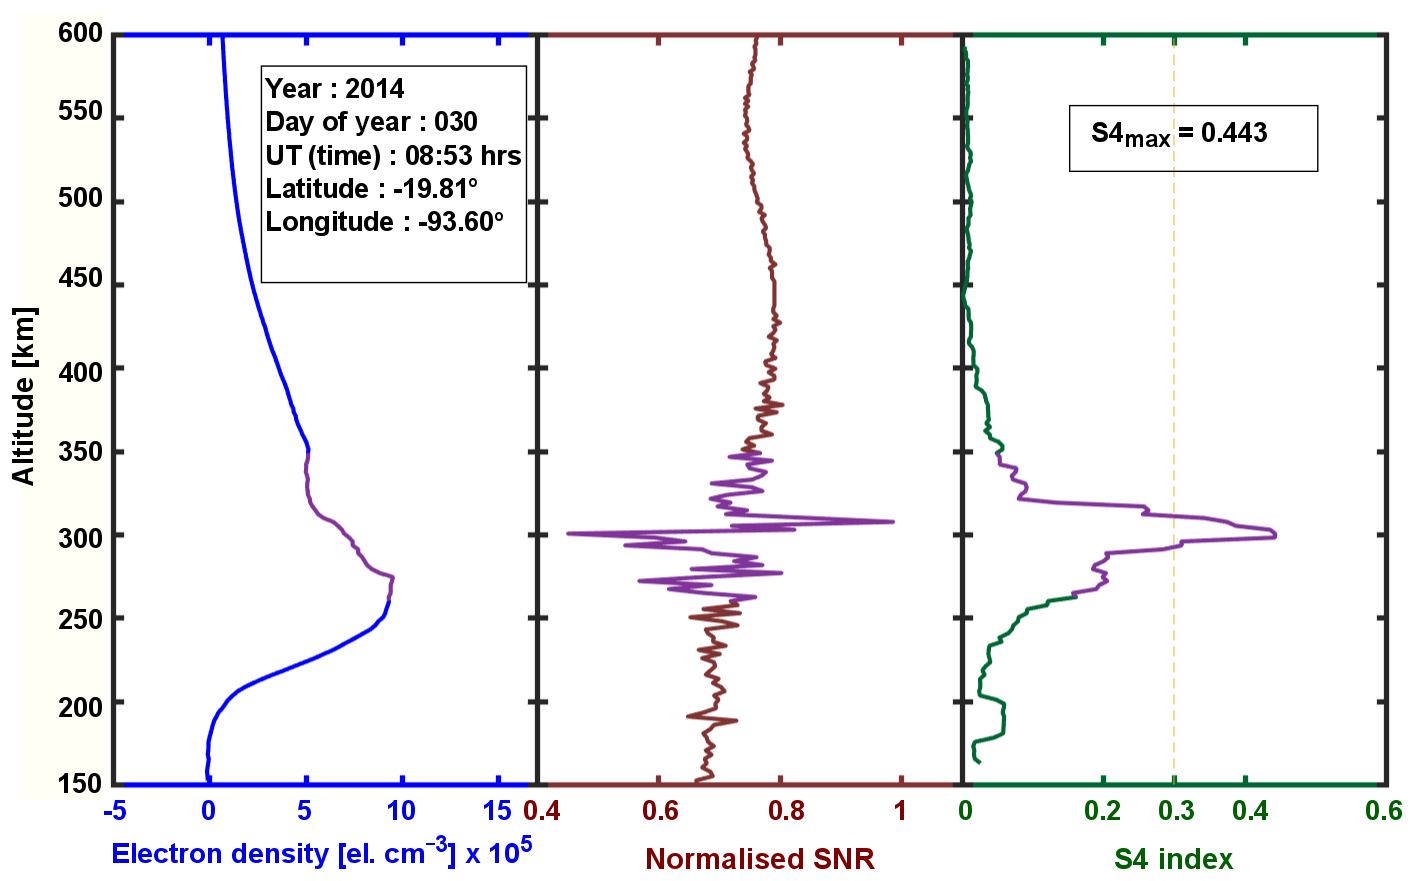
Figure 1Electron density profile (ionPrf product) in conjunction with the normalized SNR and derived S4 index (ionPhs product). The purple color line in the plot shows depletion in electron density and corresponding fluctuations of normalized SNR profile and high index values in the S4 plot.
The scintillations caused by plasma bubbles were identified by deriving the amplitude scintillation index, i.e., S4 index, from the SNR of the GPS L1 signals, since these variations in the SNR are associated with the vertical changes in the electron density that mainly occur in line with the irregularities, e.g., EPBs (Hajj et al., 2002; Arras and Wickert, 2018). For subsequent analyses of the plasma bubbles, attributes of ionPhs datasets such as the SNR of the GPS L1 signal, universal time, altitude, latitude, and longitude were extracted. Eventually, the S4 index was computed from the raw SNR measurements, as described by Syndergaard (2006) in Eq. (1).
where S4max9sec denotes the scintillation index calculated over a 9 s interval, I is the square of the SNR of the L1 GPS signal, and the bracket 〈〉 stands for the average taken over 9 s. Also, a low-pass filter is applied to the time series of the 9 s interval to obtain a new average of the intensity for constructing a long-term detrended S4max9sec index (Syndergaard, 2006).
A simple representation of S4max9sec versus local time during the year 2014 is depicted in Fig. 2 that shows scattered scintillation values caused by a varying electron density gradient. In addition, it also highlights low S4max9sec values during the day and high values during the night. The high values observed during the night were due to the plasma instabilities in the F region after sunset. Altogether about 0.5 million profiles were retrieved in 2014, out of which only 6130 (i.e., ∼1.2 %) global profiles were classified as strong scintillation events originating from possible plasma instabilities.
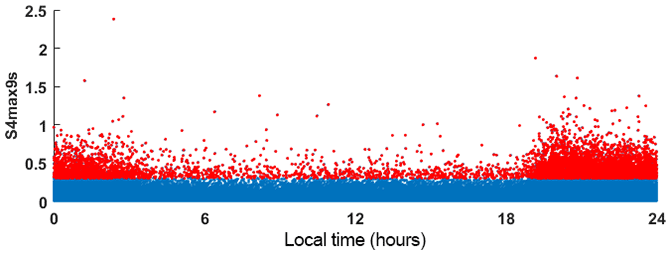
Figure 2Plot of S4max9sec as a function of local time (LT) during 2014. The blue dots represent the scintillation index less than 0.3, whereas strong scintillations are represented by the red dots with an S4 index larger than 0.3.
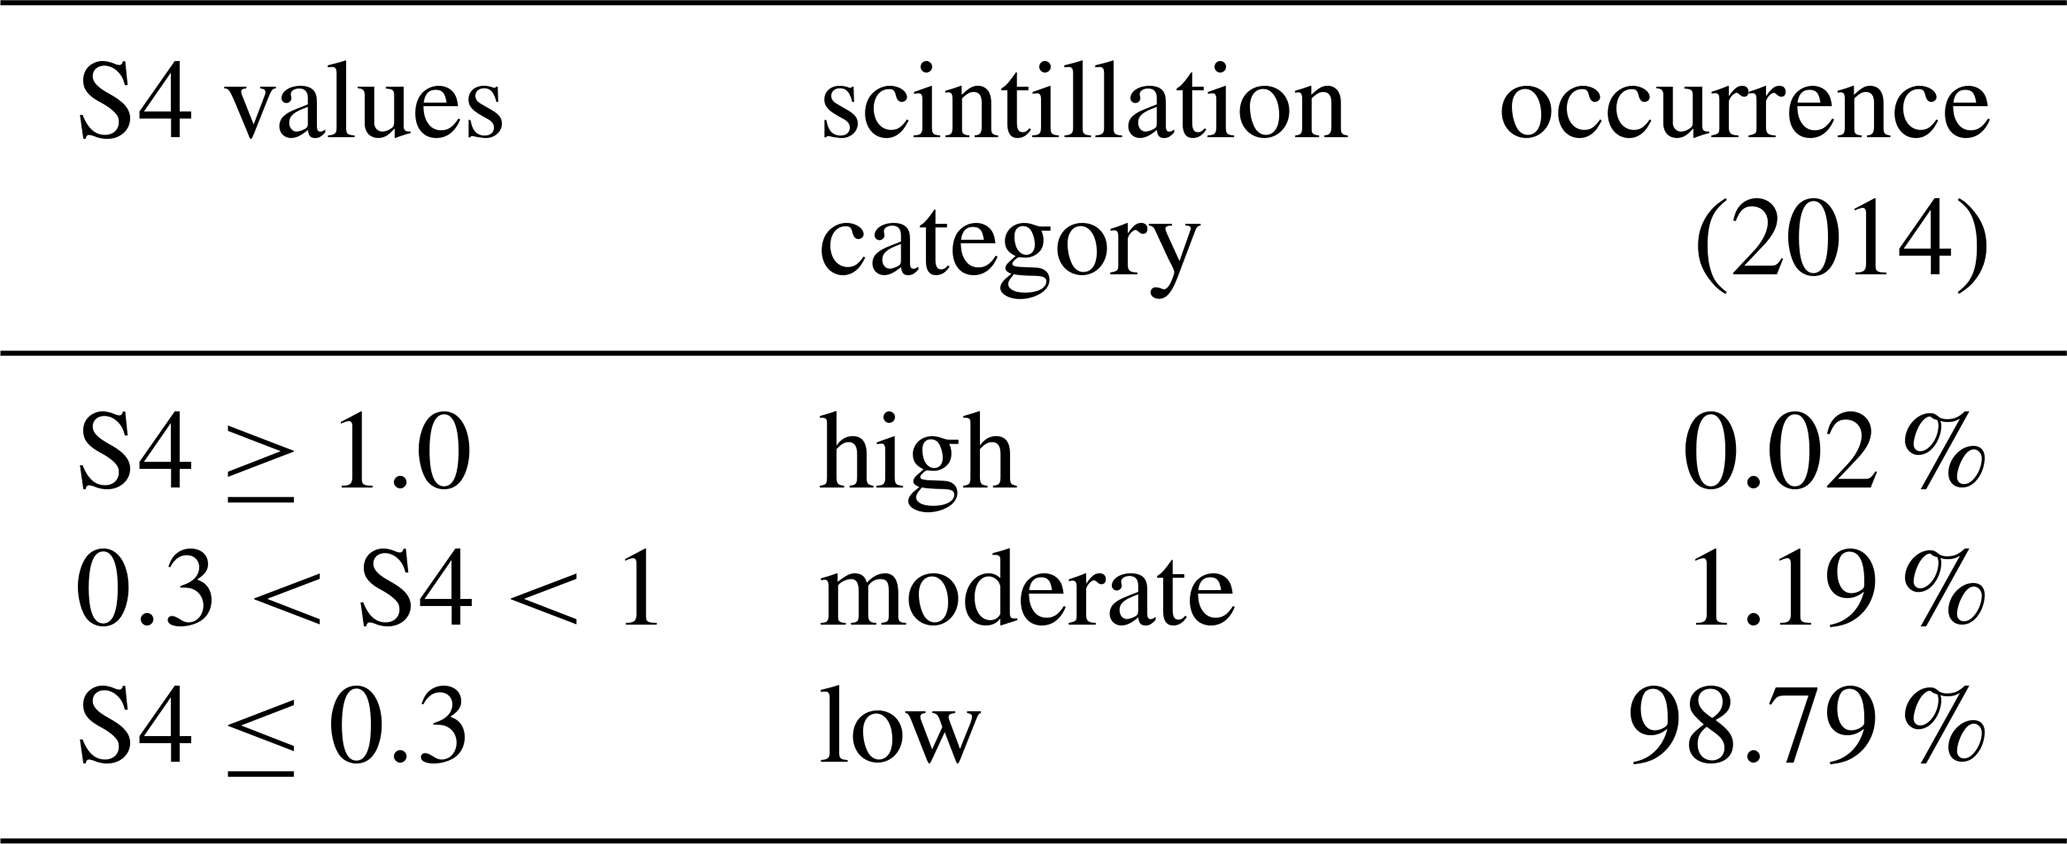
For this study, a scintillation event was classified based on the S4max9sec index. Table 1 presents the different scintillation categories corresponding to different S4max9sec (hereafter referred to as S4) indexes. Within this study, an S4 index greater than 0.3 is quantified as a strong scintillation event influenced by possible plasma bubbles (Brahmanandam et al., 2012; Carter et al., 2013).
The FormoSat-3 ∕ COSMIC measurements between 1 June 2007 and 31 December 2017 were analyzed to understand the occurrence climatology of EPBs. This time interval was selected to avoid the influence of orbit maneuvers in the observations that were present until May 2007. Since the FormoSat-3 ∕ COSMIC satellites fly in non-sun-synchronous orbit with an inclination of 70∘, they effectively perform global soundings. In order to centralize this study in the equatorial region, only the measurements within the geographical latitudinal extent of 50∘ N/S were considered. Polar scintillation events were excluded by considering this limit to focus explicitly on the equatorial ones. The altitude range between 150 and 600 km was also specified to avoid the influences from the E region and the noisier information from the GPS-RO profiles above 600 km.
3.1 Global distribution of EPBs
EPBs are field align irregularities, which occur along the geomagnetic equator and peak during the time of year when the sunset terminator closely aligns with the magnetic field lines (Tsunoda, 1980, 1985). Figure 3 reveals the global occurrence climatology of EPBs, covering a solar cycle of almost 11 years. The occurrence rate of EPBs is calculated as a ratio of a number of profiles that have an S4 index greater than 0.3 to a number of all RO profiles within the specified grid integrated over local night time, i.e., between 18:00 and 06:00 LT. The general occurrence of EPBs derived from the S4 index followed the course of the geomagnetic equator, and the occurrence peak appeared around and not directly at the geomagnetic equator. This result is expected especially during high solar activity because an equatorial anomaly reappears after the sunset due to the formation of an ionization trough at the magnetic equator (Aarons et al., 1981; Aarons, 1982). As a result, irregularities occur in the region of high plasma density, i.e., crest of the equatorial anomaly. Previous results obtained from different techniques also showed strong scintillations in the crest latitudes compared with the dip equator (Basu et al., 1988, 2002).
Furthermore, the 11-year climatology outlines the descending–ascending–descending phase that corresponds to the solar cycle. A low occurrence rate was observed with the onset of the descending phase, until the solar minimum year 2009, with a peak in the South American sector, whereas the occurrence rate increased during the ascending phase of the solar cycle until the solar maximum year 2014, with the peak stretching along the Atlantic-African region with each passing year. The occurrence rates again deteriorated for the second descending phase after the solar maximum year 2014, with the peak migrating towards the South American region. Throughout this climatology, a finite proportion, if not the peak occurrence, of EPBs was present in the South American region. One of the reasons conferred by Huang et al. (2001) suggests the existence of a weaker magnetic field in the South American region, which accounts for the RTI's irregularities, caused by vertical plasma drift because of the zonal electric field during the sunset. By contrast, Burke et al. (2004a) argued on the weak occurrence rates of EPB during high solar activity, citing reasons towards increased E-region conductivity because of particle precipitation in the South Atlantic anomaly. In addition, McClure et al. (1998) proposed possible seeding from gravity waves emerging from the troposphere in the Andes, which was investigated by Su et al. (2014). The authors confirmed a good correlation only in the South American region due to gravity waves that originated in the intertropical convergence zone. However, in the Atlantic-African region, there was a positive but still weak correlation. For such correlations, the authors suggested that in addition to gravity waves, there existed other seed perturbations that produced plasma instabilities. From the annual EPB occurrence, almost negligible EPB occurrence was observed in the Atlantic-African, Asian, and Pacific regions during low solar activity. Thus, PRE could most likely seed EPBs in this region since the magnitude of PRE is principally affected by solar activity (Li et al., 2007; Stolle et al., 2008; Kil et al., 2009; Abadi et al., 2015). Therefore, a significant number of EPBs occurred during high solar activity, when the magnitude of PRE was at its peak magnitude, while a weak EPB occurrence rate was observed during low solar activity when the PRE amplitude was also at its minimum.
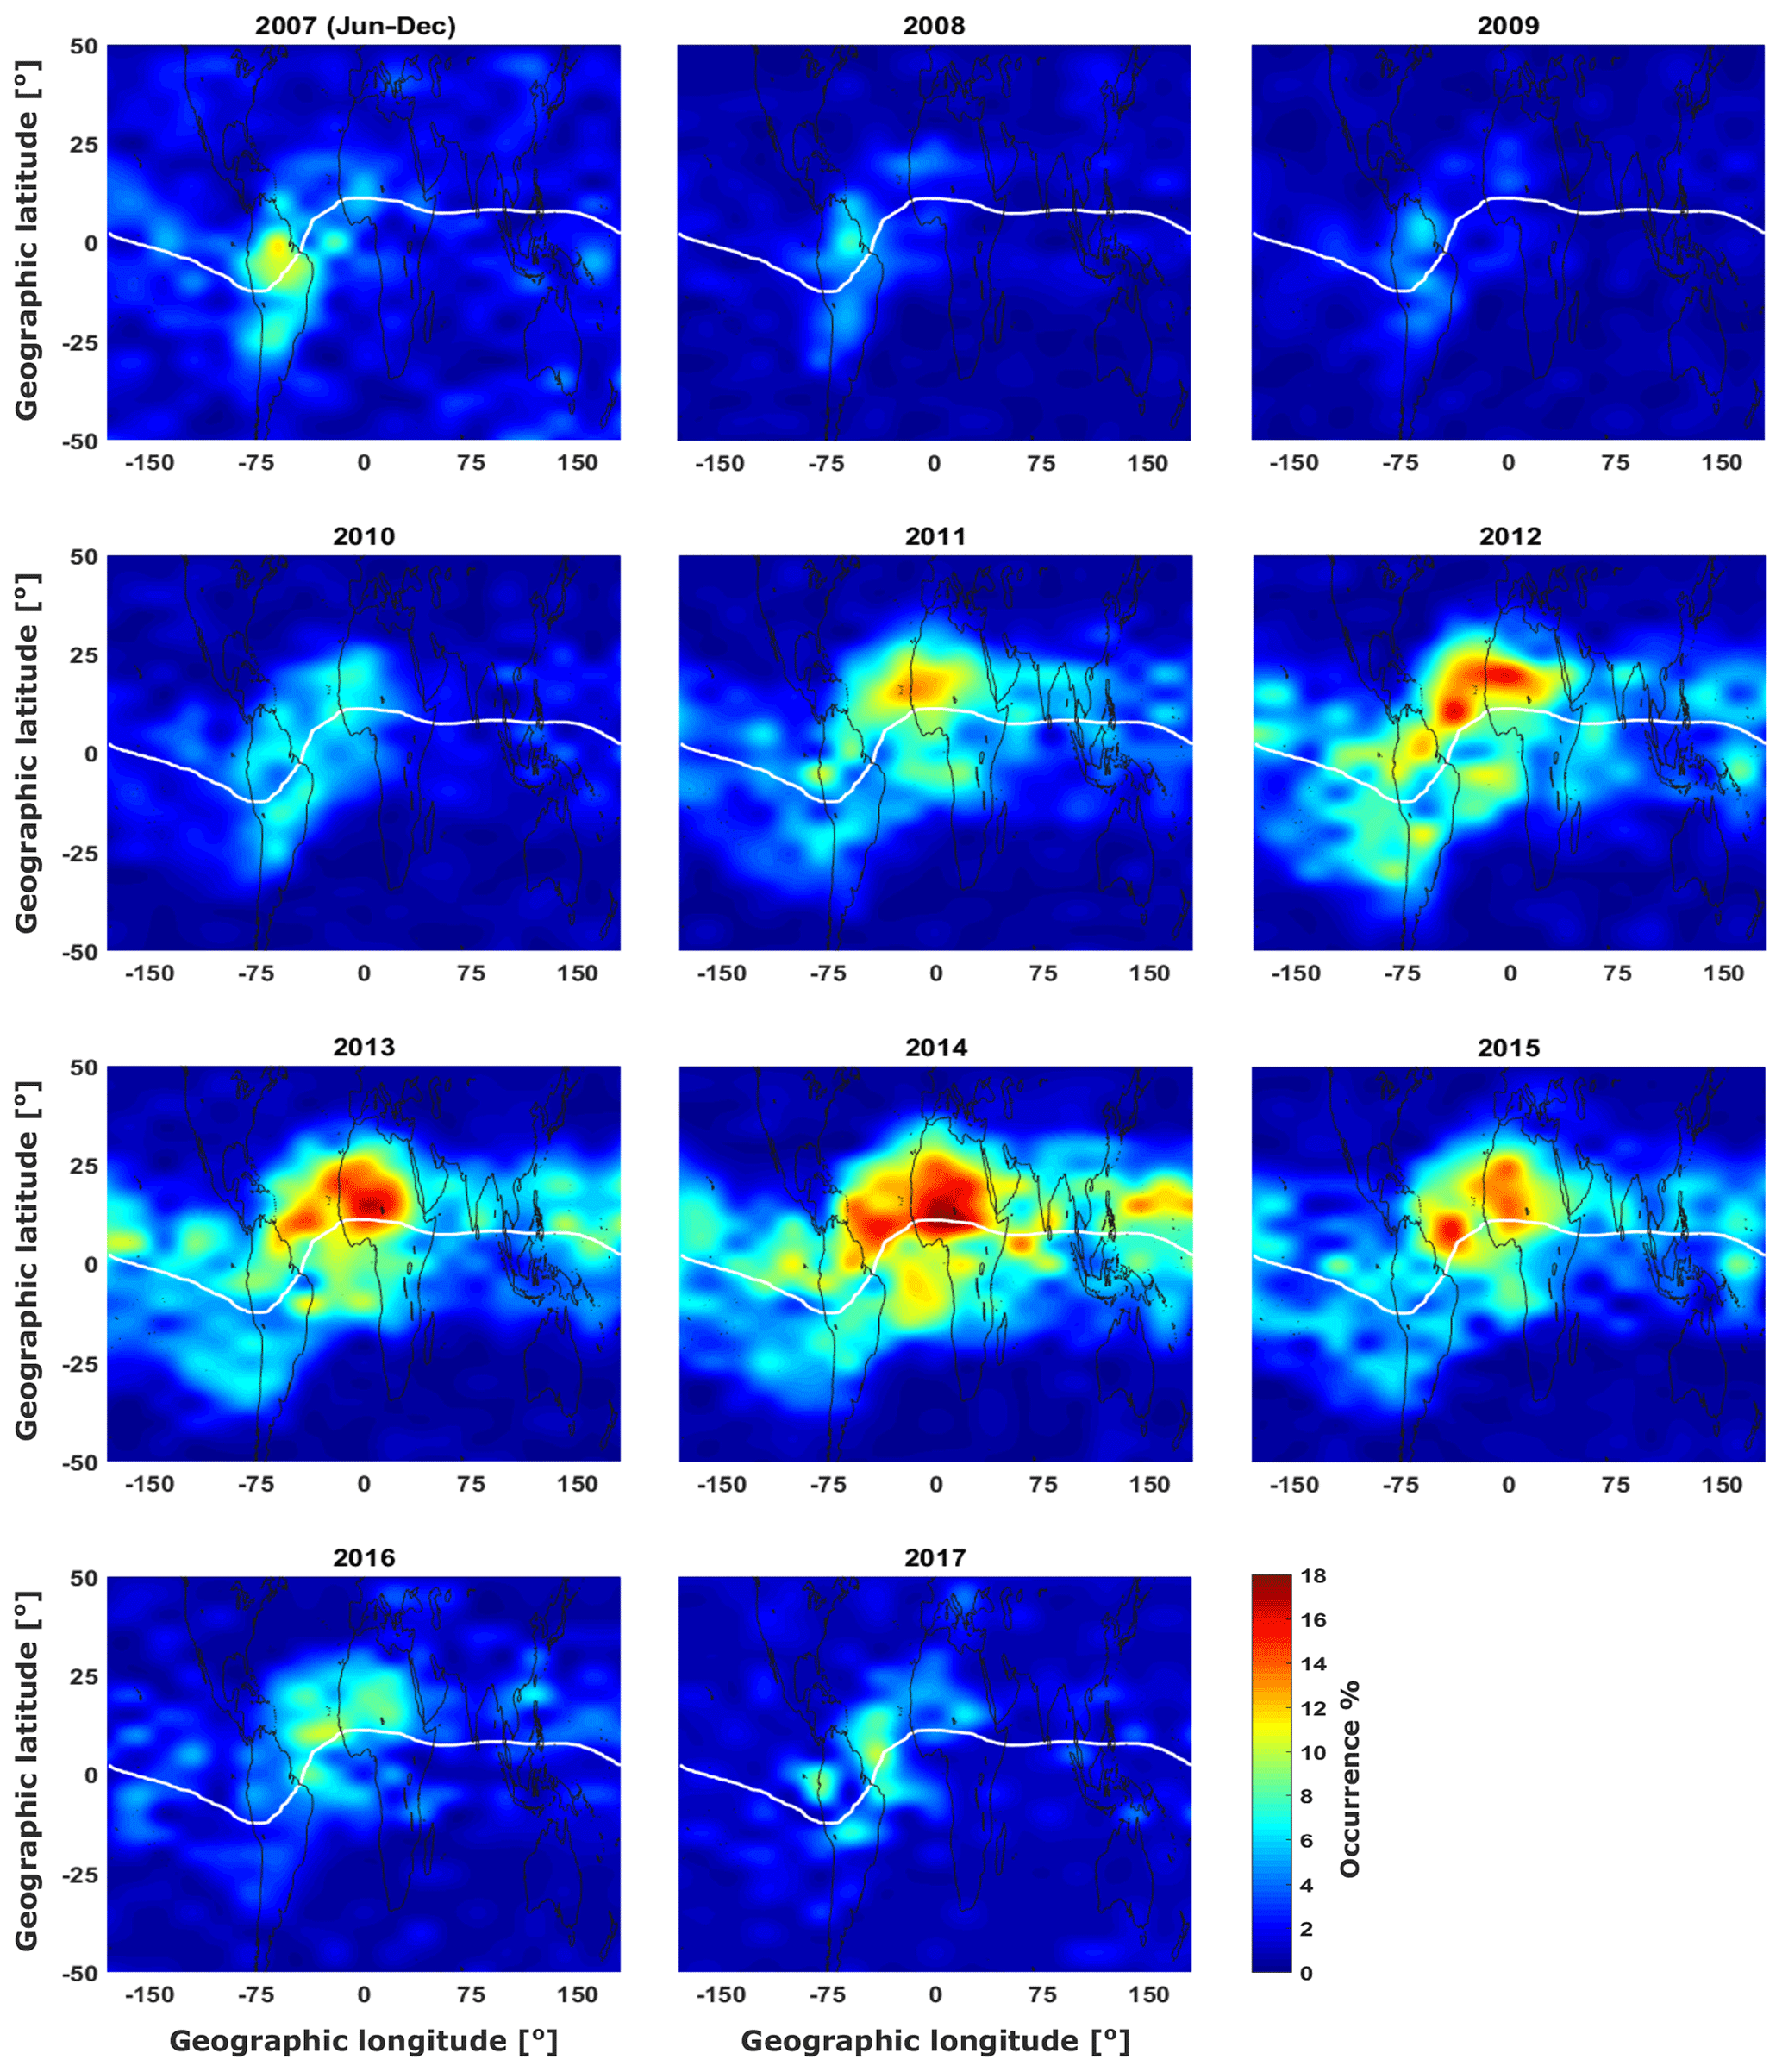
Figure 3Geographical distribution of EPBs from mid-2007 to 2017 in a 5∘ latitudinal by 20∘ longitudinal grid. The white solid line depicts the geomagnetic equator.
3.2 Local time dependency
Based on various probing techniques, the previous studies showed that EPBs are a night-time phenomenon that includes small-scale irregularities inside the bubble, which lead to turbulent structures that cause scintillations (Woodman and La Hoz, 1976; Whalen, 1997; Sahai et al., 2000; Gentile et al., 2006; Yokoyama, 2017). A general local time occurrence of EPBs based on global soundings retrieved from the FormoSat-3 ∕ COSMIC satellites during 2014 is presented in Fig. 4. The occurrence rate of EPBs, here, was calculated similarly to the global distribution occurrence but for a different grid composition within the geographical latitudinal extent of 50∘ N/S. The rapid depletion of the E-region conductivity and the onset of PRE right after sunset caused the plasma bubble to develop around ∼19:00 LT. This characteristic from the local time occurrence of EPBs shown in Fig. 4 agrees with the study carried out by Stolle et al. (2006) using CHAMP in situ measurements. In general, a substantial occurrence of EPBs is observed during a high solar activity year, while sparse EPBs are generated during a low solar activity year (Basu et al., 2002). In Fig. 5, the occurrence of EPBs is presented based on the solar maximum (2014) and solar minimum (2009) years. The occurrence rate was calculated as a ratio of the S4 values greater than 0.3 to the total number of S4 profiles for each hour starting from ∼19:00 LT within the 50∘ N/S of the geographical latitudinal grid. The bar plot emphasizes that EPBs culminate approximately 1 h earlier, i.e., ∼21:00 LT, during solar maximum compared with the culmination time, i.e., ∼22:00 LT during the solar minimum year, which is in agreement with the EPBs detected using CHAMP, and GRACE in situ measurements by Xiong et al. (2010). However, local time characteristics manifested in this paper slightly differ from the local time distribution presented by Carter et al. (2013). In the author's paper, occurrence of EPBs peaks about an hour later during the solar maximum year compared with the solar minimum year for all season–longitude analysis. The local time occurrence characteristics presented in Fig. 5 agree well with the argument conferred by Burke et al. (2009), suggesting that the slow process of gravity-driven currents over weak PRE magnitude influenced the EPB occurrence to peak at a relatively later local time during the solar minimum year.

Figure 4Latitudinal and local time dependence of equatorial plasma bubble occurrence in 01:00 LT by 5∘ latitudinal grid during 2014.

Figure 5Occurrence of plasma bubbles based on local time during the solar minimum year (2009) and solar maximum year (2014), respectively.
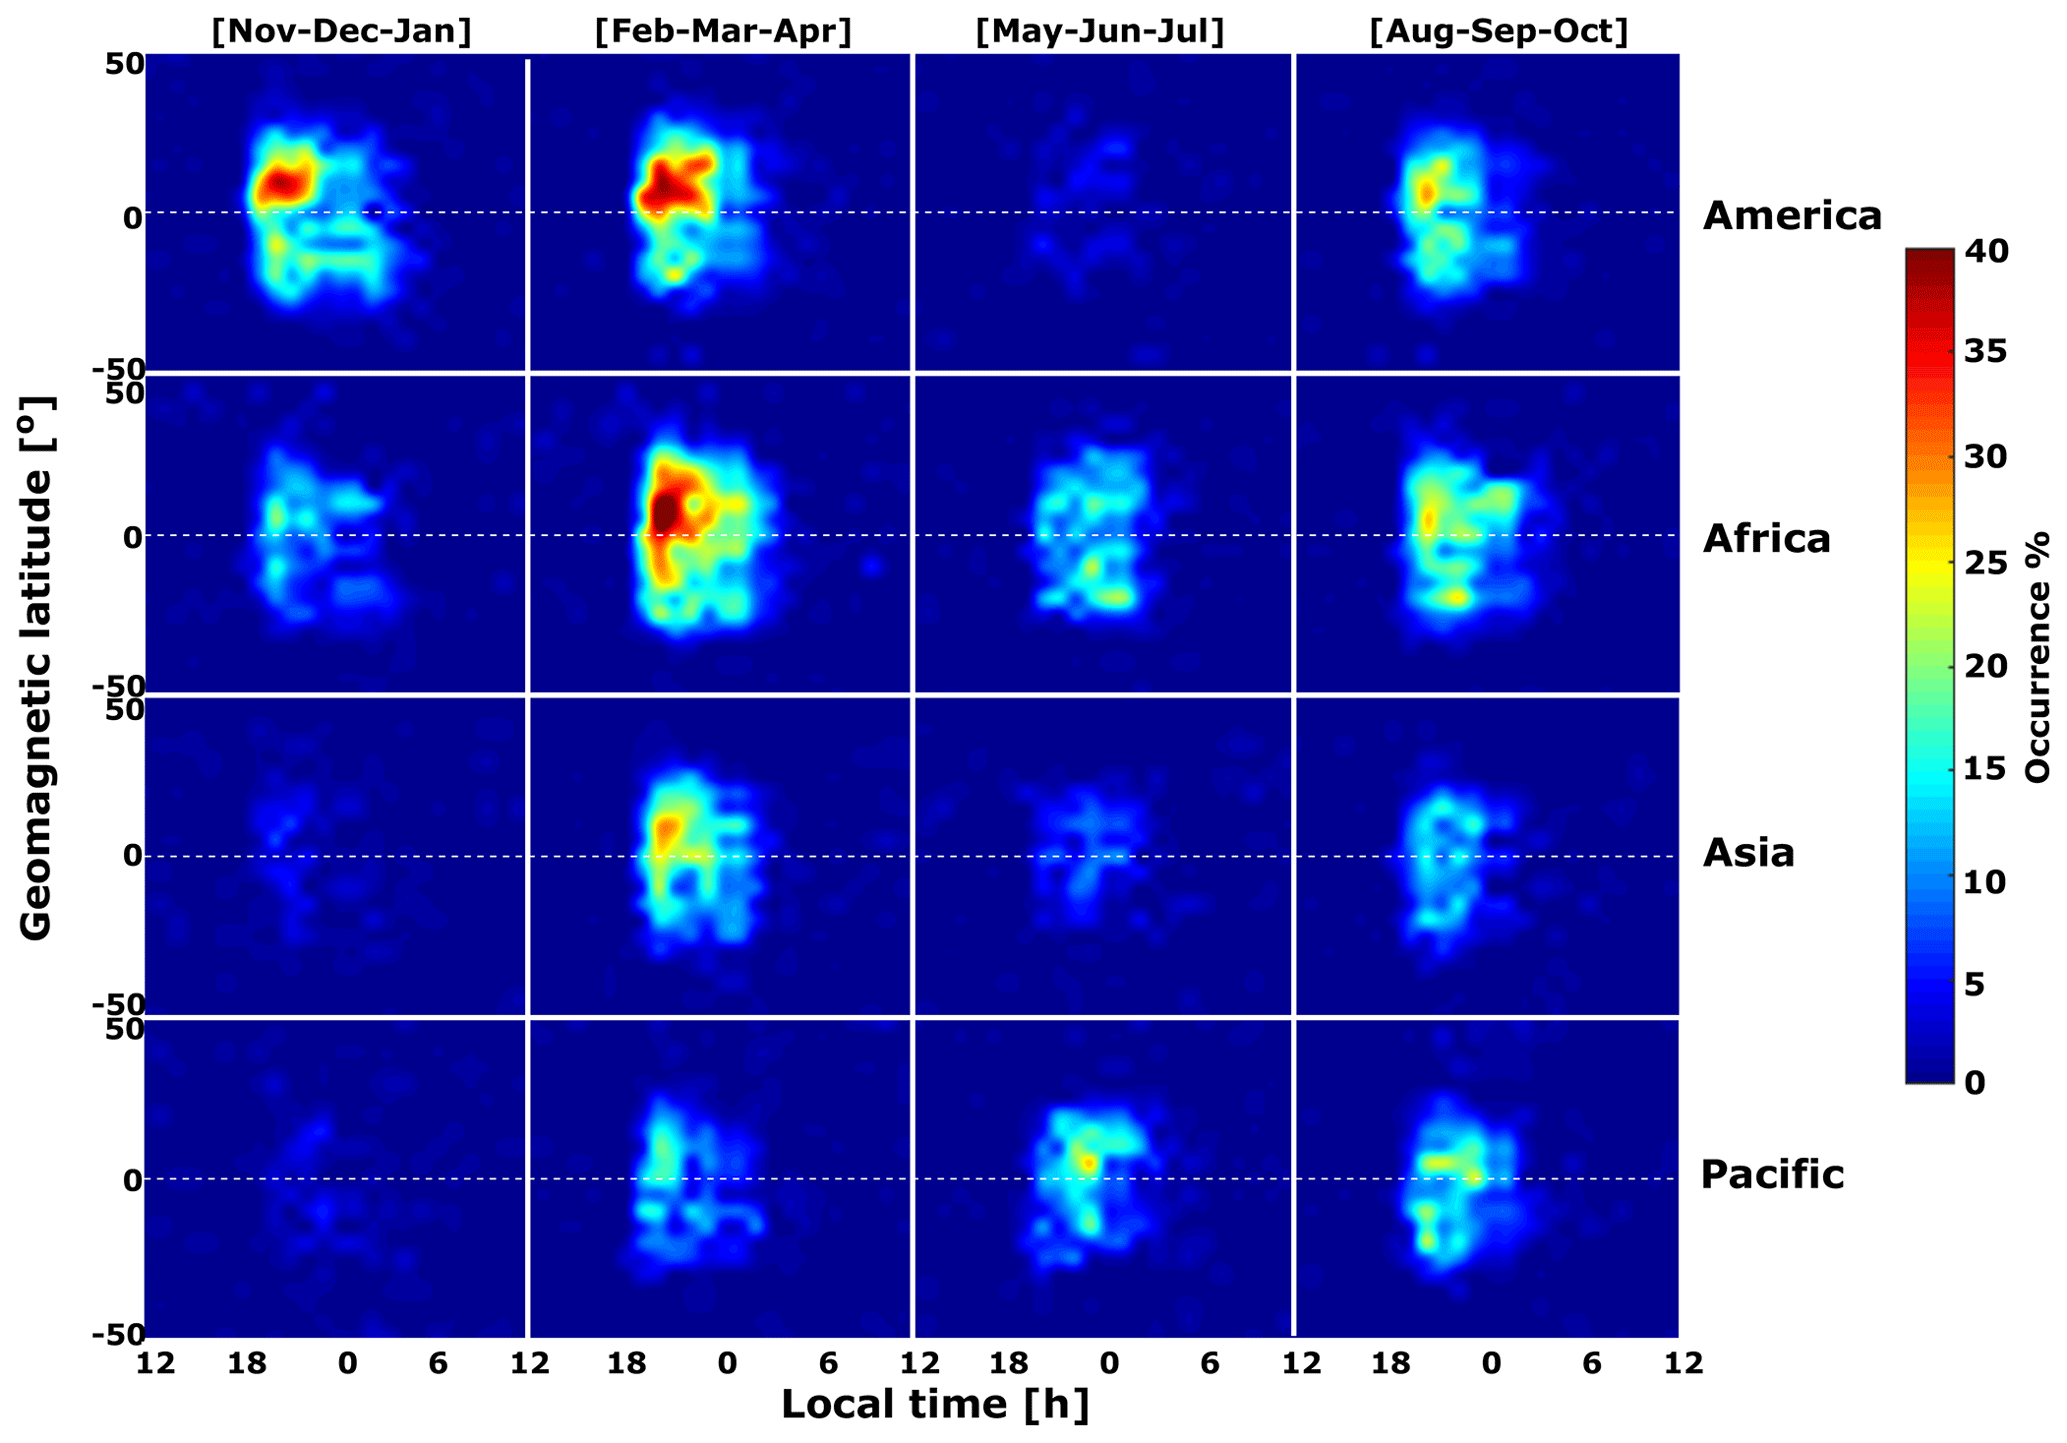
Figure 6EPB occurrence during the years 2012–2016 for different longitude sectors (regions) based on 3-month intervals (seasons) within 5∘ geomagnetic latitude by 01:00 LT in the bin. White dashed lines represent the geomagnetic dip equator.
3.2.1 Region-wise seasonal dependence of EPBs
Based on the argument by Tsunoda (1985), the region-wise seasonal occurrence of plasma bubbles depends on the close alignment of the magnetic field line with the sunset terminator. In order to analyze the region-wise seasonal occurrence characteristics of EPBs, the longitude extent was discretized in four different sectors of 90∘ each, which includes America (110–20∘ W), Africa (20∘ W–70∘ E), Asia (70–160∘ E), and the Pacific (160∘ E–110∘ W). These longitude sectors were compared further with different seasons based on a 3-month interval around each solstice and equinox. The region-wise seasonal occurrence envisaged in Fig. 6 is based on geomagnetic latitude with respect to local time, which is similar to the seasonal-longitude occurrence presented for solar minimum conditions (2007–2011) by Carter et al. (2013). In comparison, in this study, around 2.2 million profiles were analyzed to present EPB's distribution between 2012 and 2016 that covered the crest of solar cycle 24, i.e., 2014. In principle, EPBs were distributed on either side of the dip equator, with only one maximum on the positive side of the dip equator across all longitudes and seasons. By contrast, two maxima on either side of the dip equator were observed by Carter et al. (2013) during solar minimum conditions using FormoSat-3 ∕ COSMIC data, whereas only one peak at the dip equator was observed by Burke et al. (2004a) with Republic of China SATellite (ROCSAT)-1 observations in the period 2000–2002. The American region experienced a substantial occurrence of EPBs mostly across all seasons, except the June solstice (May–June–July), while the African region encountered the highest number of EPBs during the equinoxes and June solstice. Across all longitude sectors, Asia recorded the lowest occurrence rate of EPB for most of the seasons. In general, a maximum occurrence was observed during both the equinoxes in Africa and agrees well with the results presented by Burke et al. (2004b) and Su et al. (2008), but it differs from the maximum equinoctial occurrence in America presented by Carter et al. (2013). The discrepancy observed could be due to measurements taken for different solar conditions. Further, the American region experienced a peak occurrence of EPBs during the solar minimum conditions (Carter et al., 2013). However, during solar maximum conditions, the peak occurrence featured over the African region.
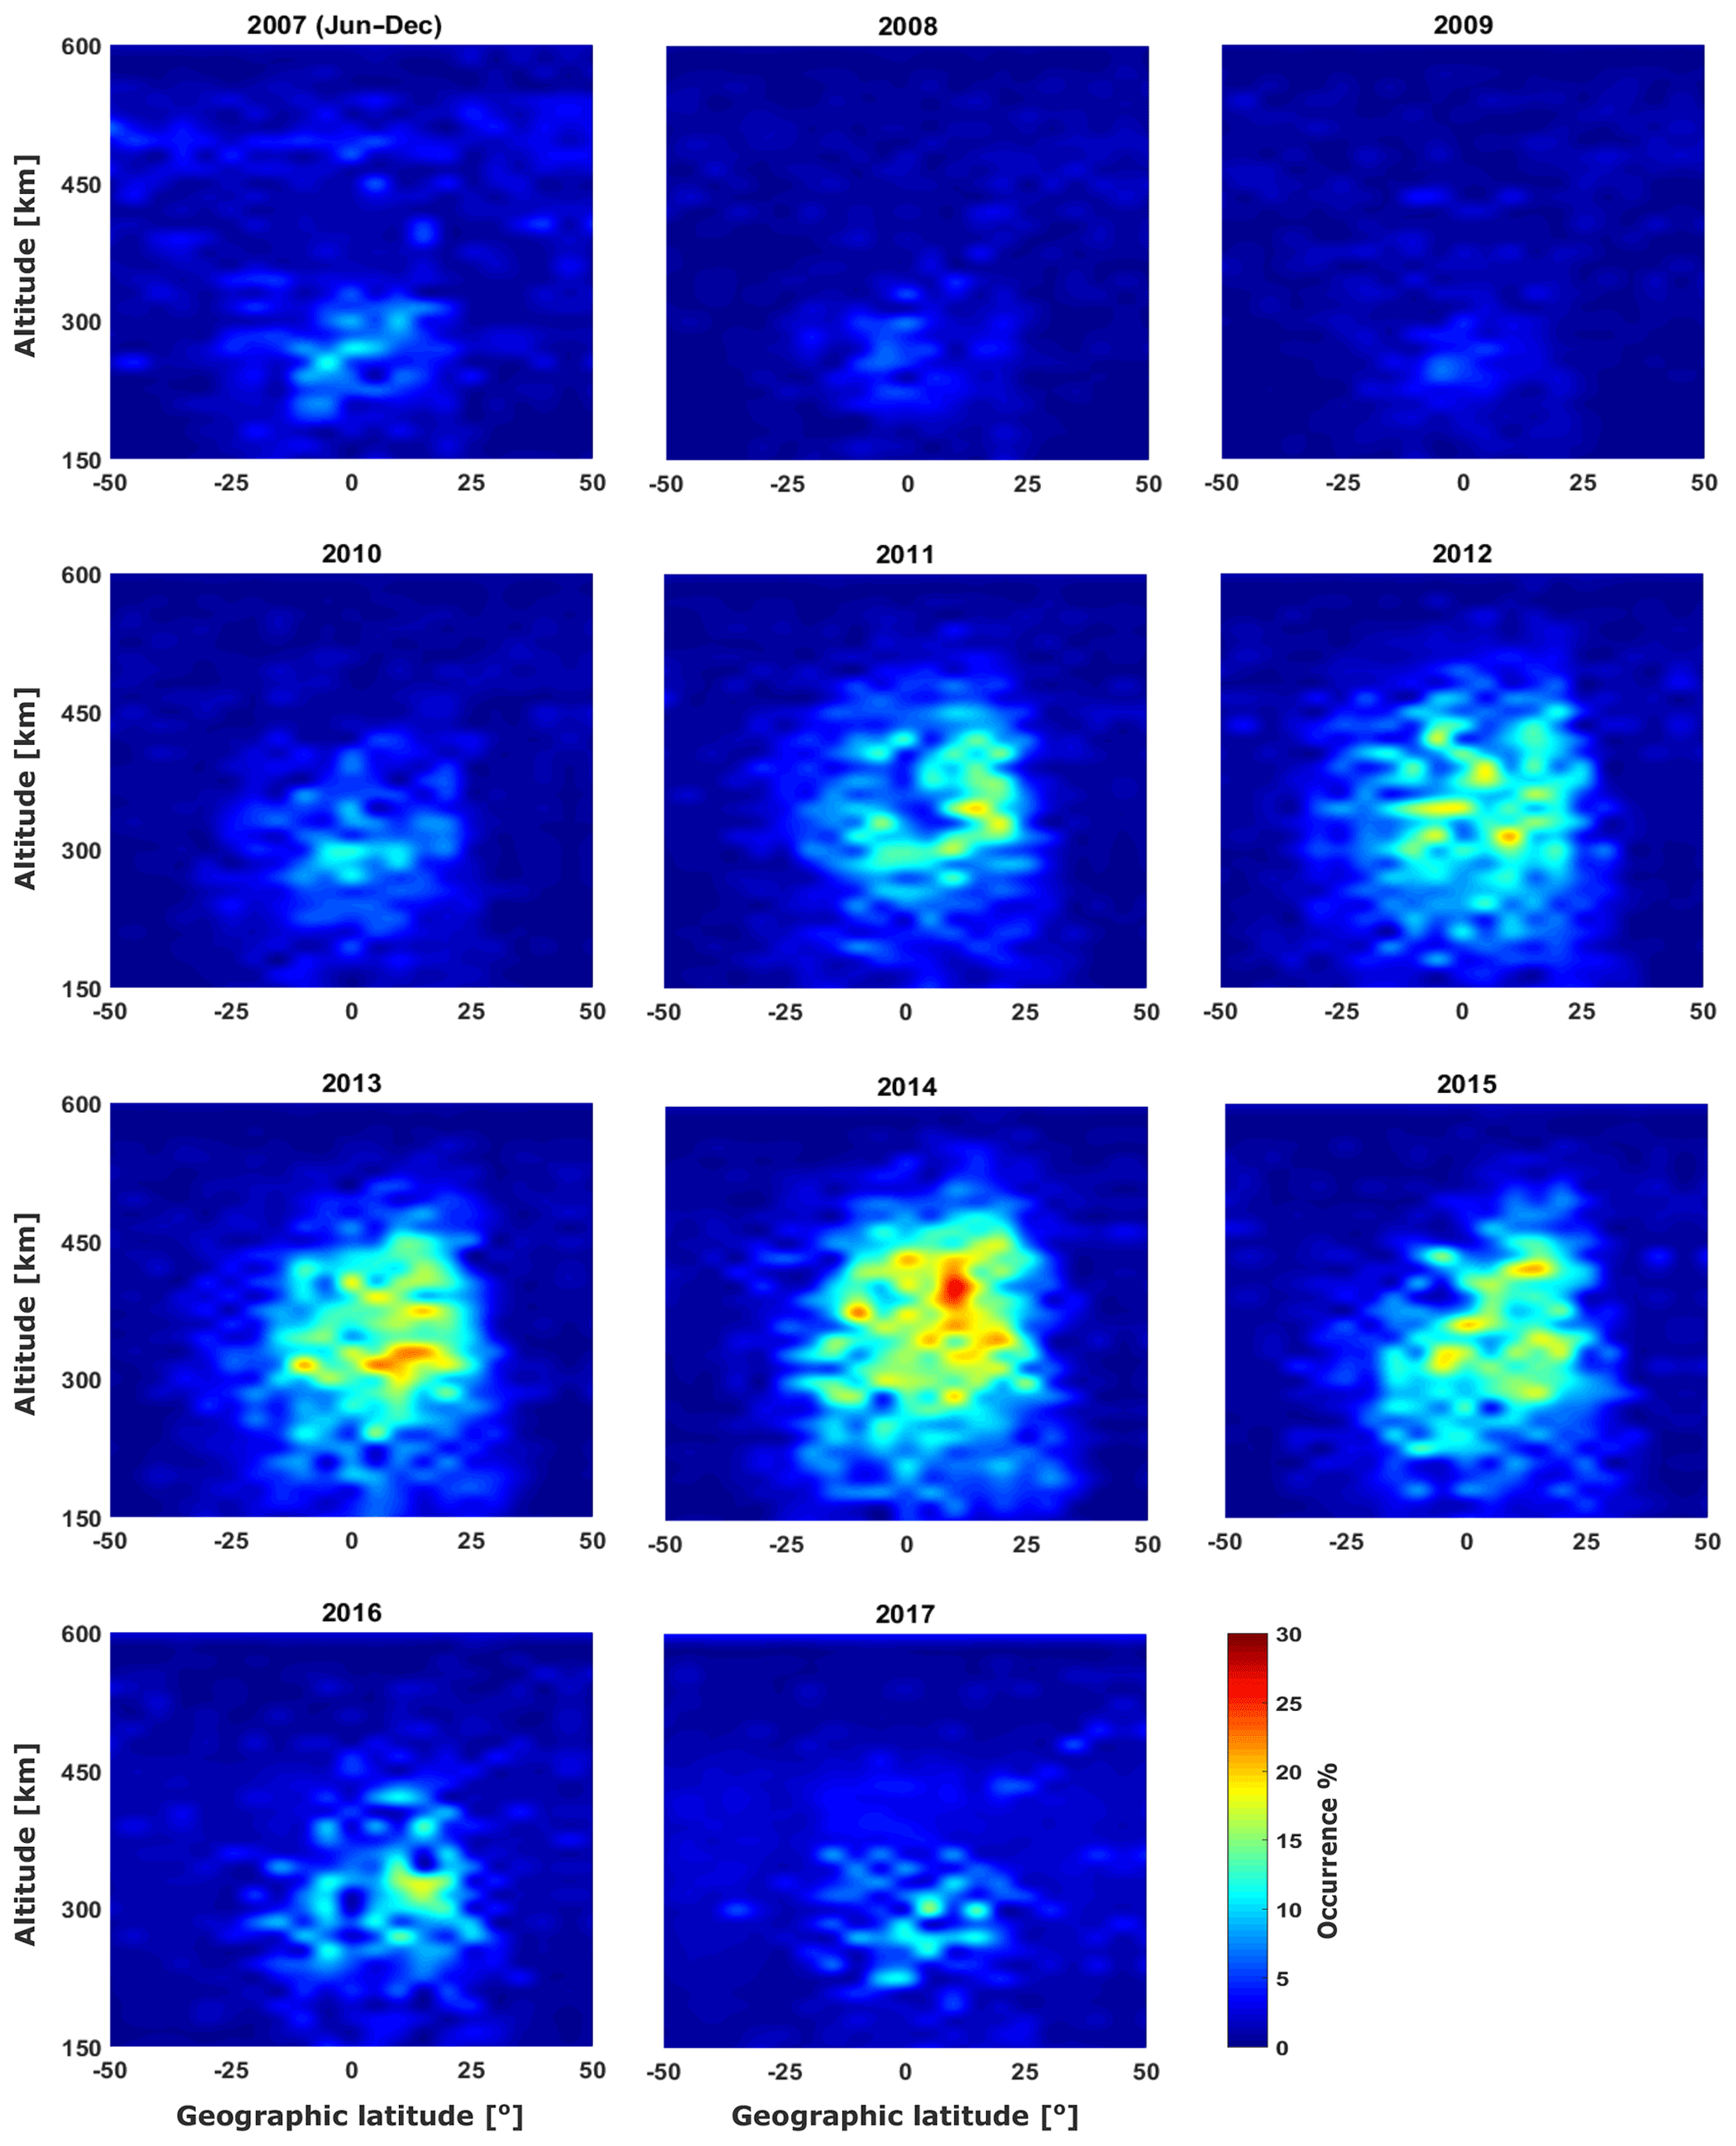
Figure 7Vertical distribution of equatorial plasma bubbles in 5∘ latitude by 20 km altitude grid during the years between mid-2007 and 2017.
Furthermore, asymmetries were observed in the equinox and solstice seasons. In the American region, almost negligible EPBs were detected during the June solstice compared with the rest of the seasons. According to Tsunoda (1985), this was due to a vaster sunset time lag in the June solstice, which constrained the formation of EPBs. By contrast, Africa, Asia, and the Pacific region recorded more EPBs during the June solstice compared with the December solstice (November–December–January). But for this scenario, the sunset time lag approach could not justify the occurrence; however, it was rationalized by Nishioka et al. (2008), citing the reason for the integrated flux tube conductivities in the F region and its seasonal occurrence, which proved to be favorable for the solstice asymmetry in the African, Asian, and Pacific sectors. For the equinox asymmetry, America, Africa, and Asia encountered a significant occurrence in the March equinox (February–March–April) compared to the September equinox (August–September–October), except for the Pacific region, which agreed well with Burke et al. (2004b). In general, the Eastern Hemisphere, e.g., Asian and parts of Pacific sectors, recorded few EPBs, because of the dominant magnetic field at the Equator, whereas comparably more EPBs were observed in the region of a relatively weak equatorial magnetic field, i.e., at the American and African longitudes (Burke et al., 2004a, b).
3.3 Altitude variations and solar cycle dependency
The FormoSat-3 ∕ COSMIC measurements provide height-dependent information, which is valuable as compared with the measurements obtained from the other contemporary techniques for investigating plasma bubbles on a global scale. Based on the generalized notion, EPBs are generated on the bottom side of the F region as a consequence of the RTI and move upwards through the electrodynamic process (Whalen, 1997; Kelley, 2009; Woodman, 2009). Figure 7 shows the altitude distribution of EPBs on an annual basis and shows that the occurrence of plasma bubbles is dependent on different conditions of the solar activity. The study also revealed that the periodic variation in the solar cycle plays an indirect role in influencing the vertical occurrence range of the plasma bubbles. Thus, during high solar activity in 2014, EPBs were spread over a sizeable range, while during low solar activity in 2009, a smaller altitude range was covered. Besides, the occurrence peak of EPBs during 2014 was found at ∼420 km, while during 2009, it occurred at ∼240 km. The altitudinal uplift of EPBs was mainly due to the magnitude of PRE, which is dependent on the solar activity (Fejer et al., 1999; Stolle et al., 2008; Abadi et al., 2015; Liu et al., 2016). In addition, EPBs primarily generated at the geomagnetic equator elongate in latitude due to the dominance of PRE (Abdu et al., 2003; Anderson et al., 2004; Liu et al., 2016). This is obvious in the altitude distribution of the plasma bubbles, wherein during low solar activity, EPBs were almost contained at the geomagnetic equator, whereas during high solar activity, EPBs were spread out on either side of the dip equator (Liu et al., 2016). The growth rate and the altitudinal variation of EPBs were an outcome of degenerated conductivity in the E region along with an enhanced zonal electric field at the sunset (Farley et al., 1970; Stolle et al., 2008; Su et al., 2014). Ideally, PRE lifts the plasma in the F-layer by means of E×B drift to an altitude where the neutral-ion collision frequency is low, which is inversely proportional to the growth rate of plasma bubbles (Fejer et al., 1999; Abadi et al., 2015). In the process, EPBs continue to proceed higher in altitude until the eastward electric field on the top of the bubble becomes zero, which eventually causes them to decay (Krall et al., 2010).

Figure 8Comparison plot of (a) sunspot cycle and (b) occurrence trend of equatorial plasma bubbles from mid-2007 to 2017, with monthly values and smoothed monthly values using a low-pass filter.
From the occurrence climatology presented in this paper, it is apparent that the influence of PRE causes EPBs to develop in accordance with the solar activity. Thus, more EPBs are detected during maximum solar activity compared to the minimum (Basu et al., 2002). A brief analogy in support of the argument is presented in Fig. 8, which shows the sunspot cycle and relative occurrence numbers of EPBs with semi-annual structures across different years. Figure 8a depicts the current sunspot cycle represented by the monthly sunspot numbers (blue solid line) and a smoothed curve (orange solid line), whereas Fig. 8b shows an annual occurrence trend of plasma bubbles characterized by monthly (red solid line) and smoothed monthly values (green solid line) from mid-2007 to 2017. On the global spectrum, the EPBs occur in line with solar activity; however, this was not a typical scenario on a regional basis. Nishioka et al. (2008) showed that the dependence of solar activity in specific longitude sectors does not influence the occurrence rate of EPBs. For example, EPBs in the African and Asian sectors appear in congruence with the solar cycle; however, the same was not observed in the American sector, as revealed in Fig. 3. This most likely appeared due to the presence of gravity wave perturbations, which seed EPBs despite weak PRE magnitudes during solar minimum conditions in the South American region (Burke et al., 2004a; Stolle et al., 2008; Su et al., 2014).
This paper provides a brief occurrence climatology of EPBs covering around 10.5 years of GPS-RO measurements from FormoSat-3 ∕ COSMIC. The scintillations in the signals caused by the EPBs were detected using an amplitude scintillation index known as the S4 index. By classifying the S4 data, subsequent analyses were carried out by exploiting the strong scintillation events. In this study, EPBs occur at the crest anomaly latitudes along the geomagnetic equator and have peak occurrence oscillating between America and Africa for solar minimum and solar maximum years, respectively. Further, the annual global distribution of EPBs showed congruency with solar activity, especially in Africa, thus implying the influence of vertical drift from PRE, which also depends on the solar activity. However, there is no apparent dependence on the solar cycle in the American sector. In hindsight, gravity-driven currents are known to have a good correlation with the occurrence of plasma bubbles solely in the American area. Therefore, it is presupposed that EPBs are triggered with different seed perturbations for different regions. From the local time occurrence, EPBs are considered to develop post-sunset around 19:00 LT, right after the enhancement in the zonal eastward electric field at the sunset. Moreover, EPBs generated during a solar maximum year peak at an hour earlier compared to EPBs during the solar minimum year. This implies a dependency on PRE, which has a larger magnitude of vertical plasma drift during high solar activity compared with low solar activity. On the other hand, region-wise seasonal occurrence shows maximum EPBs in Africa during the March equinox. Almost in all longitude sectors, more EPBs were detected in the March equinox compared to the September equinox, whereas for solstice months, it agrees with the argument from Tsunoda (1985), in which more EPBs were encountered at longitudes with positive (negative) declination during June (December) solstice and have good agreement with Burke et al. (2004b), Su et al. (2008), and Carter et al. (2013). These EPBs, which are provoked by PRE, show a strong dependence on the periodic variation in solar activity with a greater altitude extent during high solar activity. In principle, throughout the global analyses, a comparison with the sunspot cycle with the annual EPB occurrence reveals a strong dependence on solar activity. Recently, based on a comparative study of EPBs using CHAMP and GRACE in situ measurements, Xiong et al. (2010) articulated that more EPBs get detected at an altitude below 300 km, compared to the above. However, since the in situ measurements encounter EPBs at an orbit altitude usually above 400 km, only some signatures of EPBs, e.g., only small dips in the plasma density, are detected. Thus, the GPS-RO technique seems promising in understanding the global EPBs and can also perform as a complementary technique in analyzing such ionospheric irregularities because of unique measurements available as a result of vertical soundings on a global scale.
Ionospheric radio occultation data are based on the FormoSat-3 ∕ COSMIC satellite mission available from CDAAC https://cdaac-www.cosmic.ucar.edu/cdaac/tar/rest.html (COSMIC Data Analysis and Archive Center, 2018). The dataset for the solar sunspot number is obtained from the Sunspot Index and Long term Solar Observations website http://www.sidc.be/silso/datafiles (SILSO World Data Center, 2019).
AK performed the analysis and drafted the manuscript with the help of CA and JW, HS, MA, and LCT, who also provided constructive scientific advice.
The authors declare that they have no conflict of interest.
This article is part of the special issue “Vertical coupling in the atmosphere–ionosphere system”. It is a result of the 7th Vertical Coupling workshop, Potsdam, Germany, 2–6 July 2018.
The authors recognize the efforts of the FormoSat-3 ∕ COSMIC team and are grateful to them for providing the measurements.
This research has been supported by
Priority Program DynamicEarth
SPP1788 for Christina Arras and
(grant no. SCHU 1103/15-1) for Ankur Kepkar, both under the Deutsche Forschungsgemeinschaft.
The article processing charges for this open-access
publication were covered by a Research
Centre of the Helmholtz Association.
This paper was edited by William Ward and reviewed by three anonymous referees.
Aarons, J.: Global morphology of ionospheric scintillations, Proc. IEEE, Institute of Electrical and Electronics Engineers, 70, 360–378, 1982. a
Aarons, J., Whitney, H. E., MacKenzie, E., and Basu, S.: Microwave equatorial scintillation intensity during solar maximum, Radio Sci., 16, 939–945, 1981. a
Abadi, P., Otsuka, Y., and Tsugawa, T.: Effects of pre-reversal enhancement of E × B drift on the latitudinal extension of plasma bubble in Southeast Asia, Earth Planet. Space, 67, 1–7, https://doi.org/10.1186/s40623-015-0246-7, 2015. a, b, c, d, e, f
Abdu, M., MacDougall, J., Batista, I., Sobral, J., and Jayachandran, P.: Equatorial evening prereversal electric field enhancement and sporadic E layer disruption: A manifestation of E and F region coupling, J. Geophys. Res.-Space, 108, 1254–1267, https://doi.org/10.1029/2002JA009285, 2003. a, b, c
Abdu, M. A., Alam Kherani, E., Batista, I. S., de Paula, E. R., Fritts, D. C., and Sobral, J. H. A.: Gravity wave initiation of equatorial spread F ∕ plasma bubble irregularities based on observational data from the SpreadFEx campaign, Ann. Geophys., 27, 2607–2622, https://doi.org/10.5194/angeo-27-2607-2009, 2009. a
Anderson, D. N., Reinisch, B., Valladare, C., Chau, J., and Veliz, O.: Forecasting the occurrence of ionospheric scintillation activity in the equatorial ionosphere on a day-to-day basis, J. Atmos. Sol.-Terr. Phys., 66, 1567–1572, https://doi.org/10.1016/j.jastp.2004.07.010, 2004. a
Anthes, R. A., Bernhardt, P. A., Chen, Y., Cucurull, L., Dymond, K. F., Ector, D., Healy, S. B., Ho, S. P., Hunt, D. C., Kuo, Y. H., Liu, H., Ko, M., McCormick, C., Meehan, T., Randel, W. J., Rocken, C., Schreiner, W. S., Sokolovskiy, S. V., Syndergaard, S., Thompson, D. C., Trenberth, K. E., Wee, T. K., Yen, N. L., and Zeng, Z.: The COSMIC/FORMOSAT-3 mission: Early results, B. Am. Meteorol. Soc., 89, 313–333, https://doi.org/10.1175/BAMS-89-3-313, 2008. a, b
Arras, C.: A Global Survey of Sporadic E Layers based on GPS Radio Occultations by CHAMP, GRACE and FORMOSAT-3/COSMIC, Scientific Technical Report (STR) 10/09, German Research Centre for Geosciences GFZ, Potsdam, 10/09, 1–119, https://doi.org/10.2312/GFZ.b103-10097, 2010. a
Arras, C. and Wickert, J.: Estimation of ionospheric sporadic E intensities from GPS radio occultation measurements, J. Atmos. Sol.-Terr. Phys., 171, 60–63, https://doi.org/10.1016/j.jastp.2017.08.006, 2018. a
Arras, C., Wickert, J., Beyerle, G., Heise, S., Schmidt, T., and Jacobi, C.: A global climatology of ionospheric irregularities derived from GPS radio occultation, Geophys. Res. Lett., 35, L14809, https://doi.org/10.1029/2008GL034158, 2008. a, b
Arras, C., Jacobi, C., Wickert, J., Heise, S., and Schmidt, T.: Sporadic E signatures revealed from multi-satellite radio occultation measurements, Adv. Radio Sci., 8, 225–230, https://doi.org/10.5194/ars-8-225-2010, 2010. a
Basu, S., MacKenzie, E., and Basu, S.: Ionospheric constraints on VHF/UHF communications links during solar maximum and minimum periods, Radio Sci., 23, 363–378, https://doi.org/10.1029/RS023i003p00363, 1988. a
Basu, S., Groves, K., Quinn, J., and Doherty, P.: A comparison of TEC fluctuations and scintillations at Ascension Island, J. Atmos. Sol.-Terr. Phys., 61, 1219–1226, https://doi.org/10.1016/S1364-6826(99)00052-8, 1999. a
Basu, S., Groves, K., Basu, S., and Sultan, P.: Specification and forecasting of scintillations in communication/navigation links: current status and future plans, J. Atmos. Sol.-Terr. Phys., 64, 1745–1754, https://doi.org/10.1016/S1364-6826(02)00124-4, 2002. a, b, c
Booker, H. and Wells, H.: Scattering of radio waves by the F-region of the ionosphere, J. Geophys. Res., 43, 249–256, 1938. a
Brahmanandam, P., Uma, G., Liu, J., Chu, Y., Latha Devi, N., and Kakinami, Y.: Global S4 index variations observed using FORMOSAT-3/COSMIC GPS RO technique during a solar minimum year, J. Geophys. Res.-Space, 117, A09322, https://doi.org/10.1029/2012JA017966, 2012. a
Burke, W., Gentile, L., Huang, C., Valladares, C., and Su, S.: Longitudinal variability of equatorial plasma bubbles observed by DMSP and ROCSAT-1, J. Geophys. Res.-Space, 109, A12301, https://doi.org/10.1029/2004JA010583, 2004a. a, b, c, d, e
Burke, W., Huang, C., Gentile, L., and Bauer, L.: Seasonal-longitudinal variability of equatorial plasma bubbles, Ann. Geophys., 22, 3089–3098, https://doi.org/10.5194/angeo-22-3089-2004, 2004b. a, b, c, d
Burke, W., de La Beaujardière, O., Gentile, L., Hunton, D., Pfaff, R., Roddy, P., Su, Y.-J., and Wilson, G.: C/NOFS observations of plasma density and electric field irregularities at post-midnight local times, Geophys. Res. Lett., 36, L00C09, https://doi.org/10.1029/2009GL038879, 2009. a
Carrano, C. S. and Groves, K. M.: TEC gradients and fluctuations at low latitudes measured with high data rate GPS receivers, in: Proceedings of the 63rd annual meeting of the Institute of Navigation, Cambridge, MA, 156–163, 2007. a
Carter, B. A., Zhang, K., Norman, R., Kumar, V. V., and Kumar, S.: On the occurrence of equatorial F-region irregularities during solar minimum using radio occultation measurements, J. Geophys. Res.-Space, 118, 892–904, https://doi.org/10.1002/jgra.50089, 2013. a, b, c, d, e, f, g, h
Chu, C.-H., Fong, C.-J., Xia-Serafino, W., Shiau, A., Taylor, M., Chang, M.-S., Chen, W.-J., Liu, T.-Y., Liu, N.-C., Martins, B., Garcia, J. R., and Da Silva Curiel, A.: An Era of Constellation Observation-FORMOSAT-3/COSMIC and FORMOSAT-7/COSMIC-2, Journal of Aeronautics, Astronautics and Aviation, 50, 335–346, 2018. a
COSMIC Data Analysis and Archive Center: COSMIC Ionospheric Excess Phase data, available at: https://cdaac-www.cosmic.ucar.edu/cdaac/tar/rest.html, last access: 25 October 2018.
Dao, E., Kelley, M., Roddy, P., Retterer, J., Ballenthin, J., de La Beaujardiere, O., and Su, Y.-J.: Longitudinal and seasonal dependence of nighttime equatorial plasma density irregularities during solar minimum detected on the C/NOFS satellite, Geophys. Res. Lett., 38, L10104, https://doi.org/10.1029/2011GL047046, 2011. a
Farley, D., Balsey, B., Woodman, R., and McClure, J.: Equatorial spread F: Implications of VHF radar observations, J. Geophys. Res., 75, 7199–7216, https://doi.org/10.1029/JA075i034p07199, 1970. a, b, c, d
Fejer, B. G. and Kelley, M.: Ionospheric irregularities, Rev. Geophys., 18, 401–454, https://doi.org/10.1029/RG018i002p00401, 1980. a
Fejer, B. G., Scherliess, L., and De Paula, E.: Effects of the vertical plasma drift velocity on the generation and evolution of equatorial spread F, J. Geophys. Res.-Space, 104, 19859–19869, https://doi.org/10.1029/1999JA900271, 1999. a, b
Gentile, L., Burke, W., and Rich, F.: A global climatology for equatorial plasma bubbles in the topside ionosphere, Ann. Geophys., 24, 163–172, 2006. a, b
Hajj, G. A., Kursinski, E., Romans, L., Bertiger, W., and Leroy, S.: A technical description of atmospheric sounding by GPS occultation, J. Atmos. Sol.-Terr. Phys., 64, 451–469, 2002. a
Hanson, W. and Sanatani, S.: Large Ni gradients below the equatorial F peak, J. Geophys. Res., 78, 1167–1173, https://doi.org/10.1029/JA078i007p01167, 1973. a
Huang, C., Burke, W., Machuzak, J., Gentile, L., and Sultan, P.: DMSP observations of equatorial plasma bubbles in the topside ionosphere near solar maximum, J. Geophys. Res.-Space, 106, 8131–8142, https://doi.org/10.1029/2000JA000319, 2001. a
Huang, C.-S., de La Beaujardiere, O., Roddy, P., Hunton, D., Pfaff, R., Valladares, C., and Ballenthin, J.: Evolution of equatorial ionospheric plasma bubbles and formation of broad plasma depletions measured by the C/NOFS satellite during deep solar minimum, J. Geophys. Res.-Space, 116, A03309, https://doi.org/10.1029/2010JA015982, 2011. a, b
Jakowski, N., Leitinger, R., and Angling, M.: Radio occultation techniques for probing the ionosphere, Ann. Geophys., 47, 1049–1066, 2004. a, b
Kelley, M.: The Earth's Ionosphere: Plasma Physics and Electrodynamics, International geophysics series, Academic Press, 1–561, 2009. a
Kil, H., Paxton, L. J., and Oh, S.-J.: Global bubble distribution seen from ROCSAT-1 and its association with the evening prereversal enhancement, J. Geophys. Res.-Space, 114, A06307, https://doi.org/10.1029/2008JA013672, 2009. a
Krall, J., Huba, J., Ossakow, S., and Joyce, G.: Why do equatorial ionospheric bubbles stop rising?, Geophys. Res. Lett., 37, L09105, https://doi.org/10.1029/2010GL043128, 2010. a
Kudeki, E. and Bhattacharyya, S.: Postsunset vortex in equatorial F-region plasma drifts and implications for bottomside spread-F, J. Geophys. Res.-Space, 104, 28163–28170, https://doi.org/10.1029/1998JA900111, 1999. a, b
Kudeki, E., Akgiray, A., Milla, M., Chau, J. L., and Hysell, D. L.: Equatorial spread-F initiation: Post-sunset vortex, thermospheric winds, gravity waves, J. Atmos. Sol.-Terr. Phys., 69, 2416–2427, https://doi.org/10.1016/j.jastp.2007.04.012, 2007. a
Kursinski, E. R., Hajj, G. A., Schofield, J. T., Linfield, R. P., and Hardy, K. R.: Observing Earth's atmosphere with radio occultation measurements using the Global Positioning System, J. Geophys. Res.-Atmos., 102, 23429–23465, https://doi.org/10.1029/97JD01569, 1997. a
Kursinski, E. R., Hajj, G. A., Leroy, S. S., and Herman, B.: The GPS Radio Occultation Technique, Terr. Atmos. Ocean. Sci., 11, 53–114, 1999. a
Lei, J., Syndergaard, S., Burns, A. G., Solomon, S. C., Wang, W., Zeng, Z., Roble, R. G., Wu, Q., Kuo, Y.-H., Holt, J. M., Zhang, S.-R., Hysell, D. L., Rodrigues, F. S., and Lin, C. H.: Comparison of COSMIC ionospheric measurements with ground-based observations and model predictions: Preliminary results, J. Geophys. Res.-Space, 112, A07308, https://doi.org/10.1029/2006JA012240, 2007. a
Li, G., Ning, B., Liu, L., Ren, Z., Lei, J., and Su, S.-Y.: The correlation of longitudinal/seasonal variations of evening equatorial pre-reversal drift and of plasma bubbles, Ann. Geophys., 25, 2571–2578, https://doi.org/10.5194/angeo-25-2571-2007, 2007. a
Liu, J., Chen, S., Yeh, W., Tsai, H., and Rajesh, P.: Worst-case GPS scintillations on the ground estimated from radio occultation observations of FORMOSAT-3/COSMIC during 2007–2014, Surv. Geophys., 37, 791–809, https://doi.org/10.1007/s10712-015-9355-x, 2016. a, b, c, d
Martinis, C. and Mendillo, M.: Equatorial spread F-related airglow depletions at Arecibo and conjugate observations, J. Geophys. Res.-Space, 112, A10310, https://doi.org/10.1029/2007JA012403, 2007. a
McClure, J., Hanson, W., and Hoffman, J.: Plasma bubbles and irregularities in the equatorial ionosphere, J. Geophys. Res., 82, 2650–2656, https://doi.org/10.1029/JA082i019p02650, 1977. a
McClure, J., Singh, S., Bamgboye, D., Johnson, F., and Kil, H.: Occurrence of equatorial F region irregularities: Evidence for tropospheric seeding, J. Geophys. Res.-Space, 103, 29119–29135, https://doi.org/10.1029/98JA02749, 1998. a
Nishioka, M., Saito, A., and Tsugawa, T.: Occurrence characteristics of plasma bubble derived from global ground-based GPS receiver networks, J. Geophys. Res.-Space, 113, A05301, https://doi.org/10.1029/2007JA012605, 2008. a, b, c
Park, J., Min, K. W., Kim, V. P., Kil, H., Lee, J.-J., Kim, H.-J., Lee, E., and Lee, D. Y.: Global distribution of equatorial plasma bubbles in the premidnight sector during solar maximum as observed by KOMPSAT-1 and Defense Meteorological Satellite Program F15, J. Geophys. Res.-Space, 110, A07308, https://doi.org/10.1029/2004JA010817, 2005. a
Retterer, J. M. and Roddy, P.: Faith in a seed: on the origins of equatorial plasma bubbles, Ann. Geophys., 32, 485–498, https://doi.org/10.5194/angeo-32-485-2014, 2014. a
Rocken, C., Anthes, R., Exner, M., Hunt, D., Sokolovskiy, S., Ware, R., Gorbunov, M., Schreiner, W., Feng, D., Herman, B., Kuo, Y.-H., and Zou, X.: Analysis and validation of GPS/MET data in the neutral atmosphere, J. Geophys. Res.-Atmos., 102, 29849–29866, https://doi.org/10.1029/97JD02400, 1997. a
Röttger, J.: Equatorial spread-F by electric fields and atmospheric gravity waves generated by thunderstorms, J. Atmos. Terr. Phys., 43, 453–462, https://doi.org/10.1016/0021-9169(81)90108-2, 1981. a
Sahai, Y., Aarons, J., Mendillo, M., Baumgardner, J., Bittencourt, J., and Takahashi, H.: OI 630 nm imaging observations of equatorial plasma depletions at 16 S dip latitude, J. Atmos. Terr. Phys., 56, 1461–1475, https://doi.org/10.1016/0021-9169(94)90113-9, 1994. a
Sahai, Y., Fagundes, P., and Bittencourt, J.: Transequatorial F-region ionospheric plasma bubbles: solar cycle effects, J. Atmos. Sol.-Terr. Phys., 62, 1377–1383, https://doi.org/10.1016/S1364-6826(00)00179-6, 2000. a, b, c
SILSO World Data Center: The International Sunspot Number, available at: http://www.sidc.be/silso/datafiles, last access: 20 January 2019.
Singh, S., Johnson, F., and Power, R.: Gravity wave seeding of equatorial plasma bubbles, J. Geophys. Res.-Spaces, 102, 7399–7410, https://doi.org/10.1029/96JA03998, 1997. a
Stolle, C., Lühr, H., Rother, M., and Balasis, G.: Magnetic signatures of equatorial spread F as observed by the CHAMP satellite, J. Geophys. Res.-Space, 111, A02304, https://doi.org/10.1029/2005JA011184, 2006. a, b
Stolle, C., Lühr, H., and Fejer, B.: Relation between the occurrence rate of ESF and the equatorial vertical plasma drift velocity at sunset derived from global observations, Ann. Geophys., 26, 3979–3988, https://doi.org/10.5194/angeo-26-3979-2008, 2008. a, b, c, d
Su, S.-Y., Chao, C., and Liu, C.: On monthly/seasonal/longitudinal variations of equatorial irregularity occurrences and their relationship with the postsunset vertical drift velocities, J. Geophys. Res.-Space, 113, A05307, https://doi.org/10.1029/2007JA012809, 2008. a, b
Su, S.-Y., Wu, C. L., and Liu, C. H.: Correlation between the global occurrences of ionospheric irregularities and deep atmospheric convective clouds in the intertropical convergence zone (ITCZ), Earth Planet. Space, 66, 1341–1348, https://doi.org/10.1186/1880-5981-66-134, 2014. a, b, c
Sultan, P.: Linear theory and modeling of the Rayleigh-Taylor instability leading to the occurrence of equatorial spread F, J. Geophys. Res.-Space, 101, 26875–26891, https://doi.org/10.1029/96JA00682, 1996. a
Syndergaard, S.: COSMIC S4 Data, COSMIC Data Analysis and Archival Center at UCAR, available at: https://tacc.cwb.gov.tw/cdaac/doc/documents/s4_description.pdf (last access: 1 July 2018), 2006. a, b
Taori, A., Patra, A., and Joshi, L.: Gravity wave seeding of equatorial plasma bubbles: An investigation with simultaneous F region, E region, and middle atmospheric measurements, J. Geophys. Res.-Space, 116, A05310, https://doi.org/10.1029/2010JA016229, 2011. a
Tsai, L.-C., Su, S.-Y., and Liu, C.-H.: Global morphology of ionospheric F-layer scintillations using FS3/COSMIC GPS radio occultation data, GPS Solut., 21, 1037–1048, https://doi.org/10.1007/s10291-016-0591-4, 2017. a, b
Tsai, L.-C., Su, S.-Y., Liu, C.-H., Schuh, H., Wickert, J., and Alizadeh, M. M.: Global morphology of ionospheric sporadic E layer from the FormoSat-3 ∕ COSMIC GPS radio occultation experiment, GPS Solut., 22, 1181–11812, 2018. a
Tsunoda, R. T.: Magnetic-field-aligned characteristics of plasma bubbles in the nighttime equatorial ionosphere, J. Atmos. Terr. Phys., 42, 743–752, https://doi.org/10.1016/0021-9169(80)90057-4, 1980. a
Tsunoda, R. T.: Control of the seasonal and longitudinal occurrence of equatorial scintillations by the longitudinal gradient in integrated E region Pedersen conductivity, J. Geophys. Res.-Space, 90, 447–456, https://doi.org/10.1029/JA090iA01p00447, 1985. a, b, c, d
Tsunoda, R. T.: Seeding of equatorial plasma bubbles with electric fields from an Es-layer instability, J. Geophys. Res.-Space, 112, A06304, https://doi.org/10.1029/2006JA012103, 2007. a
Tsunoda, R. T.: On seeding equatorial spread F: Circular gravity waves, Geophys. Res. Lett., 37, L10104, https://doi.org/10.1029/2010GL043422, 2010. a
Tsunoda, R. T.: Upwelling: a unit of disturbance in equatorial spread F, Prog. Earth Plan. Sc, 2, 1–14, https://doi.org/10.1186/s40645-015-0038-5, 2015. a
Whalen, J.: Equatorial bubbles observed at the north and south anomaly crests: Dependence on season, local time, and dip latitude, Radio Sci., 32, 1559–1566, https://doi.org/10.1029/97RS00285, 1997. a, b, c, d
Wickert, J., Reigber, C., Beyerle, G., König, R., Marquardt, C., Schmidt, T., Grunwaldt, L., Galas, R., Meehan, T. K., Melbourne, W. G., and Hocke, K.: Atmosphere sounding by GPS radio occultation: First results from CHAMP, Geophys. Res. Lett., 28, 3263–3266, https://doi.org/10.1029/2001GL013117, 2001. a, b
Wickert, J., Beyerle, G., Hajj, G. A., Schwieger, V., and Reigber, C.: GPS radio occultation with CHAMP: Atmospheric profiling utilizing the space-based single difference technique, Geophys. Res. Lett., 29, 1–4, https://doi.org/10.1029/2001GL013982, 2002. a
Wickert, J., Schmidt, T., Beyerle, G., König, R., Reigber, C., and Jakowski, N.: The radio occultation experiment aboard CHAMP: Operational data analysis and validation of vertical atmospheric profiles, J. Meteorol. Soc. Jpn. Ser. II, 82, 381–395, https://doi.org/10.2151/jmsj.2004.381, 2004. a
Wickert, J., Michalak, G., Schmidt, T., Beyerle, G., Cheng, C.-Z., Healy, S. B., Heise, S., Huang, C.-Y., Jakowski, N., Köhler, W., Mayer, C., Offiler, D., Ozawa, E., Pavelyev, A., Rothacher, M., Tapley, B., and Arras, C.: GPS Radio Occultation: Results from CHAMP, GRACE and FORMOSAT-3/COSMIC, Terrestrial, Atmos. Ocean. Sci., 20, 35–50, https://doi.org/10.3319/TAO.2007.12.26.01(F3C), 2009. a, b, c
Woodman, R. F.: Spread F – an old equatorial aeronomy problem finally resolved?, Ann. Geophys., 27, 1915–1934, https://doi.org/10.5194/angeo-27-1915-2009, 2009. a, b
Woodman, R. F. and La Hoz, C.: Radar observations of F region equatorial irregularities, J. Geophys. Res., 81, 5447–5466, https://doi.org/10.1029/JA081i031p05447, 1976. a, b
Xiong, C., Park, J., Lühr, H., Stolle, C., and Ma, S. Y.: Comparing plasma bubble occurrence rates at CHAMP and GRACE altitudes during high and low solar activity, Ann. Geophys., 28, 1647–1658, https://doi.org/10.5194/angeo-28-1647-2010, 2010. a, b, c
Yeh, K. C. and Liu, C.-H.: Radio wave scintillations in the ionosphere, Proc. IEEE, Institute of Electrical and Electronics Engineers, 70, 324–360, https://doi.org/10.1109/PROC.1982.12313, 1982. a
Yokoyama, T.: A review on the numerical simulation of equatorial plasma bubbles toward scintillation evaluation and forecasting, Prog. Earth Plan. Sc., 4, 1–13, https://doi.org/10.1186/s40645-017-0153-6, 2017. a