the Creative Commons Attribution 4.0 License.
the Creative Commons Attribution 4.0 License.
 | 20 Apr 2020
Stratification observed by the in situ plasma density measurements from the Swarm satellites
Wanli Cheng
Zihan Zhou
Dehe Yang
Jing Cui
Feng Guo
The stratification phenomenon is investigated using the simultaneous
in situ plasma density measurements obtained by the Swarm satellites
orbiting at different altitudes above the F2 peak. For the first time, the
continuous distribution morphology and the exact locations are obtained for
the nighttime stratification, which show that the stratification events are
centered at the EIA (equatorial ionization anomaly) trough and extend
towards the two EIA crests, with the most significant part being located at
the EIA trough. Another new discovery is the stratification in southern
mid-latitudes; stratification events in this region are located on a local
plasma peak sandwiched by two lower density strips covering all the
longitudes. The formation mechanism of the stratification for the two
latitudinal regions is discussed, but the stratification mechanism in
southern mid-latitudes remains an unsolved problem.
Highlights. This paper addresses the following:
-
first application of in situ plasma densities for the direct analysis of the stratification in F2 layer,
-
refined features of the exact location and continuous morphology for the stratification phenomenon,
-
a new discovery of stratification covering all longitudes in southern mid-latitudes.
- Article
(1859 KB) - Companion paper
- BibTeX
- EndNote


Stratification is a kind of phenomenon appearing in the ionospheric F2 layer at low latitudes near the geomagnetic equator, where an additional layer is shown above the F2 layer peak due to the combined effect of the upward E×B drift at the geomagnetic equator and the meridional neutral wind (Balan et al., 1997, 1998; Jenkins et al., 1997). This additional layer was called the G layer and renamed the F3 layer by Balan et al. (1997) due to it having the same chemistry as the F region.
Since stratification was first reported in the mid-20th century (Sen, 1949; Skinner et al., 1954), many studies have been conducted to study the formation mechanism and diurnal, seasonal, and solar-activity dependence of this phenomenon using different measurements, such as ground-based ionospheric sounding ionograms (Balan et al., 1997; Batista et al., 2002; Jenkins et al., 1997; Zhao et al., 2011a), ground-based TEC (total electron content; Thampi et al., 2005), satellite-based ionospheric sounding ionograms (Depuev and Pulinets, 2001; Karpachev et al., 2013; Lockwood and Nelms, 1964), satellite-based radio occultation (RO) observations (Zhao et al., 2011b), and satellite-based in situ measurements (Wang et al., 2019). All these studies have shown that stratification above the F2 peak is a regular rather than an anomalous phenomenon appearing both during the day and at night and is limited to a narrow zone near the geomagnetic equator regions, and the occurrence of this stratification phenomenon depends on the season, solar activity, and geomagnetic activity (Balan et al., 2008; Batista et al., 2002; Jenkins et al., 1997; Zhao et al., 2011a).
The features and formation mechanism of the ionospheric F2 layer stratification have been extensively investigated for several decades, but unsolved problems, such as the exact locations and distribution morphology that are useful to understand this phenomenon, still exist due to the scattered and limited spatial coverage of the observations used in previous studies. So far, most of these studies are based on ground-based or satellite-based ionograms. For the former, stratification can only be observed during the period when the peak density of the stratification layer exceeds that of the F2 layer; for the latter, it can only be observed during the period when the peak density of the stratification layer is lower than the F2 peak. Continuous global distribution of the stratification cannot be obtained from these scattered observations, though local season and solar-activity dependence features can be obtained from these long-term observations. Moreover, there are contradictory results in these studies. In contrast, simultaneous satellite-based in situ observations at different altitudes above the F2 layer peak can provide spatial coverage of more extensive regions, which can incorporate all local times and longitudes. Most importantly, the morphology of the stratification along the latitudinal direction can be obtained using the continuous measurements.
In this paper, for the first time, the in situ plasma measurements from the Swarm satellites are used to study the precise locations, distribution, and morphology of the stratification phenomenon. Nighttime stratification on the southern mid-latitudes is found, which is never mentioned in previous studies. Our results can provide a new perspective for the stratification phenomenon, which is helpful for insight into the ionospheric F2 layer.
Swarm, launched on 22 November 2013 by the European Space Agency (ESA), is a constellation mission comprising three identical satellites (A, B, and C). The three satellites are placed in two different polar orbits, two flying side by side (A and C), at an altitude of about 460 km with a longitudinal separation of about 1.4∘, and a third (B) at an altitude of about 510 km (Knudsen et al., 2017). Consistent in situ plasma densities are measured by the Langmuir probes (LP) aboard the three Swarm satellites with a time resolution of 2 Hz (Lomidze et al., 2018).
The three satellites began to separate in altitudes at the end of January 2014, and the separation operations were completed in April 2014, as shown in Fig. 1. During and immediately after the separation operations, the three satellites orbit at similar local times and similar locations in different altitudes above the F2 peak region, which provides a good opportunity to check and understand the distribution and morphology of the F2 layer stratification phenomenon using simultaneous in situ measurements obtained at a global scale.
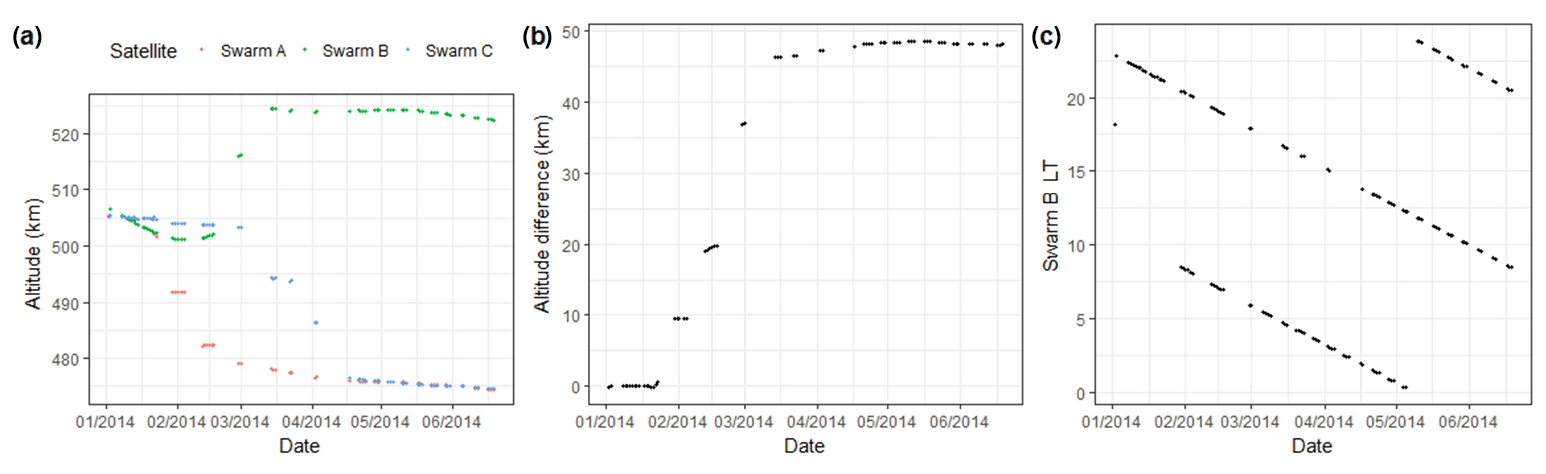
Figure 1Variations in orbiting parameters with time. (a) Variations in orbiting altitude of the three satellites with time, (b) variations in altitude difference between Swarm B and A with time, and (c) variations in Swarm B LT with time. The orbiting altitude, altitude difference, and Swarm B (LT) in (a), (b), and (c) indicate the daily average values near the geographical Equator.
Separation of the three satellites follows different schemes, as shown in Fig. 1a. To simplify the calculation, we use only the measurements from Swarm A and B, as the two satellites are closer to each other, and they have more co-located orbit tracks after altitude separation. Therefore, co-located in situ plasma density measurements from Swarm A and B are selected using the criteria defined below to conduct this study.
We also give the solar and geomagnetic activity indices during the select period, as shown in Fig. 2. According to Fig. 2a and b, the solar activity during the selected period is medium. Since there are few geomagnetic events as shown in Fig. 2c, we will not distinguish the data into disturbed and undisturbed cases here. Therefore, all the selected co-located orbit pairs are used in this study.
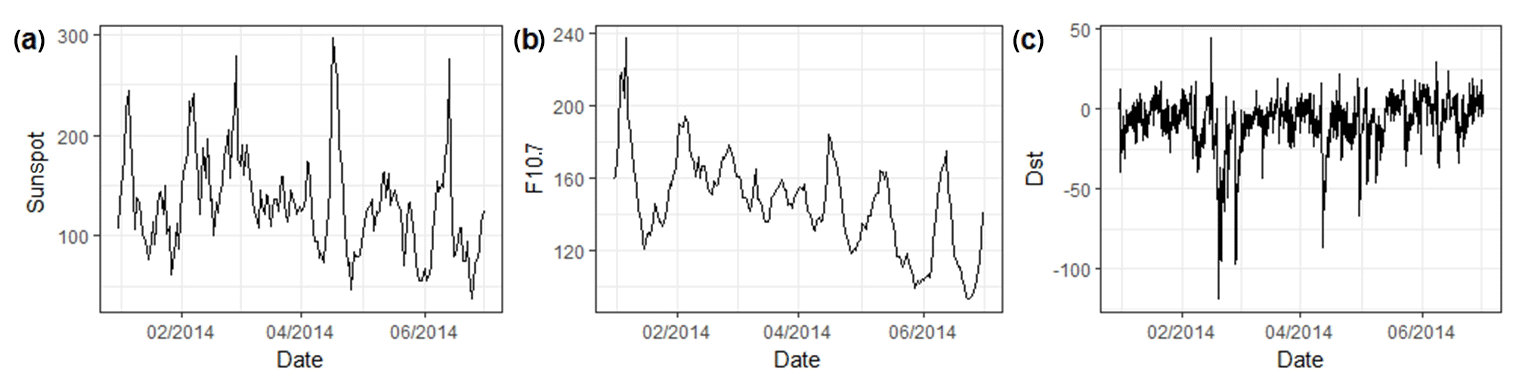
Figure 2Variations in solar and geomagnetic indices with time. (a) Variations in sunspot index with time. (b) Variation in F10.7 index with time. (c) Variation in Dst index with time.
To detect stratification events, measurements of the co-located orbit pairs from the two satellites are compared directly. Spatial and temporal criteria to search co-located orbit tracks are defined as follows: (1) the longitude difference between two orbit tracks near the equator region is within 5∘, which can hold true for nearly all the mid-latitudes, as the orbit tracks of the Swarm satellites are almost parallel to the longitude for mid-latitudes and low latitudes. This 5∘ spatial difference in the longitude direction is reasonable because of the little and negligible variation in the ionosphere at a small spatial scale. According to Shim et al. (2008), the longitudinal correlation can vary from 23∘ at mid-latitudes and 15∘ at low latitudes during the day to 11∘ at mid-latitudes and 10∘ at low latitudes during the night, and (2) the time difference of measurements at similar latitudes between two orbits is less than 30 min, as the appearance of stratification is normally much longer than this criterion (Balan et al., 1997). Moreover, variations in electron densities within 30 min can be neglected compared to the diurnal variation under geomagnetically quiet conditions.
In a search of the dataset from Swarm A to B using the criteria, 1313 matched orbit pairs are found from January to June 2014. Here, matched orbits indicate ascending (from south to north) or descending (from north to south) half-orbit tracks, as a satellite passes the same location twice a day, corresponding to daytime and nighttime, respectively, as shown in Fig. 1c, which gives the local time (LT) of Swarm B for both ascending and descending orbit during the selected data period.
Using these co-located orbit pairs, stratification events are identified by the following process. (1) In situ plasma density measurements along the orbit tracks are down sampled by averaging the data over the 1∘ latitude range. (2) The down-sampled data at same latitude from the two satellites are compared; then data points, where average plasma density from Swarm B is greater than that from Swarm A, are picked out. (3) Stratification events are identified only when at least five continual data difference (Swarm B minus Swarm A) points are positive, which means a continual latitude of at least 5∘. A continual 5∘ latitude is adopted because the auto-detecting process may make the wrong decisions if fewer data points are considered due to the small data fluctuations of the observations. Some very small stratification may be discarded in this way, but it will not affect the final results. After all the stratification events are determined, the morphology along the latitude, the location, and the global distribution of the stratification events are then studied based on the detected events.
The global distribution of the detected stratification events from all the co-located orbit pairs from January to June 2014 is given in Fig. 3; also given in this figure are the variations in the occurrence number with the local time and month. As more than one event may be detected from one orbit track, Fig. 3a plots all the detected stratification events, but only one event is counted per orbit track in Fig. 3b and c when comparing the statistical results. The location of each stratification event is identified as the place where the maximum data difference is located, and the color of each point represents the occurrence month of that event.
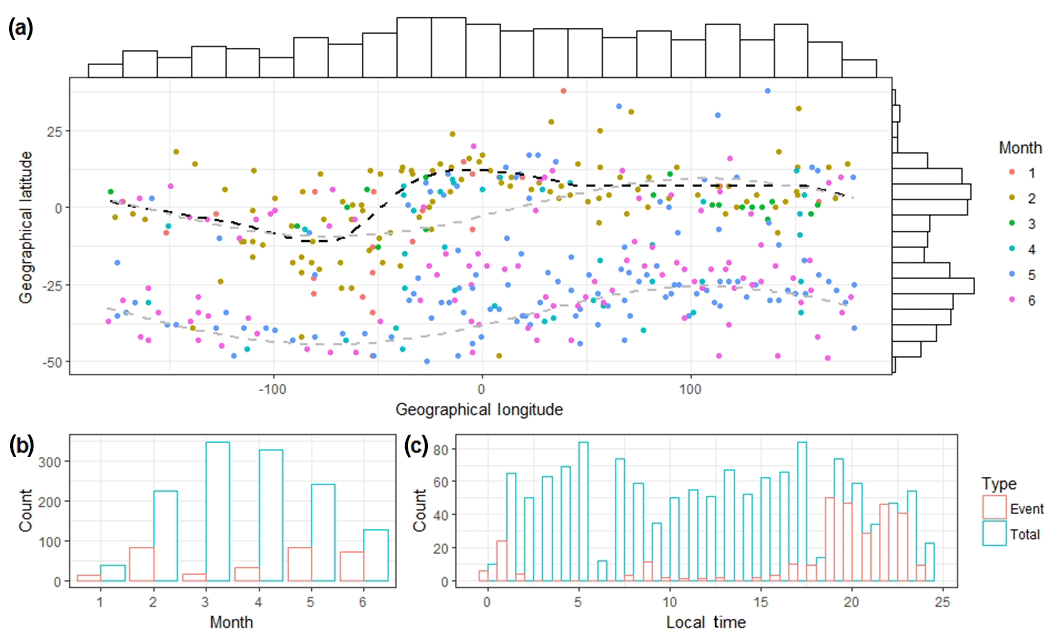
Figure 3Distribution of detected stratification events and variations in occurrence number with local time and month. In (a), each point represents a stratification event, and the location of each point indicates the position of the maximum data difference of that detected event. Color of each point indicates the occurrence month of the stratification event. Grey dashed line indicates the geomagnetic equator and 35∘ S geomagnetic latitude under dipole coordinates, and black dashed line indicates dip equator. In (b) and (c), “Event” indicates detected stratification events, and “Total” indicates total co-located orbit number.
As shown in Fig. 3c, most of the detected stratification events are mainly concentrated during 18:00 to 01:00 LT, with 18:00 to 23:00 LT being the most clustered period. In contrast, there are fewer daytime stratification events, which is quite different from the studies in which stratification is concentrated during the period from morning to noon (Balan et al., 1998; Batista et al., 2002). As for the seasonal variations in Fig. 3b, the most frequent occurrence of the stratification is in January, February, May, and June when compared to the total number of co-located orbit pairs. The lower event number in January is because the altitude separation began at the end of this month. Its occurrence rate (detected events divided by total) is comparable to that in February, May, and June. As for the very small event number in March and April, it is necessary to point out that the local time of the two satellites coincides to dawn and dusk during these 2 months, as shown in Fig. 1c, which may be the reason why there are fewer detected events during this period. Fewer stratification events during March and April is consistent with fewer events during the day, which we will discuss in Sect. 4.
It can be seen clearly from Fig. 3a that stratification events are concentrated on two geomagnetic latitudes; one is the geomagnetic equator region, on which most previous studies are concentrated, and the other is the mid-latitude region in the Southern Hemisphere, where the distribution of the stratification events also shows the feature of being parallel to the geomagnetic equator. It should be noted here that the geomagnetic equator and latitude shown by grey dashed line in Fig. 3a are from dipole coordinates, and the dip equator shown by the black dashed line is also given as a comparison. Geomagnetic control of the stratification events in the southern mid-latitudes is obviously shown according to its distribution feature. In Fig. 3a, stratification events near the geomagnetic equator can occur in each month from January to June, whereas stratification on the southern mid-latitudes only occurs in May and June, just the local winter.
As for the longitudinal distribution, stratification events can cover all longitudes, generally showing a slightly denser distribution in the Eastern Hemisphere than in the Western Hemisphere, which may be related to the limited statistical data. The all-longitude coverage feature is consistent with the results from Zhao et al. (2011b). A longitudinal peak is shown between longitudes (−50, 0) in Fig. 3a, though it is not very obvious. This longitude peak coincides with the region where the dip equator, the black dashed line in Fig. 3a, transits from the south to the north of the geographical Equator. This region is also the place where the ground-based sounding observations are used by many previous studies (Balan et al., 1998; Batista et al., 2002; Jenkins et al., 1997; Zhao et al., 2011a).
To demonstrate the latitudinal distribution morphology, stratification events obtained from continual orbit tracks observed in 1 d, and different days are given in Figs. 4 and 5. In both figures, red and blue represent data from Swarm A and Swarm B, respectively. Stratification events are located on the places where measurements from Swarm B are greater than those from Swarm A, namely on places where blue curves are above red ones. Also given in Fig. 4b are the ground tracks of the two satellites, which can be used to locate the longitude of the stratification events.
As shown in Figs. 4a and 5a, morphology of the nighttime stratification events, located near the geomagnetic equator, shows that the stratification is centered at the equator ionization anomaly (EIA) trough, near where the geomagnetic equator is located for most event cases, and extends towards the EIA crests in both hemispheres. Occurrence of the nighttime phenomenon can be accompanied by or without plasma depletion, as shown in Figs. 4a and 5a. Stratification can be seen clearly from the satellite measurements even if there are plasma bubbles, whereas it cannot be easily identified from ground-based ionograms under this disturbed situation. The latitudinal distribution of this phenomenon indicates that most of the nighttime stratification can cover all the regions between the two EIA crests, which is quite different from the locations of daytime stratification, where the occurrence position is near, but not the geomagnetic equator (Balan et al., 1998; Bastita et al., 2002).
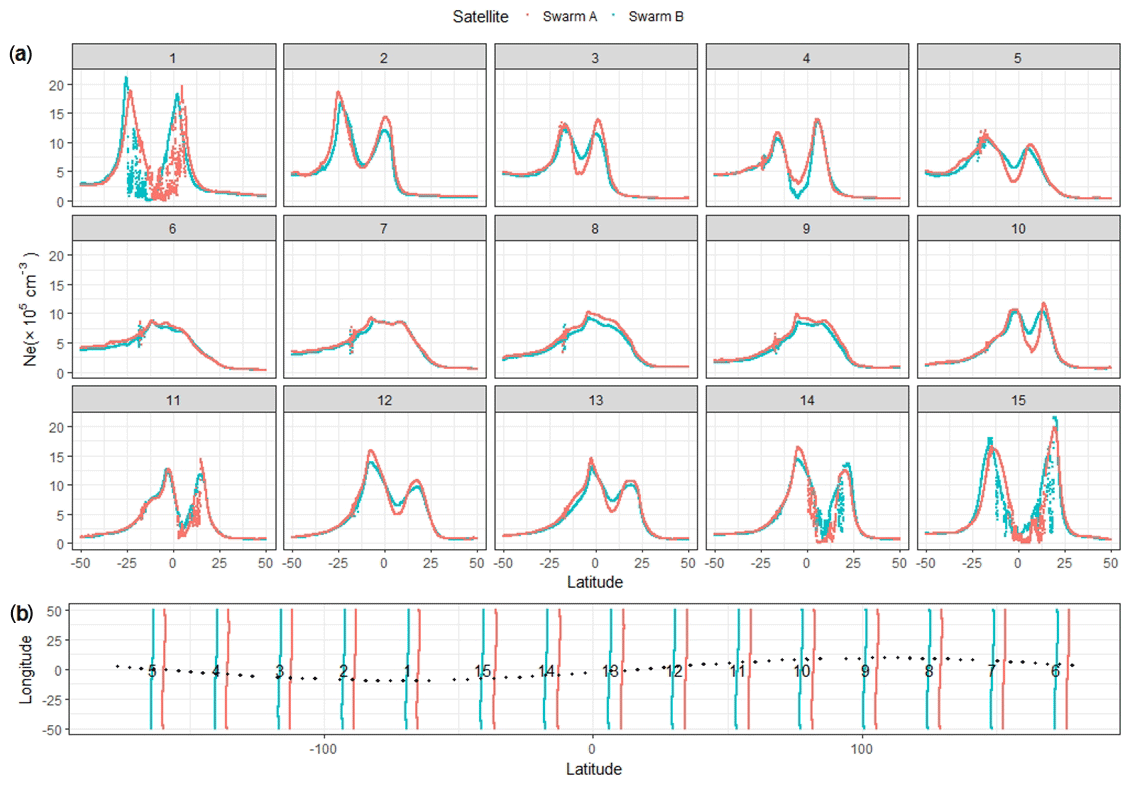
Figure 4Morphology of nighttime stratification examples from continual orbit tracks. (a) Morphology of nighttime stratification from continual orbits on 3 February 2014. (b) Ground tracks corresponding to the continual orbit in (a). The dotted line in (b) indicates the geomagnetic equator from dipole coordinate, and numbers on the line correspond to the numbers shown in (a).
We also give some examples in Fig. 5b to show the typical morphology for daytime stratification. These latitudinal distribution morphologies demonstrate clearly the results, reported by many ground-based studies, in which daytime stratification can appear on one side (frame 1 and 2 in Fig. 5b) or both sides (frame 4 in Fig. 5b) of the EIA crests. We also show an example of the daytime stratification centered at the EIA trough (frame 3 in Fig. 5b), which is seldom observed from ground-based ionograms. An interesting point in daytime data is that there is a small spike centered at the EIA trough occasionally, as shown by frame 4 in Fig. 5b, which is never seen in nighttime measurements and needs further confirmation. As there are only a few daytime stratification events, no statistical results can be obtained from these data. We only focus on nighttime stratification in this study.
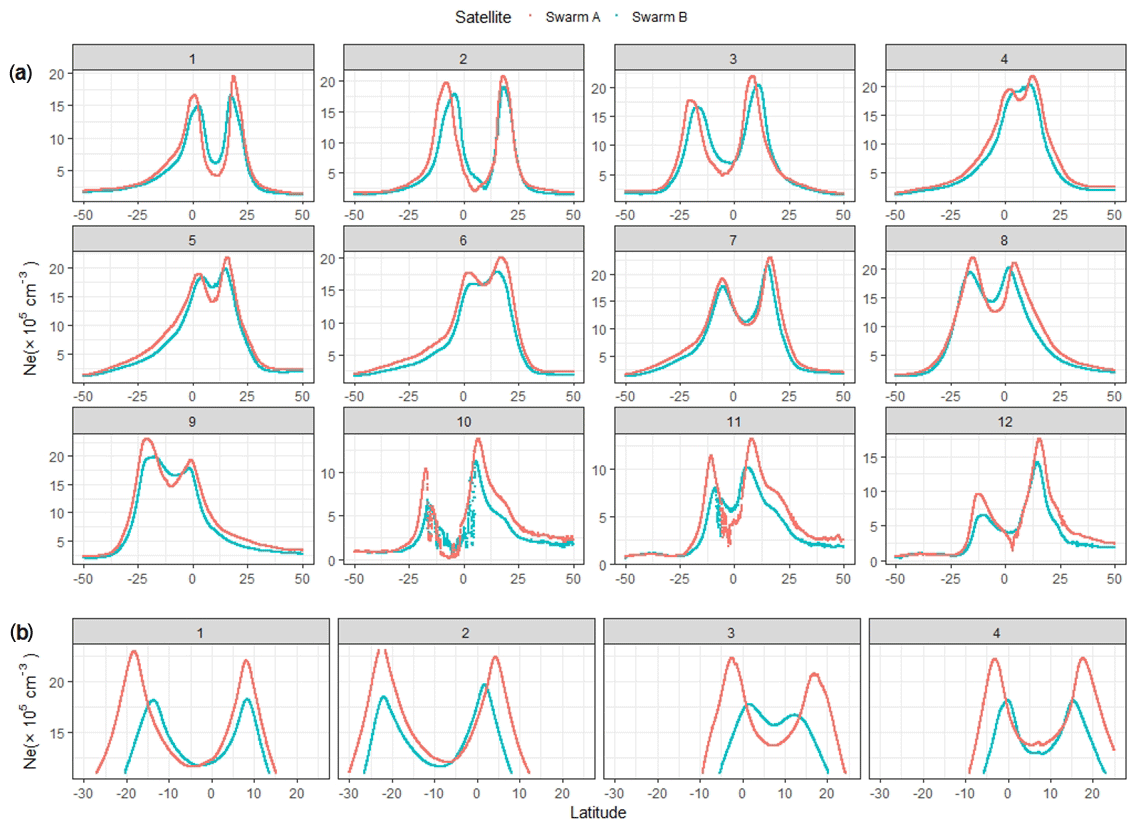
Figure 5Morphology of stratification examples from different LTs. (a) Morphology of nighttime stratification from different LTs: panels (1)–(3) are from 12 February 2014 at 19:20 LT, panels (4)–(9) are from 28 February 2014 at 17:50 LT, and panels (10)–(12) are from 12 June 2014 at 21:00 LT. (b) Typical morphology of daytime stratification: panels (1)–(2) are from 22 April 2014 at 13:40 LT, panel (3) is from 22 March 2014 at 16:00 LT, and panel (4) is from 20 March 2014 at about 16:20 LT.
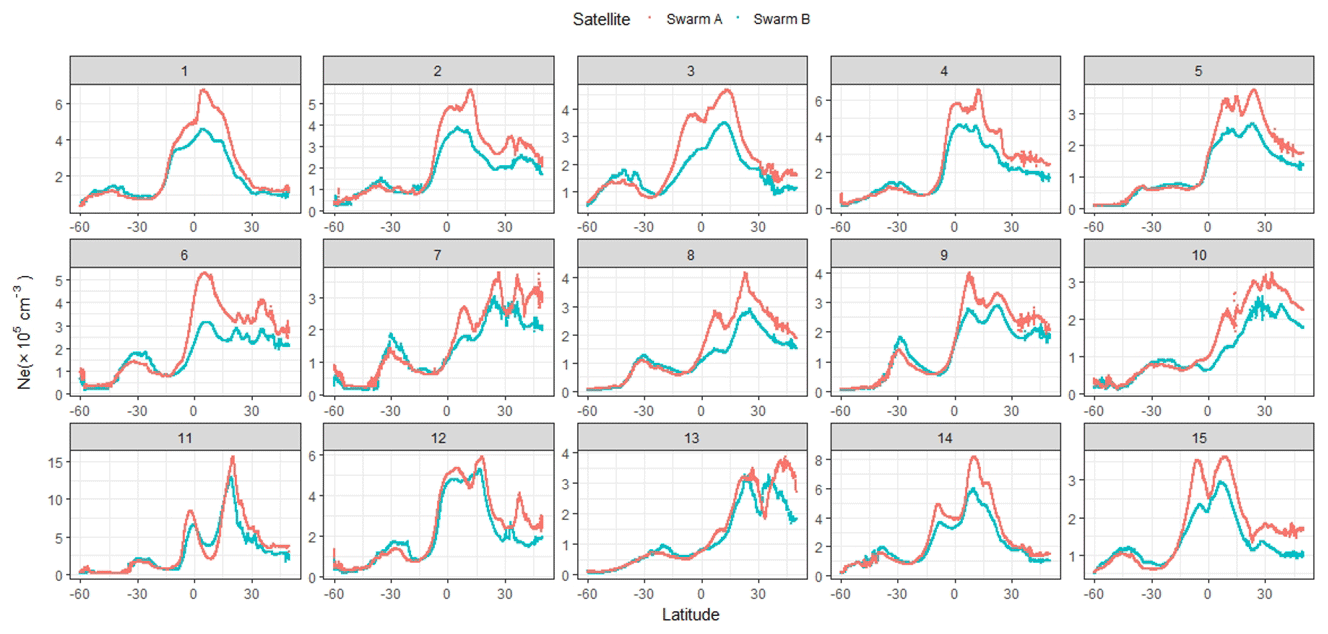
There is another southern mid-latitude region on which the detected stratification events are concentrated and which can cover all the longitudes, as shown in Fig. 3a. The stratification phenomenon in this region is never mentioned in previous studies. All the detected stratification events in this region occur at local nighttime in May and June, as mentioned above. Typical stratification events in this region are located on the local plasma peak along latitudinal direction, which is sandwiched by two lower density strips, as shown in Fig. 6. Stratification events in this region can occur simultaneously with those located near the geomagnetic equator region, as indicated by frame 11 and 12 in Fig. 6. The morphology and locations of the stratification events in southern mid-latitudes are quite different from those in geomagnetic equator region, which may imply the different formation mechanism for the two situations.
To get the peak height range of the ionospheric F2 layer during the selected data period, a statistical analysis is performed using the radio occultation (RO) measurements from the COSMIC mission. Of all the 16 753 RO events located between ±20∘ geographical latitude, only 994 events have peak heights greater than 450 km, including those with a false peak height caused by disturbed data, which indicates that the normal F2 peak height is lower than 450 km at the equatorial region. A small number of RO events, located along the geomagnetic equator with a higher peak height, show the morphology of two peaks on the profiles, which may imply the stratification phenomenon. Therefore, we can determine that the orbiting altitudes of the Swarm satellites are above the F2 peak height for most cases, and the stratification events, appearing at the orbiting altitudes, can be detected by the in situ plasma density measurements from the Swarm satellites.
The continuous morphology of the stratification and its global distribution obtained in this paper give us a more intuitive image of the stratification phenomenon and are very useful in understanding this phenomenon. But some problems require further analysis.
Stratification events detected in this study are mainly concentrated during the nighttime period, which is different from previous studies in which occurrence of stratification is mainly during daytime, especially during the period from morning to noon, when the stratification is most frequently observed from ground-based ionograms (Balan et al., 1998; Jenskin et al., 1997; Batista et al., 2002). As for the reason why there are fewer daytime stratification events for the Swarm measurements, a possible reason is that the altitude of the F2 peak and the stratification (F3 layer) are higher during the day than they are at night. Karpachev et al. (2013) demonstrate that the F3 layer height increases from ∼450 km in the early morning to 600–750 km in the afternoon, and Balan et al. (1997) also suggest that the daytime F3 layer occurs above 550 km, all of which exceed the orbiting altitudes of the Swarm satellites. As a result, only a few daytime stratification events can be observed. This is also the reason why there are only a few events during March and April, as the orbiting LTs of the two satellites are both during the day during these 2 months. In fact, nighttime stratification is suggested to be a permanent phenomenon by studies using satellite-based ionograms (Depuev and Pulinets, 2001; Lockwood and Nelms, 1964; Uemoto et al., 2006); the results obtained from the Swarm satellites in this paper support this suggestion.
Using the measurements of the Swarm satellites, the continuous latitudinal morphology and the exact locations of the stratification events are shown clearly for the first time, which demonstrates that the nighttime stratification can cover all the latitudes continuously between the two EIA crests, with the most significant part being located at the EIA trough. This arch-like distribution morphology is in accord with the studies using satellite-based observations (Depuev and Pulinets, 2001; Lockwood and Nelms, 1964; Wang et al., 2019). Depuev and Pulinets (2001) suggest that the intensity of the stratification has a maximum just above the equator and decreases poleward within ±10∘ dip; Lockwood and Nelms (1964) also report that the field-aligned ledge is concentrated above the geomagnetic equator, producing a dome-like cross section in the equatorial region. Wang et al. (2019) also suggest an arch-like distribution of the nighttime stratification. This feature is quite different from the daytime stratification, which is more probable at low latitudes around the equator rather than at the equator itself (Balan et al., 1998; Batista et al., 2002; Zhao et al., 2011b), and this location feature is demonstrated clearly by the typical daytime morphology in Fig. 5b. In contrast, the morphology of most nighttime stratification suggests that the most significant part is located at the EIA trough rather than at low latitudes on both sides. The different features of locations and distribution morphology may suggest a different formation mechanism for nighttime and daytime stratification.
According to the widely accepted suggestion by Balan et al. (1998), daytime stratification (F3 layer) in the equatorial region is formed due to the combined effect of the upward E×B drift and neutral wind; the upward plasma drift causes the F2 peak to drift upward and form the F3 layer, while the normal F2 layer develops at lower altitudes through the usual photochemical and dynamical effects. They also suggest that the upward plasma drift due to the pre-reversal enhancement (PRE) cannot form stratification because of the absence of the ionization production after sunset, which is later denied by Zhao et al. (2011a) due to the existence of post-sunset stratification. Their observations show that post-sunset stratification is different from daytime stratification due to the different solar activity and season dependence features, and they suggest that post-sunset stratification is formed due to the PRE upward plasma lifts and the existence of ionization production at the high altitudes of the F2 layer after sunset. However, this formation mechanism cannot explain the midnight–post-midnight stratification shown in this study and mentioned in previous studies (Depuev and Pulinets, 2001; Uemoto et al., 2006); we therefore deduce that nighttime stratification may result from a different formation mechanism. According to some studies (Balan et al., 2008; Paznukhov et al., 2007), the mechanism responsible for the storm-time stratification is similar to that in quiet periods, but with a much faster processing time due to the rapid uplift of the F layer by an upward E×B drift resulting from an eastward-penetration electric field. We therefore speculate that the upward plasma drift caused by the PRE will produce the same effects as that of the magnetic disturbances. As a result, plasma can be lifted up quickly by the PRE from lower altitudes to higher altitudes, which can lead to the higher densities at higher altitudes and plasma depletion and plasma bubbles at lower altitudes. After the PRE, the downward vertical drift resulting from the reversal electric field will replenish the depleted region by carrying the plasma from higher altitudes to lower altitudes; as a result stratification can be formed during the downward carrying process at the EIA trough. At the same time, the field-aligned diffusion of the uplifted plasma can maintain the EIA structure on both sides of the geomagnetic equator and form stratification at low latitudes. This way, the nighttime stratification morphology, centering at the EIA trough and extending towards the two EIA crests as shown in Figs. 4a and 5a, can be formed. The EIA structure, which accompanies all the cases of stratification near the geomagnetic equator, is supposed to be the necessary condition to form the stratification in this region. The existence of nighttime EIAs is common during geomagnetically quiet conditions, and reappearance of EIA is triggered by the occasionally reversed upward vertical plasma drift, as nighttime vertical velocities are normally directed downwards (Yizengaw et al., 2009). In addition, the nighttime downward vertical velocities are greater after midnight than before midnight, both during magnetically quiet and perturbed times (Rajaram, 1977). Combining these results, we can explain the formation process of the nighttime stratification at and near the geomagnetic equator and why most of the nighttime stratification events are concentrated between the post-sunset-to-midnight period, as shown in Fig. 3c. In addition, according to Balan et al. (2000), variations in daytime stratification arise from variations in the vertical plasma drift velocities due to the F region zonal electric field. Similarly, the variations in the nighttime stratification may be related to the variations in the PRE amplitude, variations in the upward and downward vertical velocities, and variations in the frequency of the EIA reappearance.
The new discovery in this study is the stratification on the southern mid-latitudes, which has never been mentioned in previous studies. Wang et al. (2019) propose that small stratification may exist on southern mid-latitudes when comparing the in situ electron densities observed at different altitudes by the same payload aboard the DEMETER satellite, but a definite conclusion cannot be given, as the data are not observed simultaneously. The results in this paper further confirm their proposal. However, we also note that the season and solar activity of the data used in their study are different from that in this study. Whether stratification on southern mid-latitudes can occur in all seasons or only in summer (Wang et al., 2019) or winter (in this study), both their studies and ours cannot give a definite answer due to the limited data coverage, which requires further studies when enough data are obtained. Zhao et al. (2011b) note that there are a few cases of stratification that are far away from the geomagnetic equator in their global stratification distribution obtained from COSMIC RO data; they attribute this to the result of the propagation of atmospheric gravity waves (AGWs), often observed in mid-latitudes. We do not think that their cases are similar to ours, as their cases are distributed randomly in both hemispheres. As no literature can be referenced on the stratification located in the southern mid-latitudes, a brief discussion on its possible formation mechanism is given here.
As shown in Fig. 6, stratification events in this region are located on the local plasma peak, and it seems that the more obvious the local peak is, the more obvious the stratification is. Plasma enhancement in southern mid-latitudes is noted by Tsurutani et al. (2004). They call the local peak “shoulder”, and this shoulder can be found from TOPEX, SAC-C, and CHAMP datasets as well as ground GPS data. Yizengaw et al. (2009) also report TEC enhancement in southern mid-latitudes and attribute it to the meridional thermospheric wind that drives the F layer plasma upward, as this is the region where the wind-induced uplift is most efficient. The morphology of the daytime shoulder is similar to the nighttime TEC enhancement and local peak in this study. As this local peak can exist both during the day and at night as well as under geomagnetically disturbed and quiet conditions, we suppose that it is a normal phenomenon on southern mid-latitudes. Another interesting feature from the study of Tsurutani et al. (2004) is that the shoulder occurs only in the Southern Hemisphere, similar to the feature in which mid-latitudes stratification occurs only in the Southern Hemisphere. We speculate that the stratification in southern mid-latitudes is closely related to the local peak structure according to their common feature. Tsurutani et al. (2004) suppose that the shoulder is likely the signature of the plasmapause, which can be used as a downward plasma source to form the stratification in the mid-latitudes, but this cannot explain why this phenomenon does not appear in northern mid-latitudes.
Abdu et al. (2005) suggest that the precipitation of low-energy (<10 keV) electrons in the SAA (South Atlantic Anomaly), namely the source of ion production, together with the ionization loss process, might be a mechanism for the F2 layer stratification at mid-latitudes, but the locations of their stratification are on the southern EIA crest, quite different from the locations in this study. Moreover, the precipitation mechanism cannot explain why the stratification can cover all the longitudes.
According to Lin et al. (2005), large (storm time) upward E×B drifts can lift the ionospheric layer to higher altitudes and therefore can expand the EIA peaks to higher latitudes. However, the proposal, transporting equatorial plasma to higher geomagnetic latitudes by the super fountain effect, still cannot satisfactorily explain the stratification in southern mid-latitudes. One reason for this is that field-aligned diffusion of the uplift plasma by the super fountain may lead to the mid-latitude stratification, but it cannot explain the trough between the local peak and the southern EIA crest as shown in Fig. 6; the second reason is that when there is no EIA signature near the geomagnetic equator, and as a result of having no super fountain effect, there are still many stratification cases in this region; and the third reason is that this mechanism cannot explain the absence of stratification in northern mid-latitudes either. As no existing research results can satisfactorily explain the formation mechanism of the stratification in southern mid-latitudes, we leave it as an open question here, and subsequent studies are anticipated.
Stratification above the F2 peak is investigated in this paper using the continuous in situ plasma densities observed simultaneously by the Swarm satellites orbiting at different altitudes. Some refined features and new discoveries on the F2 layer stratification are summarized as follows:
-
This is the first time that the stratification phenomenon is investigated using direct in situ plasma density measurements.
-
Most of the detected stratification events occur after sunset and cluster between about 18:00 and 23:00 LT.
-
The continuous morphology of the nighttime stratification events, located near geomagnetic equator, shows that it centers at the EIA trough and extends towards both sides but is sandwiched between the two EIA crests. This distribution feature is quite different from the daytime stratification, which is located near but not at the equator.
-
A new discovery is found in which some detected nighttime stratification events are concentrated near mid-geomagnetic latitudes in the Southern Hemisphere along all the longitudes, and the stratification in this region is found to be located on the local plasma peak. Further studies are expected on its formation mechanism.
The plasma density data (LP) of the Swarm satellites can be downloaded from https://earth.esa.int/ (ESA, 2020), and COSMIC Radio Occultation data used can be downloaded from https://cdaac-www.cosmic.ucar.edu/ (CDAAC, 2020). The Dst data were downloaded from http://wdc.kugi.kyoto-u.ac.jp (Data Analysis Center for Geomagnetism and Space Magnetism, 2020), and the F10.7 and sunspot data were downloaded from ftp://ftp.ngdc.noaa.gov (NOAA, 2020).
XW arranged this study, including experiment design and data analysis. WC and ZZ collected the Swarm data used in this paper. DY, JC, and FG did some calculation work.
The authors declare that they have no conflict of interest.
This work was supported by the National Key R&D Program of China (grant no. 2018YFC1503505).
This research has been supported by the National Key R&D Program of China (grant no. 2018YFC1503505).
This paper was edited by Ana G. Elias and reviewed by Inez Batista and one anonymous referee.
Abdu, M. A., Batista, I. S., Carrasco, A. J., and Brum, C. G. M.: South Atlantic magnetic anomaly ionization: A review and a new focus on electrodynamic effects in the equatorial ionosphere, J. Atmos. Sol.-Terr. Phy., 67, 1643–1657, https://doi.org/10.1016/j.jastp.2005.01.014, 2005.
Balan, N., Bailey, G. J., Abdu, M. A., Oyama, K. I., Richards, P. G., MacDougall, J., and Batista, I. S.: Equatorial plasma fountain and its effects over three locations: Evidence for an additional layer, the F3 layer, J. Geophys. Res.-Space, 102, 2047–2056, https://doi.org/10.1029/95ja02639, 1997.
Balan, N., Batista, I. S., Abdu, M. A., MacDougall, J., and Bailey, G. J.: Physical mechanism and statistics of occurrence of an additional layer in the equatorial ionosphere, J. Geophys. Res.-Space, 103, 29169–29181, https://doi.org/10.1029/98ja02823, 1998.
Balan, N., Batista, I. S., Abdu, M. A., Bailey, G. J., Watanabe, S., MacDougall, J., and Sobral, J. H. A.: Variability of an additional layer in the equatorial ionosphere over Fortaleza, J. Geophys. Res.-Space, 105, 10603–10613, https://doi.org/10.1029/1999ja000020, 2000.
Balan, N., Thampi, S. V., Lynn, K., Otsuka, Y., Alleyne, H., Watanabe, S., Abdu, M. A., and Fejer, B. G.: F3 layer during penetration electric field, J. Geophys. Res.-Space, 113, A00A07, https://doi.org/10.1029/2008ja013206, 2008.
Batista, I., Abdu, M. A., MacDougall, J., and Souza, J.: Long term trends in the frequency of occurrence of the F3 layer over Fortaleza, Brazil, J. Atmos. Sol.-Terr. Phy., 64, 1409–1412, https://doi.org/10.1016/s1364-6826(02)00104-9, 2002.
CDAAC: COSMIC Data Analysis and Archive Center, available at: https://cdaac-www.cosmic.ucar.edu/, last access: 26 March 2020.
Data Analysis Center for Geomagnetism and Space Magnetism: World Data Center for Geomagnetism, Kyoto, available at: http://wdc.kugi.kyoto-u.ac.jp, last access: 26 March 2020.
Depuev, V. H. and Pulinets, S. A.: Intercosmos-19 observations of an additional topside ionization layer: the F3 layer, Adv. Space Res., 27, 1289–1292, https://doi.org/10.1016/s0273-1177(01)00205-8, 2001.
ESA: Earth Online, available at: https://earth.esa.int/, last access: 26 March 2020.
Jenkins, B., Bailey, G. J., Abdu, M. A., Batista, I. S., and Balan, N.: Observations and model calculations of an additional layer in the topside ionosphere above Fortaleza, Brazil, Ann. Geophys., 15, 753–759, https://doi.org/10.1007/s00585-997-0753-3, 1997.
Karpachev, A. T., Klimenko, M. V., Klimenko, V. V., and Kuleshova, V. P.: Statistical study of the F3 layer characteristics retrieved from Intercosmos-19 satellite data, J. Atmos. Sol.-Terr. Phy., 103, 121–128, https://doi.org/10.1016/j.jastp.2013.01.010, 2013.
Knudsen, D. J., Burchill, J. K., Buchert, S. C., Eriksson, A. I., Gill, R., Wahlund, J.-E., Ahlen, L., Smith, M., and Moffat, B.: Thermal ion imagers and Langmuir probes in the Swarm electric field instruments, J. Geophys. Res.-Space, 122, 2655–2673, https://doi.org/10.1002/2016ja022571, 2017.
Lin, C. H., Richmond, A. D., Heelis, R. A., Bailey, G. J., Lu, G., Liu, J. Y., Yeh, H. C., and Su, S.-Y.: Theoretical study of the low- and midlatitude ionospheric electron density enhancement during the October 2003 superstorm: Relative importance of the neutral wind and the electric field, J. Geophys. Res., 110, A12312, https://doi.org/10.1029/2005ja011304, 2005.
Lockwood, G. E. K. and Nelms, G. L.: Topside sounder observations of the equatorial anomaly in the 75∘ W longitude zone, J. Atmos. Terr. Phys., 26, 569–580, https://doi.org/10.1016/0021-9169(64)90188-6, 1964.
Lomidze, L., Knudsen, D. J., Burchill, J., Kouznetsov, A., and Buchert, S. C.: Calibration and Validation of Swarm Plasma Densities and Electron Temperatures Using Ground-Based Radars and Satellite Radio Occultation Measurements, Radio Sci., 53, 15–36, https://doi.org/10.1002/2017rs006415, 2018.
NOAA: F10.7 and sunspot data, available at: ftp://ftp.ngdc.noaa.gov, last access: 26 March 2020.
Paznukhov, V. V., Reinisch, B. W., Song, P., Huang, X., Bullett, T. W., and Veliz, O.: Formation of an F3 layer in the equatorial ionosphere: A result from strong IMF changes, J. Atmos. Sol.-Terr. Phy., 69, 1292–1304, https://doi.org/10.1016/j.jastp.2006.08.019, 2007.
Rajaram, G.: Structure of the equatorial F-region, topside and bottomside – a review, J. Atmos. Terr. Phys., 39, 1125–1144, https://doi.org/10.1016/0021-9169(77)90021-6, 1977.
Sen, H. Y.: Stratification of the F2-layer of the ionosphere over Singapore, J. Geophys. Res., 54, 363–366, https://doi.org/10.1029/jz054i004p00363, 1949.
Shim, J. S., Scherliess, L., Schunk, R. W., and Thompson, D. C.: Spatial correlations of day-to-day ionospheric total electron content variability obtained from ground-based GPS, J. Geophys. Res.-Space, 113, A09309, https://doi.org/10.1029/2007ja012635, 2008.
Skinner, N. J., Brown, R. A., and Wright, R. W.: Multiple stratification of the F-layer at Ibadan, J. Atmos. Terr. Phys., 5, 92–100, https://doi.org/10.1016/0021-9169(54)90013-6, 1954.
Thampi, S. V., Ravindran, S., Devasia, C. V., Pant, T. K., Sreelatha, P., and Sridharan, R.: First observation of topside ionization ledges using radio beacon measurements from low Earth orbiting satellites, Geophys. Res. Lett., 32, L11104, https://doi.org/10.1029/2005GL022883, 2005.
Tsurutani, B., Mannucci, A., Iijima, B., Abdu, M. A., Sobral, J. H. A., Gonzalez, W., Guarnieri, F., Tsuda, T., Saito, A., Yumoto, K., Fejer, B., Fuller-Rowell, T. J., Kozyra, J., Foster, J. C., Coster, A., and Vasyliunas, V. M.: Global dayside ionospheric uplift and enhancement associated with interplanetary electric fields, J. Geophys. Res., 109, A08302, https://doi.org/10.1029/2003ja010342, 2004.
Uemoto, J., Ono, T., Kumamoto, A., and Iizima, M.: Statistical analysis of the ionization ledge in the equatorial ionosphere observed from topside sounder satellites, J. Atmos. Sol.-Terr. Phy., 68, 1340–1351, https://doi.org/10.1016/j.jastp.2006.05.015, 2006.
Wang, X., Yang, D., Liu, D., and Chu, W.: Identifying a possible stratification phenomenon in ionospheric F2 layer using the data observed by the DEMETER satellite: method and results, Ann. Geophys., 37, 645–655, https://doi.org/10.5194/angeo-37-645-2019, 2019.
Yizengaw, E., Moldwin, M. B., Sahai, Y., and de Jesus, R.: Strong postmidnight equatorial ionospheric anomaly observations during magnetically quiet periods, J. Geophys. Res.-Space, 114, RS6004, https://doi.org/10.1029/2009ja014603, 2009.
Zhao, B., Wan, W., Reinisch, B., Yue, X., Le, H., Liu, J., and Xiong, B.: Features of the F3 layer in the low-latitude ionosphere at sunset, J. Geophys. Res.-Space, 116, A01313, https://doi.org/10.1029/2010ja016111, 2011a.
Zhao, B., Wan, W., Yue, X., Liu, L., Ren, Z., He, M., and Liu, J.: Global characteristics of occurrence of an additional layer in the ionosphere observed by COSMIC/FORMOSAT-3, Geophys. Res. Lett., 38, L02101, https://doi.org/10.1029/2010gl045744, 2011b.