the Creative Commons Attribution 4.0 License.
the Creative Commons Attribution 4.0 License.
 | 07 Apr 2020
The increase in the curvature radius of geomagnetic field lines preceding a classical dipolarization
Based on assumptions that substorm field line dipolarization at geosynchronous altitudes is associated with the arrival of high-velocity magnetotail flow bursts referred to as bursty bulk flows, the following sequence of field line dipolarization is proposed: (1) slow magnetoacoustic wave excited through ballooning instability by enhanced inflows in pre-onset intervals towards the equatorial plane; (2) in the equatorial plane, slow magnetoacoustic wave stretching of the flux tube in dawn–dusk directions resulting in spreading plasmas in dawn–dusk directions and reduction in the radial pressure gradient in the flux tube. As a consequence of these processes, the flux tube assumes a new equilibrium geometry in which the curvature radius of new field lines increased in the meridian plane, suggesting an onset of field line dipolarization. The dipolarization processes associated with changing the curvature radius preceded classical dipolarization caused by a reduction of cross-tail currents and pileup of the magnetic fields.
Increasing the curvature radius induced a convection surge in the equatorial plane as well as inductive westward electric fields of the order of millivolts per meter (mV m−1). Electric fields transmitted to the ionosphere produce an electromotive force in the E layer for generating a field-aligned current system of Bostrom type. This is also equivalent to the creation of an incomplete Cowling channel in the ionospheric E layer by the convection surge.


Substorms are spatially localized and temporarily variable processes in the nighttime magnetosphere. It is often difficult to determine the onset timing of substorm processes such as magnetotail flow burst, field line dipolarization and particle injections. To resolve the timing uncertainties, auroras in global satellite images (Nakamura et al., 2001; Miyashita et al., 2009), intensifications of auroral kilometric radiation (Fairfield et al., 1999; Morioka et al., 2010) and dispersionless particle injection in geosynchronous orbit (Birn et al., 1997) were used. Geomagnetic Pi2 micropulsations observed on the ground are another useful tool for determination of the substorm timing (Sakurai and Saito, 1976; Nagai et al., 1998; Baumjohann et al., 1999). Particularly, Pi2s in the equatorial region exhibited a small phase difference (m<1, m denotes azimuthal wave number) across widely separated stations in the equatorial countries (Kitamura et al., 1988), minimizing the timing uncertainties arising from delays in longitudinal propagations. This enabled an accurate onset timing study of substorms using magnetometer data from two remote locations, geosynchronous altitudes and ground stations of the equatorial countries (Saka et al., 2010).
In this study, the focus is on the dipolarization events in geosynchronous orbit from the growth to the expansion phase. Triggering mechanisms of the field line dipolarization in the vicinity of geosynchronous orbit are our major concern. In this paper, the onset timing study of substorms using magnetometer data from equatorial countries is summarized in Sect. 2. In Sect. 3, a pre-onset scenario leading to the dipolarization onset is presented. In Sect. 4, the excitation of slow magnetoacoustic waves is discussed for triggering field line depolarization. The focus will be on the field line dipolarization in the vicinity of geosynchronous orbit in Sect. 5. A coupling of magnetosphere and ionosphere associated with this dipolarization scenario will be presented in Sect. 6. In Sect. 7, a triggering mechanism of low-latitude Pi2s that enabled the Pi2-based epoch analyses is presented. Summary and discussion of this scenario is given in Sect. 8.
This section comprises a summary of the field line dipolarization occurring at the geosynchronous orbit based on the statistical results obtained by Saka et al. (2010). The authors used magnetometer data from geosynchronous satellites (GOES-5 and GOES-6) and those at ground equatorial stations (Huancayo, Peru, 1.4∘ N in geomagnetic latitudes) in the conjugate meridian. GOES-5 was located at a higher latitude, 10.3∘ N in dipole coordinates, and GOES-6 was closer to the Equator, 7.9∘ N in dipole coordinates. This difference was caused by the separated meridians of the satellites (2.2 h of local time). The dipole coordinates used are equivalent to the HDV coordinates; H is positive northward along the dipole axis, V is radial outward, and D denotes dipole east. The field line dipolarization at the geosynchronous orbit can be characterized either by a step-like or impulsive increase in the inclination angle of the geomagnetic field lines. The inclination angle is measured positive northward from the dipole equator. The step-like dipolarization was observed by GOES-5 located at higher latitudes, while the dipolarization pulse was observed by GOES-6 at latitudes closer to the equatorial plane.
The onset of field line dipolarization preceded the initial peak of the ground Pi2 pulse by 2 min, suggesting that the onset was initiated in association with the first increase in the Pi2 amplitudes. Following the dipolarization onset, field line magnitude decreased at the geosynchronous orbit, and field lines deflected westward in the dawn sector and eastward in the dusk sector (see Fig. 1 for dawn–dusk deflection, reproduced from Saka et al., 2010). This is caused by the dawn–dusk expansion of the plasma flows occurring tailward of the geosynchronous orbit. These longitudinal expansions lasted for about 10 min and decreased the field magnitudes therein. Expansion in the dusk sector, however, continued over this characteristic 10 min interval. Asymmetries of the dawn–dusk expansion may be caused by diamagnetic drifts in the plasma sheet (Liu et al., 2013). It is suggested that classical dipolarization, caused by the reduction of cross-tail currents in the midnight magnetosphere, happened after the nightside magnetosphere experienced this characteristic 10 min interval. For this reason, the first 10 min intervals are referred to as a transitional state of substorm expansion (Saka et al., 2010).
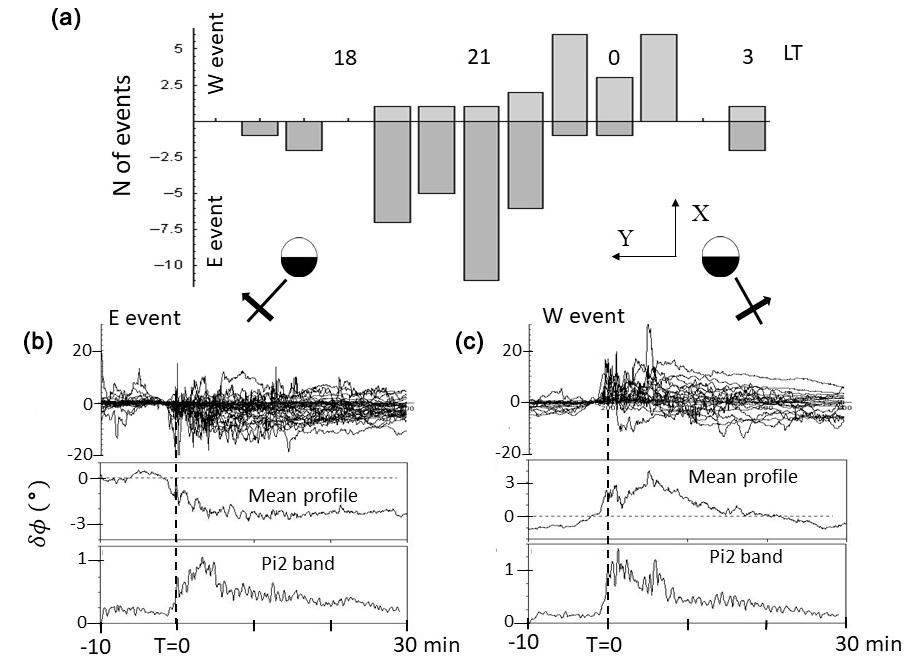
Figure 1(a) Local time distribution of the W event and E event (see below). (b, c) Epoch superposition of field line deflections in degrees for GOES-5 and GOES-6. Those events with eastward deflections (clockwise rotation, azimuth angle decreased) at T=0 shown (b) (E event) and those with westward deflections (counterclockwise rotation, azimuth angle increase) at T=0 are (c) (W event). T=0 marked by vertical dotted lines corresponds to the first peak of the Pi2 waveform. Amplitudes at the onset (T=0) were subtracted from the original data to adjust the pre-onset level. Plots covered 40 min from T−10 to T+30 min. The mean value of the epoch plot and mean value of band-passed (6–20 mHz: Pi2 band) amplitudes are also shown. The field line rotations projected to the equatorial plane are illustrated for the E event and W event in the figure (viewed from north of the equatorial plane).
In the pre-onset intervals, a decrease in the field line inclination started 2 h prior to the dipolarization onset. It attained minimum angles (33.6∘ for GOES-5 and 49.4∘ for GOES-6 in dipole coordinates) right before the dipolarization onset (Saka et al., 2010; Saka, 2019).
One of the properties of plasmas in pre-onset intervals are continuing inflows of lobe plasmas towards the equatorial plane (Birn and Hesse, 1996), Poynting flux enhancement (Machida et al., 2009) and Ey (westward electric fields) penetration toward the equatorial plane (Machida et al., 2014). Corresponding plasma properties at geosynchronous altitudes may be predominant perpendicular temperature anisotropies of thermal plasmas (30 eV–40 keV) obtained from a three-dimensional temperature matrix, and they gradual decrease towards the onset (Birn et al., 1997). At the onset, however, the increase in parallel anisotropy stopped and perpendicular anisotropy increased again. Such changes of temperature anisotropy at onset were observed in a roll-angle spectrogram of energy flux of electrons in 15 eV–40 keV (Saka and Hayashi, 2017). This transition of the temperature anisotropies may be accounted for by the following scenario.
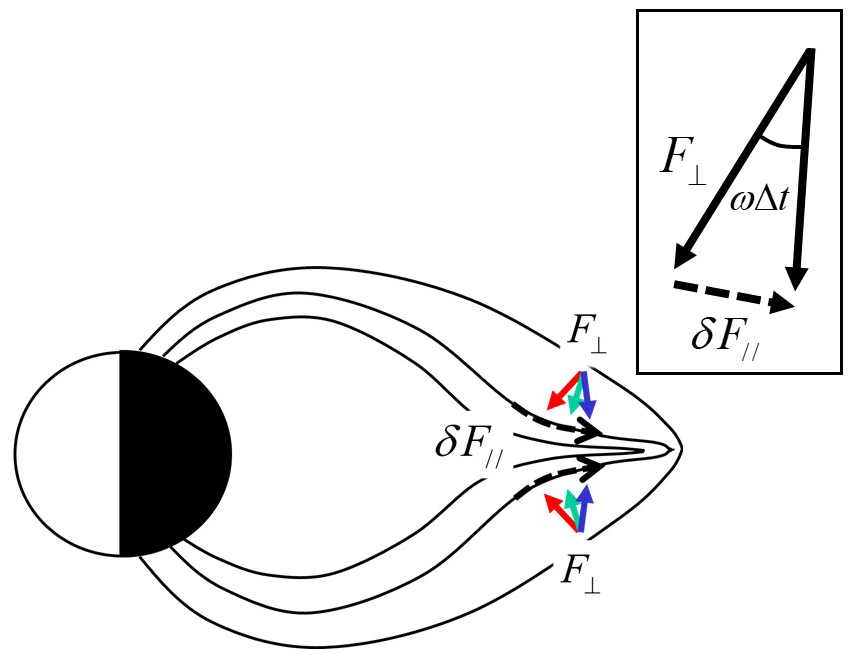
Figure 2The progression of field line thinning in the growth phase is illustrated. The inflow flux (F⊥) rotated counterclockwise in times designated by red, green and blue arrows north of the equatorial plane. South of the equatorial plane, rotation was in a clockwise direction. The rotation of the inflow vectors produced the field-aligned component of the flux, as depicted in the inset with one in the Northern Hemisphere shown. Note that inflows are localized earthward of the outer field lines.
A continuing tailward stretch of the field lines in the pre-onset intervals as depicted in Fig. 2 may increase equatorward flux by the counterclockwise rotation of the inflow vectors (F⊥) in the north of the equatorial plane (clockwise rotation in the south) and produce a parallel component as well by the relation
Here, δF∥ denotes an increase in parallel flux per time, δt, and ω is the angular velocity of the rotation ofF⊥ vectors associated with the thinning of the flux tubes caused by stretching. In pre-onset intervals lasting 90 min at geosynchronous altitudes, field line stretching decreased the field line inclination by 7∘ from 40.6 to 33.6∘ (Saka, 2019). This gives angular velocity of the rotation of the field line inclination in Eq. (1) of rad min−1. Total parallel flux gained in T min may be given by the integral of Eq. (1) with time from 0 to T. Substituting T=60 min and rad min−1 for angular velocity of field line inclination, this yields . The gain of F∥ is about 10 % of the perpendicular flux (F⊥). This is consistent with the parallel temperature anisotropies gained prior to the onset (20 % gain) in geosynchronous orbit (Birn et al., 1997).
Continuing parallel flux flows associated with the flux tube stretching in the pre-onset intervals may increase plasma pressures in the flux tube at its tailward end. This condition leads to further stretching of the flux tube (small curvature radius) (Ohtani and Tamao, 1993; Rubtsov et al., 2018) by the relation
Here, β is plasma to magnetic pressure ratio, and κ and κB denote reciprocal spatial scales of radial inhomogeneity of plasma pressure and magnetic fields in the equatorial plane, respectively. R is the curvature radius of the field lines.
The continuing parallel flows may excite magnetoacoustic waves. From a set of linearized MHD equations there is a relation between parallel displacement along the field lines (ξz) and divergence of perpendicular displacements (ξ⊥) in the following form (see Appendix):
Here, Cs, ω and B0 are the sound velocity, angular frequency of waves and background field magnitudes, respectively. F is given by
F is positive for the slow magnetoacoustic wave and negative for the fast magnetoacoustic wave. CA and k denote Alfvén velocity and wave vector, respectively. Equation (3) is used for the classification of slow and fast magnetoacoustic waves. Slow magnetoacoustic waves yield perpendicular expansion of the flux tubes at the converging point of parallel flows on the equatorial plane. For fast waves, perpendicular shrinkage of flux tubes occurs at the converging point of parallel flows (equatorial plane).
Equation (3) will be applied to simulate a possible effect of magnetoacoustic waves on the pitch angle spectrogram. For this, drift Maxwell distributions for phase space density (PSD) are used, assuming gyrotropy for particle trajectories. PSD was composed of three parts: one drifting parallel, another anti-parallel along the field lines, and the third part perpendicular to the field lines. Figure 3a shows a pitch angle spectrogram of energy flux with no drift velocities either perpendicular or parallel to the background field lines. Energy flux is defined by (2E2∕m2)f, where E, m and f are energy, mass of particles and phase space density, respectively. Energy flux is given in eV (cm2 s sr eV)−1. Only parallel drift increased by 0.3, 0.6 and 1.0 Vth as shown in B, C and D. Vth denotes thermal velocity of the drift Maxwell distribution function. For E and F, perpendicular drift increased to 0.3 and 0.5 Vth while parallel drift remained at 1.0 Vth. Energy fluxes initially in quasi-trapped distribution (A) changed to more parallel and anti-parallel fluxes as parallel and anti-parallel drift increased (B, C and D). Increasing perpendicular drifts increased perpendicular fluxes in the pitch angle distributions of E and F.
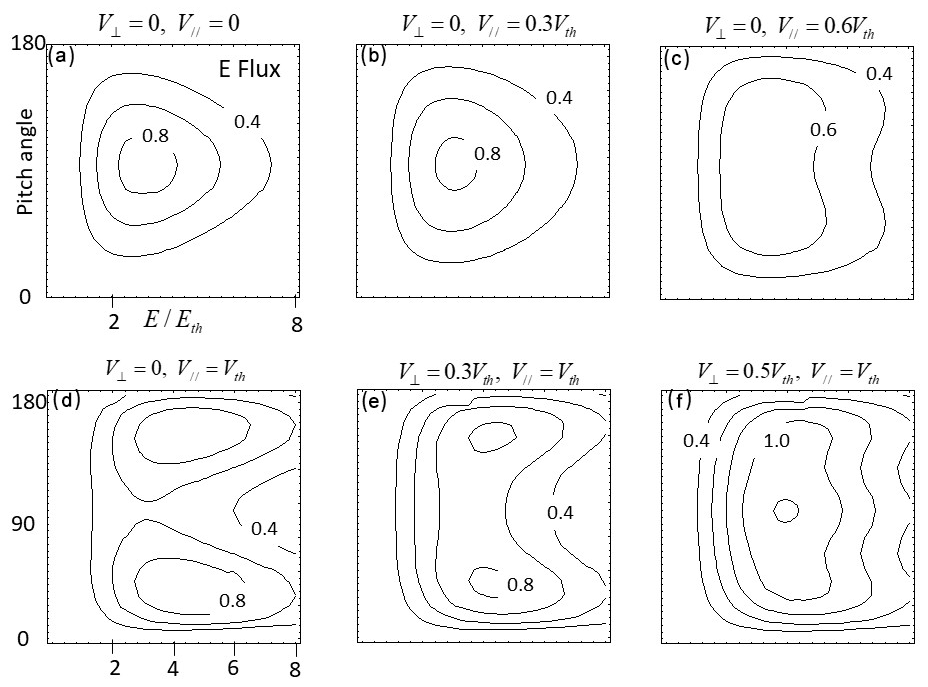
Figure 3Simulated pitch angle spectrogram of energy flux for drift Maxwell distributions of phase space density. Energy flux was shown in contour plots with arbitrary amplitudes. To show how the pitch angle spectrogram evolves, drift velocities in parallel and perpendicular directions with respect to the background magnetic fields have changed. No drifts in both perpendicular and parallel to the background field lines (a). Only parallel drifts increased: 0.3 (b), 0.6 (c) and 1.0 Vth (d). For (e) and (f), perpendicular drift increased to 0.3 and 0.5 Vth while parallel drift remained at 1.0 Vth. Vth denotes thermal velocity. The vertical axis is for pitch angles, while the horizontal axis is for particle energies normalized by the thermal energy.
It was confirmed that magnetoacoustic waves produced coupling of parallel flux along the field lines and the perpendicular flux. However, slow magnetoacoustic waves were chosen for the wave mode because the flux tubes expanded (did not shrink) in the transitional interval as discussed in Sect. 2. Slow magnetoacoustic waves may be triggered through ballooning instability, when a large enough pressure gradient is reached in an earthward direction (Ohtani et al., 1989; Rubtsov et al., 2018).
The ballooning instability threshold κ (reciprocal scale of radial inhomogeneity of plasma pressure) can be estimated using calculation results given in Rubtsov et al.(2018). In a distance from L=5 to 10 Re, instability threshold is given as approximately (κ denotes a reciprocal spatial scale of radial inhomogeneity of plasma pressure, and Re is the Earth radius) for beta defined by the ratio of plasma pressure and magnetic pressure exceeding 0.1. This suggests that the ballooning instability develops at the geosynchronous altitudes (curvature radius R is 2.2 Re) when the spatial scale of the earthward pressure gradient caused by the inflows becomes steeper than 1.0 Re. In the following section it is shown that this theoretical consideration matched observations.
5.1 Relaxation of radial inhomogeneity
The westward electric fields in the dipolarization front (DF) (Runov et al., 2011) embedded in the leading edge of bursty bulk flow (BBF) can be assumed as an external stimulus for triggering ballooning instability. In this case westward electric fields in the DF temporarily amplified the parallel flux flowing towards the end point of the flux tube in the equatorial plane and further steepened the earthward pressure gradient. If the earthward pressure gradient exceeds instability threshold determined by β and initial curvature radius R, slow magnetoacoustic waves can be excited (Rubtsov et al., 2018). Once the slow magnetoacoustic wave was excited, perpendicular fluxes spread the plasmas in dawn–dusk directions and smoothed (or relaxed) the radial gradient of plasma pressures in the equatorial plane (smaller κ). This may result in the transition of the flux tube geometry to a new configuration, an increase in the curvature radius of the field lines (larger R) (see Eq. 2).

Figure 4(a) A multiple-Pi2 event (labeled 1, 2, 3 and 4 in the figure) with positive bays observed at a low-latitude station (KUJ) at L=1.2 in the midnight sector (23:42 MLT at 15:00 UT). The figure, showing data from 14:30 to 16:00 UT 31 August 1986, was reproduced from Saka et al. (2002). (b) The inclination angle of field lines in dipole coordinates along the satellite trajectories measured by AMPTE CCE spacecraft. Inclination angle (θ) was defined as . H is positive northward parallel to the dipole axis, V is radial outward, and D is dipole east. Vertical arrows denote dipolarization onset corresponding to the multiple Pi2s: 1, 2, 3 and 4 in (a). (c) Difference of duskward flux (counts per sample) (J−) and dawnward flux (J+) for 63–85 keV ion channel measured by AMPTE CCE spacecraft. (d) Same as for (c) but for the 125–210 keV ion channel. Radial distance (R) in Re, MLaT in degrees, and MLT at 14:30, 15:00 and 16:00 UT along satellite trajectory are shown in the bottom.
Multiple Pi2 events were observed by AMPTE CCE on 31 August 1986 (Saka et al., 2002) and an example can be seen of relaxation of radial inhomogeneity of plasma pressures associated with field line dipolarization in Fig. 4. The satellite passed the midnight sector (20:00–23:00 MLT) from 3 to 7 Re at latitudes south of the equatorial plane ( MLat) when multiple Pi2 events (with positive bays) were observed at a low-latitude station (KUJ) at L=1.2 in the midnight sector (Fig. 4a). The inclination angle of field lines along the satellite trajectory is shown in Fig. 4b. Dipolarization occurred as marked by vertical arrows correlating to multiple onsets of Pi2s, 1 through 4 in Fig. 4a. Ion fluxes coming from the dawn sector (J−) and from the dusk sector (J+) at satellite altitudes were measured by the instruments (two energy channels, 63–85 keV and 125–210 keV) on board AMPTE CCE (Takahashi et al., 1996). A schematic of particle measurement is shown at the top of Fig. 5. The flux difference () increased in association with the onset of multiple Pi2s (15:05 UT) and positive bays at KUJ (Fig. 4c and d). The sudden increase was followed by the slow decrease in flux in the 63–85 keV channel and rapid decrease in flux in the 125–210 keV channel. The flux difference, , may be caused either by an earthward pressure gradient or westward convection of plasmas. The different patterns of the flux decrease with time in two energy channels, suggesting that the measured flux difference, , can be attributed to an increase in the earthward pressure gradient and subsequent relaxation. Note that the guiding center of is earthward or tailward of the satellite position as depicted in the top of Fig. 5. The different relaxation speed in two energy channels, slower for 63–85 keV and faster for 125–210 keV, suggest that the earthward pressure gradient (assumed to be proportional to the flux gradient) decreased with time during the multiple-Pi2 event (Fig. 5). The flux difference (50 counts per sample) was 10 % of the background flux both for 63–85 keV (Larmor radius is 250 km for 150 nT) and for 125–210 keV (Larmor radius is 450 km); that is, the flux level differed by 10 % at two locations 1000 km apart in radial distance for 63–85 keV and 1800 km for 125–210 keV. This gives an e-folding scale of the earthward pressure gradient being 0.98 and 1.77 Re for 63–85 keV and 125–210 keV, respectively. The 31 August event shows that the radial pressure gradient was relaxed in the inner magnetosphere in association with the increase in the field line inclination (dipolarization). Although the field line dipolarization showed a sharp onset in satellite magnetometer data, it was noted that it did not occur in ion flux data. This may be true because the ion flux change at the onset may be obscured by the contamination from the past onsets transported across the field lines from the adjoining sector by the electric fields and gradient or curvature drifts. The conclusion is that the relaxation of spatial inhomogeneity started when the spatial scale of the radial inhomogeneity approached 1.0 Re, consistent with the theoretical consideration of ballooning instability by Rubtsov et al. (2018).
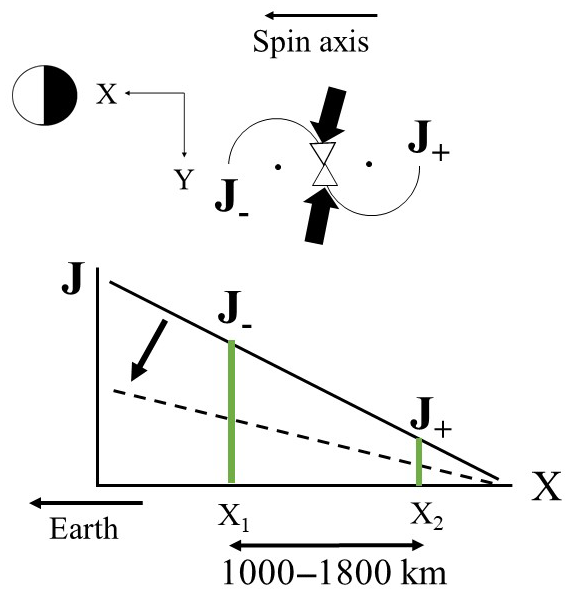
Figure 5A schematic illustration of particle measurement in the x–y plane of GSE coordinates; x is earthward, and y is duskward in the ecliptic plane. For the time interval of a multiple-Pi2 event when the satellite was at 22:00 MLT, duskward flux represented by (J−) came from the earthward sector and dawnward flux (J+) from the tailward sector. because of the pressure gradient positive earthward. The spatial gradient is represented by a solid line changing to a dotted line. Radial separation, x1−x2, is either 1000 km or 1800 km for 63–85 keV ions or 125–210 keV ions, respectively.
5.2 Flux tube transition to a new geometry
Meanwhile, field lines in the further earthward locations may be compressed by the inward movement of the outer field lines. This process, associated with the dipolarization onset, may increase the parameter κB in Eq. (2), which may result in transition to a new geometry of earthward field lines, a decrease in the curvature radius R. Transition of the field line geometries for onset locations and ones in earthward locations are schematically illustrated in Fig. 6. These field line geometries in the meridian plane matched the third harmonic and fundamental harmonic deformations of outer and inner field lines, respectively. This is often observed in the midnight magnetosphere in the initial pulse of Pi2s (Saka et al., 2012). Transitions of the flux tube geometry in the magnetosphere also correspond to the production of negative bays in higher latitudes and positive bays in lower latitudes. If it can be assumed that negative bays switched to positive bays at certain latitudes, for example 60∘ in geomagnetic coordinates, this latitude can be mapped beyond the geosynchronous orbit (L∼7 Re or further tailward) as field line dipolarization occurs along the stretched flux tubes. Consequently, this scenario requires that the BBFs are not necessary to reach the inner magnetosphere to trigger the substorm onset at lower latitudes. In the inset, flux tube deformations are illustrated in the equatorial cross section at onset locations (field lines 1 and 2). Divergence of perpendicular flows (solid arrows) produced dawn–dusk expansion of flux tubes (2) and the shrinkage of stretched flux tubes (1) by relaxation of the radial inhomogeneity. Flux tube deformation from 1 to 2 tended to preserve the total magnetic fluxes in the equatorial cross section. From the local time distribution of the dawn–dusk expansion of the flux tubes shown in Fig. 1, most of the flux tube transition such as from 1 to 2 may occur tailward of geosynchronous orbit. Some of the events, however, may happen earthward of the geosynchronous orbit (i.e., Ohtani et al., 2018).
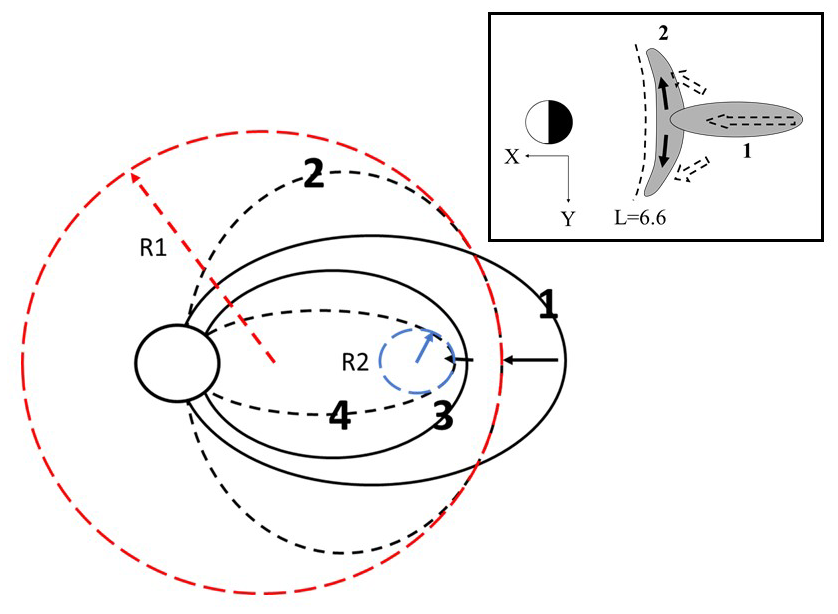
Figure 6A schematic illustration of the field line deformations in the meridian plane associated with the changing curvature radius of the field lines. The outer field lines marked by (1) changed to field lines (2) by increasing their curvature radius to R1 (red dashed circle) in association with the relaxation of radial inhomogeneity, while the inner field lines marked by (3) moved to field lines (4) of smaller curvature radius R2 (blue dashed circle). This transition, (3) to (4), may be caused by the radial gradient of magnetic pressures becoming steeper in association with the inward compression of the field lines (see text). In the inset, flux tube deformations in the equatorial cross section are illustrated at onset locations (field lines 1 and 2). Divergence of perpendicular flows in dawn–dusk directions (solid arrows) produced a dawn–dusk expansion of flux tubes (2) which coincide with the shrinkage of stretched flux tubes (1). Flux tube deformation from (1) to (2) tended to preserve the total magnetic fluxes in the equatorial cross section.
An increase in the curvature radius, or earthward shrinkage of the flux tubes, produces a reduction of the radial component of the field lines (V in dipole coordinates) by adding positive V in the north of the equatorial plane and negative V in the south. If amplitudes of the V component changed by 10 nT in 1 min, the expected inductive electric fields (westward) could be of the order of 1.0 mV m−1 when shrinkage was confined within 1 Re from the equatorial plane. The dawn–dusk expansion of the flux tubes may also produce inductive electric fields (earthward and tailward in dawn and dusk sector, respectively) of the same order of magnitude. They are Alfvén waves, a wave mode in ballooning instability coupled with slow magnetoacoustic wave (Rubtsov et al., 2018). The westward electric fields produce earthward flow bursts referred to as convection surge. The inductive electric fields produced by the dipolarization are of the same order of magnitude observed in DF (Runov et al., 2011).
The inductive electric fields may be transmitted along the field lines as poloidally and toroidally polarized Alfvén waves (Klimushkin et al., 2004). These electric fields produce a dynamic ionosphere in the polar region that includes nonlinear evolution of ionospheric plasmas (poleward expansion), as well as production of field-aligned currents and parallel potentials by exciting ion acoustic waves under quasi-neutral conditions (Saka, 2019). It is not the aim of this paper to describe in detail the dynamic processes in the ionosphere, but to show a local production of currents in the ionosphere as well as field-aligned currents by the penetrated electric fields. For this purpose, the 10 August 1994 substorm event studied by Saka and Hayashi (2017) was revisited. In this event, eastward expansion was observed in the field line dipolarization region, which started at 11:55 UT (00:27 MLT) from 260∘ E geomagnetic longitude and expanded to 351∘ E in about 48 min. At the leading edge of the expansion, ground magnetometer data showed bipolar event (quick change of the D component from positive to negative in about 5 min), being confined in the expanding dipolarization front as a substructure. The substructure in the leading edge of the field line dipolarization will be examined as follows.
It can be assumed that magnetic signals on the ground are associated with the sum of the horizontal Hall currents in the ionosphere (Fukushima, 1971). These currents can be calculated by the relation
The ground vertical component (b) was used as a proxy of Bz in the ionosphere. The second derivative on the right-hand side of Eq. (5) is approximated as
Here, i denotes ith station in the meridian chain. Li is the geomagnetic latitude of the ith station. Only meridional change was considered. This is because the vertical component changed from negative to positive across the meridian, while in longitudes it simply decreased or increased in lower and higher latitudes after onset, respectively. Hence, longitudinal variations may contribute less to the Laplacian. The results reproduced from Saka and Hayashi (2017) are shown in Fig. 7a. The eastward propagation of the dipolarization front crossed this meridian (300∘ E) at 12:13 UT, corresponding to the interval labeled 1. Two points arose from this figure: (1) the loop of the Hall current pair existed, and counterclockwise rotation (CCW) can be viewed from above the ionosphere in the lower latitudes and clockwise rotation (CW) in the higher latitudes; (2) these current patterns expand poleward. Current patterns in the interval from 1 to 5 in Fig. 7a are illustrated in Fig. 7b to facilitate the poleward expansion. It is clearly demonstrated that current pair forming CW in higher latitudes and CCW in lower latitudes expanded in time towards the pole. Bipolar change can be seen in the D component data (not shown) when the ground station, FSIM in this case, passes from segment 1 to 2 in Fig. 7b. As a result, the dipolarization front expanded eastward progressively by producing the poleward expansion at each meridian. The front left behind the current pattern comprising upward field-aligned currents in lower latitudes and downward in higher latitudes, or Bostrom-type current system. It is proposed that the ionosphere itself has inherent electromotive force to drive this Bostrom-type current system. The reasons are as follows.
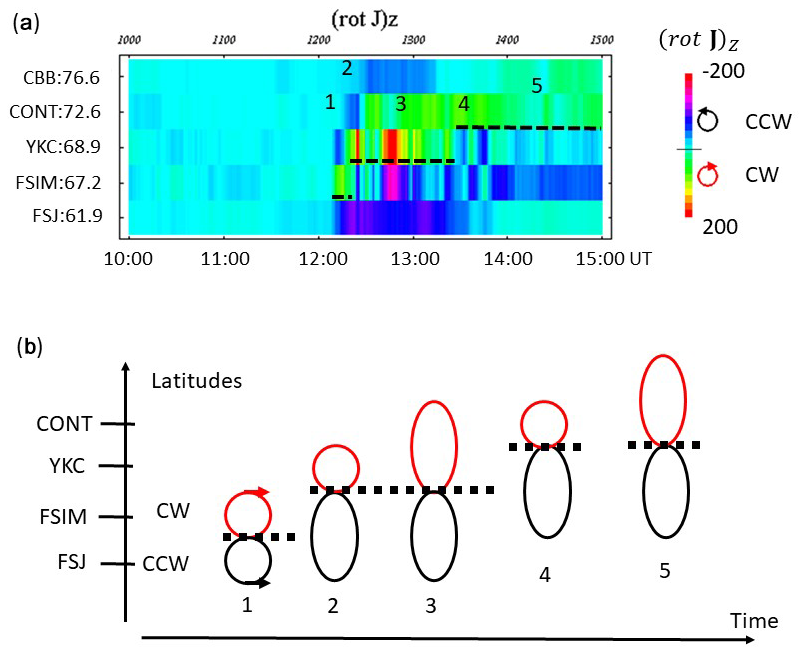
Figure 7(a) Vertical component of (rotJ)Z in the meridian chain along 300∘ E for the interval from 10:00 to 15:00 UT, reproduced from Saka and Hayashi (2017). Dipolarization onset was at 12:13 UT at this meridian. For the calculation of (rotJ)Z, vertical component data from RES (83.0∘ N, 299.7∘ E), CBB (76.6∘ N, 301.2∘ E), CONT (72.6∘ N, 298.3∘ E), YKC (68.9∘ N, 298.0∘ E), FSIM (67.2∘ N, 290.8∘ E), FSJ (61.9∘ N, 295.5∘ E) and VIC (54.1∘ N, 296.7∘ E) along the magnetic meridian 300∘ E were used (see text): positive for the clockwise rotation (CW) of ionospheric currents and negative for the counterclockwise rotation (CCW) viewed from above the ionosphere. Amplitudes are color-coded. The scale is shown on the right. Demarcation lines separating CCW and CW in latitudes are marked by a dashed line. The demarcation line moved to poleward after the onset. Note that negative (rotJ)Z in the poleward edge indicates a smooth decrease in the Z amplitudes. (b) Time progressions of the CW and CCW patterns are illustrated separately in five segments from 1 to 5, marked in Fig. 7a. The figure demonstrates a progression of the CW–CCW pair in time, CW in the poleward and CCW in the equatorward. This pair developed its size after onset, showing poleward expansion. The meridional current associated with this pair of loop currents, if closed in the equatorial plane via the field-aligned currents, comprised the Bostrom-type current system.
In the E region, drift trajectories may be written (Kelley, 1989) for electrons by
and for ions by
Here, bi is the mobility of ions defined as Ωi∕(Bνin), and κi is defined as Ωi∕νin. Symbols Ωi and νin are ion gyrofrequency and ion-neutral collision frequency, respectively. denotes a unit vector of the magnetic fields B. It was assumed that E×B drifts for electrons and ions were driven by westward electric fields transmitted from the convection surge. Because of the very low mobility of ions in the E layer (κi=0.1), electric field drifts accumulate electrons (not ions) in lower latitudes and produce stronger secondary southward electric fields in the ionosphere. The southward electric fields produced southward motion of ions due to the first term of Eq. (8). They carry Pedersen currents (ion currents) for producing quasi-neutrality of ionosphere. EW×B drifts caused by the transmitted westward electric fields (EW) may propel electrons against southward electric fields from higher latitudes to lower latitudes as electromotive force to maintain the potential drop for driving Pedersen currents. This means the ionospheric E layer contains both generator and load in it. Under quasi-neutral conditions, a small imbalance of particle densities of electrons and ions () may induce in lower latitudes a negative potential region of the order of −100 kV with horizontal scale length of 100 km. To sustain this negative potential, upward field-aligned currents of the order of 1.0µA m−2 for ΣP∼100 S must flow. Downward field-aligned currents from the positive potential regions in the higher latitudes may also be expected. It is supposed that upward field-aligned currents may be carried mostly by ions flowing outwards, and downward currents are escaping electrons to the magnetosphere. Those ions and electrons escape from the ionosphere into the magnetosphere to assure quasi-neutral conditions of the ionosphere. The above scenario may be adapted to a creation of the incomplete Cowling channel (Baumjohann, 1983), where unbalanced primary northward Hall currents and secondary southward Pedersen currents driven by the polarization electric fields yielded field-aligned currents.
From ground magnetometer observations in the auroral zone, it is natural to assume that flux tubes linked to negative bays (decreasing of the H component) and positive bays (increasing of the H component) at higher and lower latitudes, respectively, oscillated coherently at Pi2 periods. Oscillating flux tubes associated with positive bays may produce local compression of magnetic fields at the Equator and trigger cavity mode at low latitudes (Takahashi et al., 1995). Oscillations, however, are short-lived and may not establish true cavity modes. They excite cavity/waveguide modes in the plasmasphere (Allan et al., 1996; Li et al., 1998).
At the dip equator, a singular latitude of the cavity/waveguide mode, only the isotropic mode can be excited (Allan et al., 1996). This leads to the supposition that a very large propagation velocity (or large wavelength exceeding the whole circle of the Earth) of equatorial Pi2s in the nightside sector (Kitamura et al., 1988) would be associated with the dawn–dusk asymmetries of non-propagating compressions.
Pi2 periodicity may be determined primarily by the consecutive arrival of BBF substructures referred to as a dipolarization front bundle (DFB) (Liu et al., 2013, 2014). Repeating arrival of DFB produces periodic dipolarization or oscillation of negative bays. Positive bay oscillations in the plasmasphere would follow the negative bay oscillations to excite cavity/waveguide modes for low to equatorial Pi2s at the same periodicities. To estimate the onset time of the field line dipolarization using the very low-latitude Pi2s, delays in transmission are from the magnetosphere; longitudinal delays across the meridian may not be significant.
High-latitude Pi2s may not be caused by cavity/waveguide modes but by the oscillation of field-aligned currents comprising a Bostrom-type current system (incomplete Cowling channel), R1 (region 1) type current system associated with convection surge (i.e., Birn and Hesse, 1996) and R2 (region 2) type current system of expanding flux tubes in longitudes (i.e., Tanaka et al., 2010). In contrast to the very low-latitude Pi2s associated with the non-propagating compression, the high-latitude Pi2s propagated on the ground typically at 20 km s−1 eastward and westward in the sectors east and west of the substorm center, respectively (Samson and Harrold, 1985). Propagation across the meridian may cause further delays: 35 s for propagation of 1 h of local time. Caution should be exercised when using high-latitude Pi2s for the timing study.
The above scenario assumes that the DFBs arrived periodically in the inner magnetosphere at a frequency not very different than the cavity frequency of the plasmasphere.
The definition of field line dipolarization is a configuration change from stretching to shrinkage of geomagnetic field lines in the midnight meridian of the magnetosphere. Two models have been proposed to account for the configuration change; diversion of the cross-tail currents via the ionosphere, referred to as a substorm current wedge (SCW), as first proposed in McPherron et al. (1973), and extinction of the cross-tail currents by a local kinetic instability, current disruption (CD) (Lui, 1996). These models have been adopted for many decades to account for the critical issues associated with substorm onset. It is proposed, based on the ballooning instability scenario, that field line dipolarization is caused by the relaxation of the radial inhomogeneity of plasma pressures in association with the excitation of slow magnetoacoustic waves. Dipolarization regions expand in longitudes and decrease field magnitudes by expanding flux tubes therein. This condition continued for about 10 min, and classical dipolarization caused by the reduction of cross-tail currents or pileup of the magnetic flux transported from the tail begins.
It is noted that BBFs with low-entropy plasmas (plasma bubbles) often penetrated the inner magnetosphere (Dubyagin et al., 2011). In numerical simulations, those bubbles localized in local time produced global dipolarization in the inner magnetosphere (Merkin et al., 2019) and generated an ionospheric current system such as the westward electrojet, Harang discontinuity and poleward expansion of aurora in the substorm expansion phase (Yang et al., 2012). These classical features of substorm expansion occurred in the first 10 min of intervals of the Pi2 onset, referred to as transitional intervals in the midnight magnetosphere. The transitional intervals may be the most active periods in the substorm phase.
The proposed scenario was deduced from the geosynchronous observation and cannot be readily applied to the onset scenario beyond the geosynchronous orbit. Nevertheless, dawn–dusk expansion of the flux tubes may be a fundamental property of field line dipolarization not only at geosynchronous altitudes but also in tailward locations (8–12 Re) (Yao et al., 2013; Liu et al., 2013). It is suggested that the field line dipolarization at tailward locations is subdivided by the faster expanding (in longitudes) dipolarization front (DF) and slower expanding dipolarization front bundle (DFB) led by DF (Liu et al., 2015). Such substructures in field line dipolarization are also observed at geosynchronous altitudes (Saka and Hayashi, 2017). The geosynchronous dipolarization expanded (in longitudes) at 1.9 km s−1, while Pi2s emitted in the dipolarization region propagated one order of magnitude faster. The fast longitudinal velocities associated with Pi2s may be embedded within the slowly expanding region of dipolarization, similarly to the relationship between DF and DFB. If this relationship can also be adapted to the transitional state and subsequent field line pileup, the dipolarization scenario in geosynchronous observations can be extended further tailward upstream. Or, the onset scenario in 10 Re can be applied in geosynchronous dipolarization. In that case, the dipolarization pulse at GOES-6 latitude (7.9∘ N) may represent DFs. This assumption may be supported because electron energy flux pitch angle distributions in tailward locations beyond 10 Re appear parallel to perpendicular transitions, like those in Fig. 3, at the arrival of the DF (Deng et al., 2010).
It should be emphasized that two different types of the dipolarization exist in the substorms; one is associated with the change of curvature radius of field lines in the transitional state (faster expansion in longitudes) and the other is subsequent pileup of the magnetic flux transported from the tail (slower expansion). Field line pileup caused by the flow braking processes (Shiokawa et al., 1997) may lead to tailward regression of the dipolarization region as reported in Baumjohann et al. (1999).
In the transitional state lasting for about 10 min, the inductive electric fields pointing westward were produced in the equatorial plane. They propagated along the field lines to the ionosphere to produce meridional field-aligned currents of the Bostrom type (downward in higher latitudes and upward in lower latitudes). The Bostrom-type current system was indeed observed on the ground at the front of dipolarization expanding towards the east. The magnetospheric dynamo produced by earthward electric fields in the equatorial plane (Akasofu, 2003) and the E layer dynamo in the ionosphere worked together to activate the Bostrom current system.
In order to derive Eqs. (3) and (4), Kadomtsev (1979) was followed. Linearized MHD equations may be written as
Here, CS, CA and ξ denote sound velocity, Alfvén velocity and plasma displacement, respectively. The term () denotes perpendicular and parallel components with respect to the background field lines.
After a few manipulations of Eq. (A1), magnetoacoustic wave equations for finite β plasmas were obtained:
and
Equations (A2) and (A3) present compressive properties across and along the background field lines, respectively.
Assuming plane harmonic wave solutions, first-order quantities of density and magnetic field compressions (δN, δB) may be given by the following equation.
Here, N0 and B0 denote background density and magnetic fields, respectively.
Substitution of Eq. (A4) into Eq. (A3) using yields
Here,
A linearized Faraday's law under frozen-in conditions, , may be reduced to
Substituting Eq. (A6) into Eq. (A5), final expressions relating parallel and perpendicular displacements were obtained:
Replacing with −iω, Eq. (A7) yields Eq. (3) in Sect. 4,
Satellite data from GOES-5 and GOES-6, AMPTE CCE and ground magnetometer data in Figs. 1, 4 and 7 are available upon request to Osuke Saka (saka.o@nifty.com).
The author declares that he has no conflict of interest.
The author would like to express his sincere thanks to all the members of Global Aurora Dynamics Campaign (GADC) (Oguti et al., 1988). He is also grateful to Zhonghua Yao and the anonymous referees for their critical review.
This paper was edited by Elias Roussos and reviewed by Zhonghua Yao and two anonymous referees.
Akasofu, S.-I.: Source of auroral electrons and the magnetospheric substorm current system, J. Geophys. Res., 108, 8006, https://doi.org/10.1029/2002JA009547, 2003.
Allan, W., Menk, F. W., Fraser, B. J., Li, Y., and White, S. P.: Are low-latitude Pi2 pulsations cavity/waveguide mode?, Geophys. Res. Lett., 23, 765–768, 1996.
Baumjohann, W.: Ionospheric and field-aligned current systems in the auroral zone: A concise review, Adv. Space Res., 2, 55–62, 1983.
Baumjohann, W., Hesse, M., Kokubun, S., Mukai, T., Nagai, T., and Petrukovich, A. A.: Substorm dipolarization and recovery, J. Geophys. Res., 104, 24995–25000, 1999.
Birn, J. and Hesse, M.: Details of current disruption and diversion in simulations of magnetotail dynamics, J. Geophys. Res., 101, 15345–15358, 1996.
Birn, J., Thomsen, M. F., Borovsky, J. E., Reeves, G. D., McComas, D. J., and Belian, R. D.: Characteristic plasma properties during dispersionless substorm injections at geosynchronous orbit, J. Geophys. Res., 102, 2309–2324, 1997.
Deng, X, Ashour-Abdalla, M., Zhou, M., Walker, R., El-Alaoui, M., Angelopoulos, V., Ergun, R. E., and Schriver, D.: Wave and particle characteristics of earthward electron injections associated with dipolarization fronts, J. Geophys. Res., 115, A09225, https://doi.org/10.1029/2009JA015107, 2010.
Dubyagin, S., Sergeev, V., Apatenkov, S., Angelopoulos, V., Runov, A., Nakamura, R., Baumjohann, W., McFadden, J., and Larson, D.: Can flow bursts penetrate into the inner magnetosphere?, Geophys. Res. Lett., 38, L08102, https://doi.org/10.1029/2011GL047016, 2011.
Fairfield, D. H., Mukai, T., Brittnacher, M., Reeves, G. D., Kokubun, S., Parks, G. K., Nagai, T., Mtsumoto, H., Hashimoto, K., Gurnett, D. A., and Yamamoto, T.: Earthward flow bursts in the inner magnetotail and their relation to auroral brightenings, AKR intensifications, geosynchronous particle injections and magnetic activity, J. Geophys. Res., 104, 355–370, 1999.
Fukushima, N.: Electric current systems for polar substorms and their magnetic effect below and above the ionosphere, Radio Sci., 6, 269–275, 1971.
Kadomtsev, B. B.: Collective phenomena in plasmas (in Japanese), Iwanami shoten, Tokyo, 1979 (English edition published in 1982 is available from Pergamon Press).
Kelley, M. C.: The earth's ionosphere: plasma physics and electrodynamics, Academic Press, Inc, 34–41, 1989.
Kitamura, T., Saka, O., Shimoizumu, M., Tachihara, H., Oguti, T., Araki, T., Sato, N., Ishitsuka, M., Veliz, O., and Nyobe, J. B.: Global mode of Pi2 waves in the equatorial region: Difference of Pi2 mode between high and equatorial latitudes, J. Geomag. Geoelectr., 40, 621–634, 1988.
Klimushkin, D. Yu., Mager, P. N., and Glassmeier, K.-H.: Toroidal and poloidal Alfvén waves with arbitrary azimuthal wavenumbers in a finite pressure plasma in the Earth's magnetosphere, Ann. Geophys., 22, 267–287, https://doi.org/10.5194/angeo-22-267-2004, 2004.
Li, Y., Fraser, B. J., Menk, F. W., Webster, D. J., and Yumoto, K.: Properties and sources of low and very low latitude Pi2 pulsations, J. Geophys. Res., 103, 2343–2358, 1998.
Liu, J., Angelopoulos, V., Runov, A., and Zhou, X.-Z.: On the current sheets surrounding dipolarizing flux bundles in the magnetotail: The case for wedgelets, J. Geophys. Res., 118, 2000–20120, 2013.
Liu, J., Angelopoulos, V., Zhou, X.-Z., and Runov, A.: Magnetic flux transport by dipolarizing flux bundles, J. Geophys. Res., 119, 909–926, https://doi.org/10.1002/2013JA019395, 2014.
Liu, J., Angelopoulos, V., Zhou, X.-Z., Yao, Z.-H., and Runov, A.: Cross-tail expansion of dipolarizing flux bundles, J. Geophys. Res., 120, 2516–2530, https://doi.org/10.1002/2015JA020997, 2015.
Lui, A. T. Y.: Current disruption in the Earth's magnetosphere: Observations and models, J. Geophys. Res., 101, 13067–13088, 1996.
Machida, S., Miyashita, Y., Ieda, A., Nosé, M., Nagata, D., Liou, K., Obara, T., Nishida, A., Saito, Y., and Mukai, T.: Statistical visualization of the Earth's magnetotail based on Geotail data and the implied substorm model, Ann. Geophys., 27, 1035–1046, https://doi.org/10.5194/angeo-27-1035-2009, 2009.
Machida, S., Miyashita, Y., Ieda, A., Nosé, M., Angelopoulos, V., and McFadden, J. P.: Statistical visualization of the Earth's magnetotail and the implied mechanism of substorm triggering based on superposed-epoch analysis of THEMIS data, Ann. Geophys., 32, 99–111, https://doi.org/10.5194/angeo-32-99-2014, 2014.
McPherron, R. L., Russell, C. T., and Aubry, M. P.: Satellite studies of magnetospheric substorms on August 15, 1968: 9. Phenomenological model for substorms, J. Geophys. Res., 78, 3131–3148, 1973.
Merkin, V. G., Panov, E. V., Sorathia, K. A., and Ukhorskiy, A. Y.: Contribution of bursty bulk flows to the global dipolarization of the magnetotail during an isolated substorm, J. Geophys. Res., 124, 8647–8668, https://doi.org/10.1029/2019JA026872, 2019.
Miyashita, Y., Machida, S., Kamide, Y., Nagata, D., Liou, K., Fujimoto, M., Ieda, A., Saito, M. H., Russell, C. T., Christon, S. P., Nose, M., Frey, H. U., Shinohara, I., Muaki, T., Saito, Y., and Hayakawa, H.: A state-of-the-art picture of substorm-associated evolution of the near-Earth magnetotail obtained from superposed epoch analysis, J. Geophys. Res., 114, A01211, https://doi.org/10.1029/2008JA013225, 2009.
Morioka, A., Miyoshi, Y., Miyashita, Kasaba, Y., Misawa, H., Tsuchiya, F., Kataoka, R., Kadokura, A., Mukai, T., Yumoto, K., Menietti, D. J., Parks, G., Liou, K., Honary, and Donovan, E.: Two-step evolution of auroral acceleration at substorm onset, J. Geophys. Res., 115, A11213, https://doi.org/10.1029/2010JA015361, 2010.
Nagai, T., Fujimoto, M., Saito, Y., Machida, S., Terasawa, T., Nakamura, R., Yamamoto, T., Mukai, T., Nishida, A., and Kokubun, S.: Structure and dynamics of magnetic reconnection for substorm onsets with Geotail observations, J. Geophys. Res., 103, 4419–4440, 1998.
Nakamura, R., Baumjohann, W., Brittnacher, M., Sergeev, V. A., Kubyshkina, Mukai, T., and Liou, K.: Flow bursts and auroral activations: Onset timing and foot point location, J. Geophys. Res., 106, 10777–10789, 2001.
Oguti, T., Kitamura, T., and Watanabe, T.: Global aurora dynamics campaign, 1985–1986, J. Geomag. Geoelectr., 40, 485–504, 1988.
Ohtani, S.-I. and Tamao, T.: Does the ballooning instability trigger substorms in the near-earth magnetotail?, J. Geophys. Res., 98, 19369–19379, 1993.
Ohtani, S.-I., Miura, A., and Tamao, T.: Coupling between Alfven and slow magnetosonic waves in an inhomogeneous finite-β plasma: 1 Coupled equations and physical mechanism, Planet. Space Sci., 37, 567–577, 1989.
Ohtani, S.-I., Motoba, T., Gkioulidou, M., Takahashi, K., and Singer, H. J.: Spatial development of the dipolarization region in the inner magnetosphere, J. Geophys. Res., 123, 5452–5463, https://doi.org/10.1029/2018JA025443, 2018.
Rubtsov, A. V., Mager, P. N., and Klimushkin, D. Yu.: Ballooning instability of azimuthally small scale coupled Alfven and slow magnetoacoustic modes in two-dimensionally inhomogeneous magnetospheric plasma, Phys. Plasmas, 25, 102903, https://doi.org/10.1063/1.5051474, 2018.
Runov, A., Angelopoulos, V., Zhou, X.-Z., Zhang, X.-J., Li, S., Plaschke, F., and Bonnell, J.: A THEMIS multicase study of dipolarization fronts in the magnetotail plasma sheet, 116, A05216, https://doi.org/10.1029/2010JA016316, 2011.
Saka, O.: A new scenario applying traffic flow analogy to poleward expansion of auroras, Ann. Geophys., 37, 381–387, https://doi.org/10.5194/angeo-37-381-2019, 2019.
Saka, O. and Hayashi, K.: Longitudinal expansion of field line dipolarization, J. Atmos. Sol.-Terr. Phys., 164, 235–242, 2017.
Saka, O., Akaki, H., and Baker, D. N.: A satellite magnetometer observation of dusk-to-dawn current in the midnight magnetosphere at low-latitude Pi2 onset, Earth Planet. Space, 54, e1–e4, 2002.
Saka, O., Hayashi, K, and Thomsen, M.: First 10 min intervals of Pi2 onset at geosynchronous altitudes during the expansion of energetic ion regions in the nighttime sector, J. Atmos. Sol.-Terr. Phys., 72, 1100–1109, 2010.
Saka, O., Hayashi, K., and Koga, D.: Excitation of the third harmonic mode in meridian planes for Pi2 in the auroral zone, J. Geophys. Res., 117, A12215, https://doi.org/10.1029/2012JA018003, 2012.
Sakurai, T. and Saito, T.: Magnetic pulsation Pi2 and substorm onset, Planet. Space Sci., 24, 573–575, 1972.
Samson, J. C. and Harrold, B. G.: Characteristic time constant and velocities of high-latitude Pi2's, J. Geophys. Res., 90, 12173–12181, 1985.
Shiokawa, K., Baumjohann, W., and Haerendel, G.: Braking of high-speed flows in the near-Earth tail, J. Geophys. Res., 24, 1179–1182, 1997.
Takahashi, K., Ohtani, S.-I., and Anderson, B. J.: Statistical analysis of Pi2 pulsations observed by the AMPTE CCE spacecraft in the inner magnetosphere, J. Geophys. Res., 100, 21929–21941, 1995.
Takahashi, K., Anderson, B. J., and Ohtani, S.-I.: Multisatllite study of nightside transient toroidal waves, J. Geophys. Res., 101, 24815–24825, 1996.
Tanaka, T., Nakamizo, A., Yoshikawa, A., Fujita, S., Shinagawa, H., Shimazu, H., Kikuchi, T., and Hashimoto, K. K.: Substorm convection and current system deduced from the global simulation, J. Geophys. Res., 115, A05220, https://doi.org/10.1029/2009JA014676, 2010.
Yang, J., Toffoletto, F. R., Wolf, R. A., Sazykin, S., Ontiveros, P. A., and Weygand, J. M.: Large-scale current systems and ground magnetic disturbance during deep substorm injections, J. Geophys. Res., 117, A04223, https://doi.org/10.1029/2011JA017415, 2012.
Yao, Z, Sun, W. J., Fu, S. Y., Pu, Z. Y., Liu, J., Angelopoulos, V., Zhang, X.-J., Chu, X. N., Shi, Q. Q., Guo, R. L., and Zong, Q.-G.: Current structures associated with dipolarization fronts, J. Geophys. Res., 118, 6980–6985, https://doi.org/10.1002/2013JA019290, 2013.
- Abstract
- Introduction
- Summary of the onset timing study using ground Pi2s at the Equator
- Pre-onset intervals leading to field line dipolarization
- Excitation of slow magnetoacoustic waves
- Field line dipolarization in the vicinity of geosynchronous orbit
- Coupling of magnetosphere and ionosphere in association with field line dipolarization
- Triggering mechanisms of low-latitude Pi2s
- Discussion and summary
- Appendix A
- Code and data availability
- Competing interests
- Acknowledgements
- Review statement
- References