the Creative Commons Attribution 4.0 License.
the Creative Commons Attribution 4.0 License.
 | 31 Mar 2020
Semimonthly oscillation observed in the start times of equatorial plasma bubbles
Ana Roberta Paulino
Ricardo Y. C. Cueva
Ebenezer Agyei-Yeboah
Ricardo Arlen Buriti
Hisao Takahashi
Cristiano Max Wrasse
Ângela M. Santos
Amauri Fragoso de Medeiros
Inez S. Batista
Using airglow data from an all-sky imager deployed at São João do Cariri (7.4∘ S, 36.5∘ W), the start times of equatorial plasma bubbles was studied in order to investigate the day-to-day variability of this phenomenon. Data from a period over 10 years were analyzed from 2000 to 2010. Semimonthly oscillations were clearly observed in the start times of plasma bubbles from OI6300 airglow images during this period of observation, and four case studies (September 2003, September–October 2005, November 2005 and January 2008) were chosen to show in detail this kind of modulation. Since the airglow measurements are not continuous in time, more than one cycle of oscillation in the start times of plasma bubbles cannot be observed from these data. Thus, data from a digisonde at São Luís (2.6∘ S, 44.2∘ W) in November 2005 were used to corroborate the results. Technical/climate issues did not allow one to observe the semimonthly oscillations simultaneously by the two instruments, but from October to November 2005 there was a predominance of this oscillation in the start times of the irregularities over Brazil. Besides, statistical analysis for the data in the whole period of observation has shown that the lunar tide, which has semimonthly variability, is likely the main forcing for the semimonthly oscillation in the start times of equatorial plasma bubbles. The presence of this oscillation can contribute to the day-to-day variability of equatorial plasma bubbles.
- Article
(1593 KB) -
Supplement
(1093 KB) - BibTeX
- EndNote


Equatorial plasma bubbles (EPBs) are generated on the bottom side of the F region in the equatorial ionosphere when there is an unstable F layer. They generally occur after the pre-reversal enhancement (PRE), after sunset. The pre-reversal enhancement consists of an increase in the eastward electric field, before its reversal to the west, which causes an enhancement in the F-layer vertical drift before the motion of the plasma is downward reverted. The main mechanism used to explain the development of the EPBs is the Rayleigh–Taylor (RT) instability. According to this theory, the RT growth rate is inversely proportional to the collision frequency between the neutral and ionic particles, and it is proportional to the plasma density gradient. Thus, when the PRE is strong, it becomes more probable for EPBs to occur.
In addition, the RT instability process needs a seeding mechanism, which has been largely studied in the last decades. Some researchers have pointed out gravity waves as seeding to the EPB (e.g., Fritts et al., 2008; Abdu et al., 2009; Takahashi et al., 2009; Taori et al., 2011; Paulino et al., 2011). Other studies have marked the dynamics of post-sunset vortex and PRE dynamics as enough for the EPB origin (e.g., Kudeki and Bhattacharyya, 1999; Kudeki et al., 2007; Eccles et al., 2015; Tsunoda et al., 2018; Huang, 2018). The thermospheric neutral wind system and the associated electrodynamics have also been proposed as sufficient for the EPB appearance as well (e.g., Saito and Maruyama, 2009). Influences of magnetic storms and large-scale waves have also been reported as important mechanisms in the day-to-day variability of EPBs (e.g., Abalde et al., 2009; Huang et al., 2013).
Actually, observations have shown that there is a strong day-to-day variability of the EPB occurrence and development (e.g., Carter et al., 2014; Abdu, 2019), and it is a topic of current research. There is evidence of planetary waves acting in the neutral winds and consequently changing the background condition of the atmosphere (e.g., Forbes, 1996; Takahashi et al., 2006; Abdu and Brum, 2009; Chang et al., 2010; Onohara et al., 2013; Zhu et al., 2017).
Stening and Fejer (2001) published the first work proposing the influence of lunar tides on the probability of occurrence of EPBs. It is well known that the main component of the lunar tides has a semimonthly oscillation. Based on these factors, the present work shows, for the first time, that there are semimonthly oscillations statistically significant in the start times of EPBs observed by airglow images throughout the period of observations. Besides, these oscillations follow the moon phases. These results can indicate strong evidence of the lunar semidiurnal tide modulating the wind system in the F region, and consequently it drives the time of generation of Spread-F.
Airglow measurements of the OI 630.0 nm (OI6300) have been recorded at São João do Cariri (7.4∘ S, 36.5∘ W) since September 2000. In this investigation, data from September 2000 to December 2010 were used, which corresponds to the first generation of the all-sky imager deployed in this observatory.
The all-sky imager is composed of a fish-eye lens, a telecentric set of lenses, a filter wheel, a set of lenses to reconstruct the image, a charge-coupled device (CCD) chip and a cooling system. This instrument has a field of view of 180∘ of the sky. Further details of this imager have been published elsewhere (e.g., Paulino et al., 2016). Airglow images of the OI6300 were taken by about 15 d around the new moon with an integration time of 90 s. Depending on the mode of operation, images can have 2–4 min of temporal resolution. The start and end times can be extracted directly from the image header after observing the appearance or disappearance of the structures. The start time was defined as the time when the plasma bubbles appeared in the images. It generally occurs in the northwestern part of the images. After that, the plasma bubbles start their development and dynamics.
Figure 1 shows an example of the determination of the start times of EPBs on 27 January 2001. The short movie in the Supplement (which is also available at https://doi.org/10.5446/45230, Paulino, 2020) can help one to identify the time in which the plasma bubbles start to extend to the southern part of the images.
Corroborative data from a Digisonde Portable Sounder (DPS) installed at São Luís (2.6∘ S, 44.2∘ W) were also used to identify the time of maximum vertical drift of the F layer, which corresponds to the time of the pre-reversal enhancement. The DPS is a high-frequency (HF) radar which operates in a sweeping mode in the frequency range from 1 to 30 MHz, generating one ionogram (graphic of frequency versus virtual height) every 10 min. Besides the ionogram, the DPS also detects the Doppler shifts of the irregularities, which can be used to calculate the drifts. Data collected in October 2003, October 2005 and November 2005 were investigated. However, semimonthly oscillation in the time of maximum vertical drift of the F layer were observed only in November 2005, and it will be discussed latter. Further details about the digisonde deployed at São Luís and the methodology of determination of the vertical plasma drifts from ionograms have been published elsewhere (e.g., Resende et al., 2019).
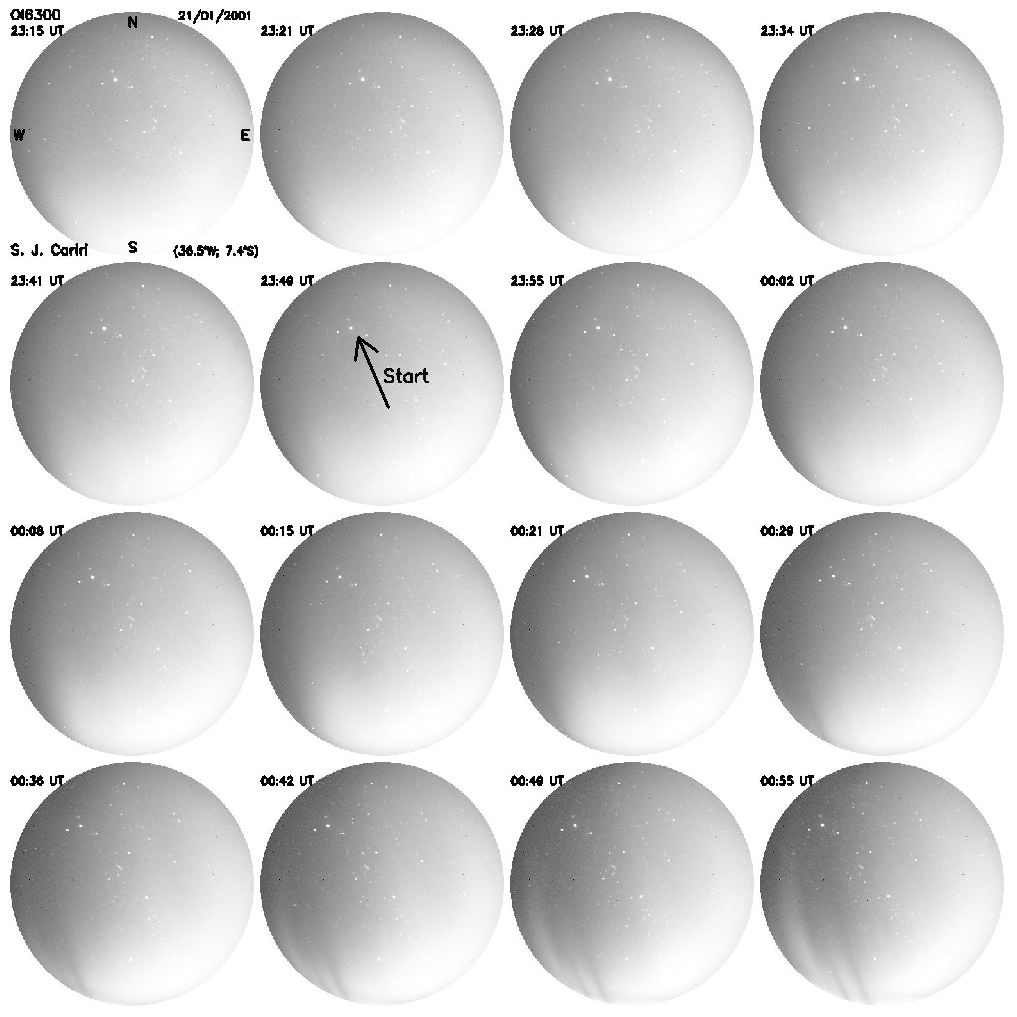
Figure 2a shows the evolution of the start times of the EPBs observed in September 2003 over São João do Cariri. The solid line represents the best fit for a periodicity of 14.5 d, the stars correspond to the exact time in which the plasma bubble appeared in the OI6300 images and the filled circle shows the new moon time. In this case, one can see a good agreement of the fit line with the observation during a half cycle of the oscillation. The amplitude of this oscillation was calculated from the fitting as ∼52 min; i.e., there was a difference of ∼52 min in the start times of EPBs along the observed nights.
Figure 2b shows the best fit 14.5 d oscillation in the start times of EPBs observed from late September to early October 2005. For the whole period of airglow observation, it was the best case study observed because it covers a full cycle of the oscillation. There was an amplitude of ∼37 min and the position of the new moon was observed on 3 October 2005. The predominance of this oscillation in the start times of EPBs persists up to November 2005, as shown in Fig. 2c with a higher amplitude of ∼70 min.
Similar results to September 2003 and November 2005 were found in January 2008, as one can see in Fig. 2d, including the position of the new moon in the cycle. The estimated amplitude was ∼45 min.
The results from Fig. 2 indicate that the start times of EPBs were modulated by a semimonthly oscillation. Besides the results from Fig. 2, there were other events that showed a tendency of the start times of EPBs to follow the semimonthly periodicities. However, only a few days, less than half a month, were observed, and those results are not shown here. Additionally, long-term statistical analysis will be discussed later.
The present work concentrates the discussion on the cases in which a half cycle could be observed. Semimonthly oscillations well known in the atmosphere are (1) quasi 16 d planetary waves and (2) lunar semidiurnal tides.
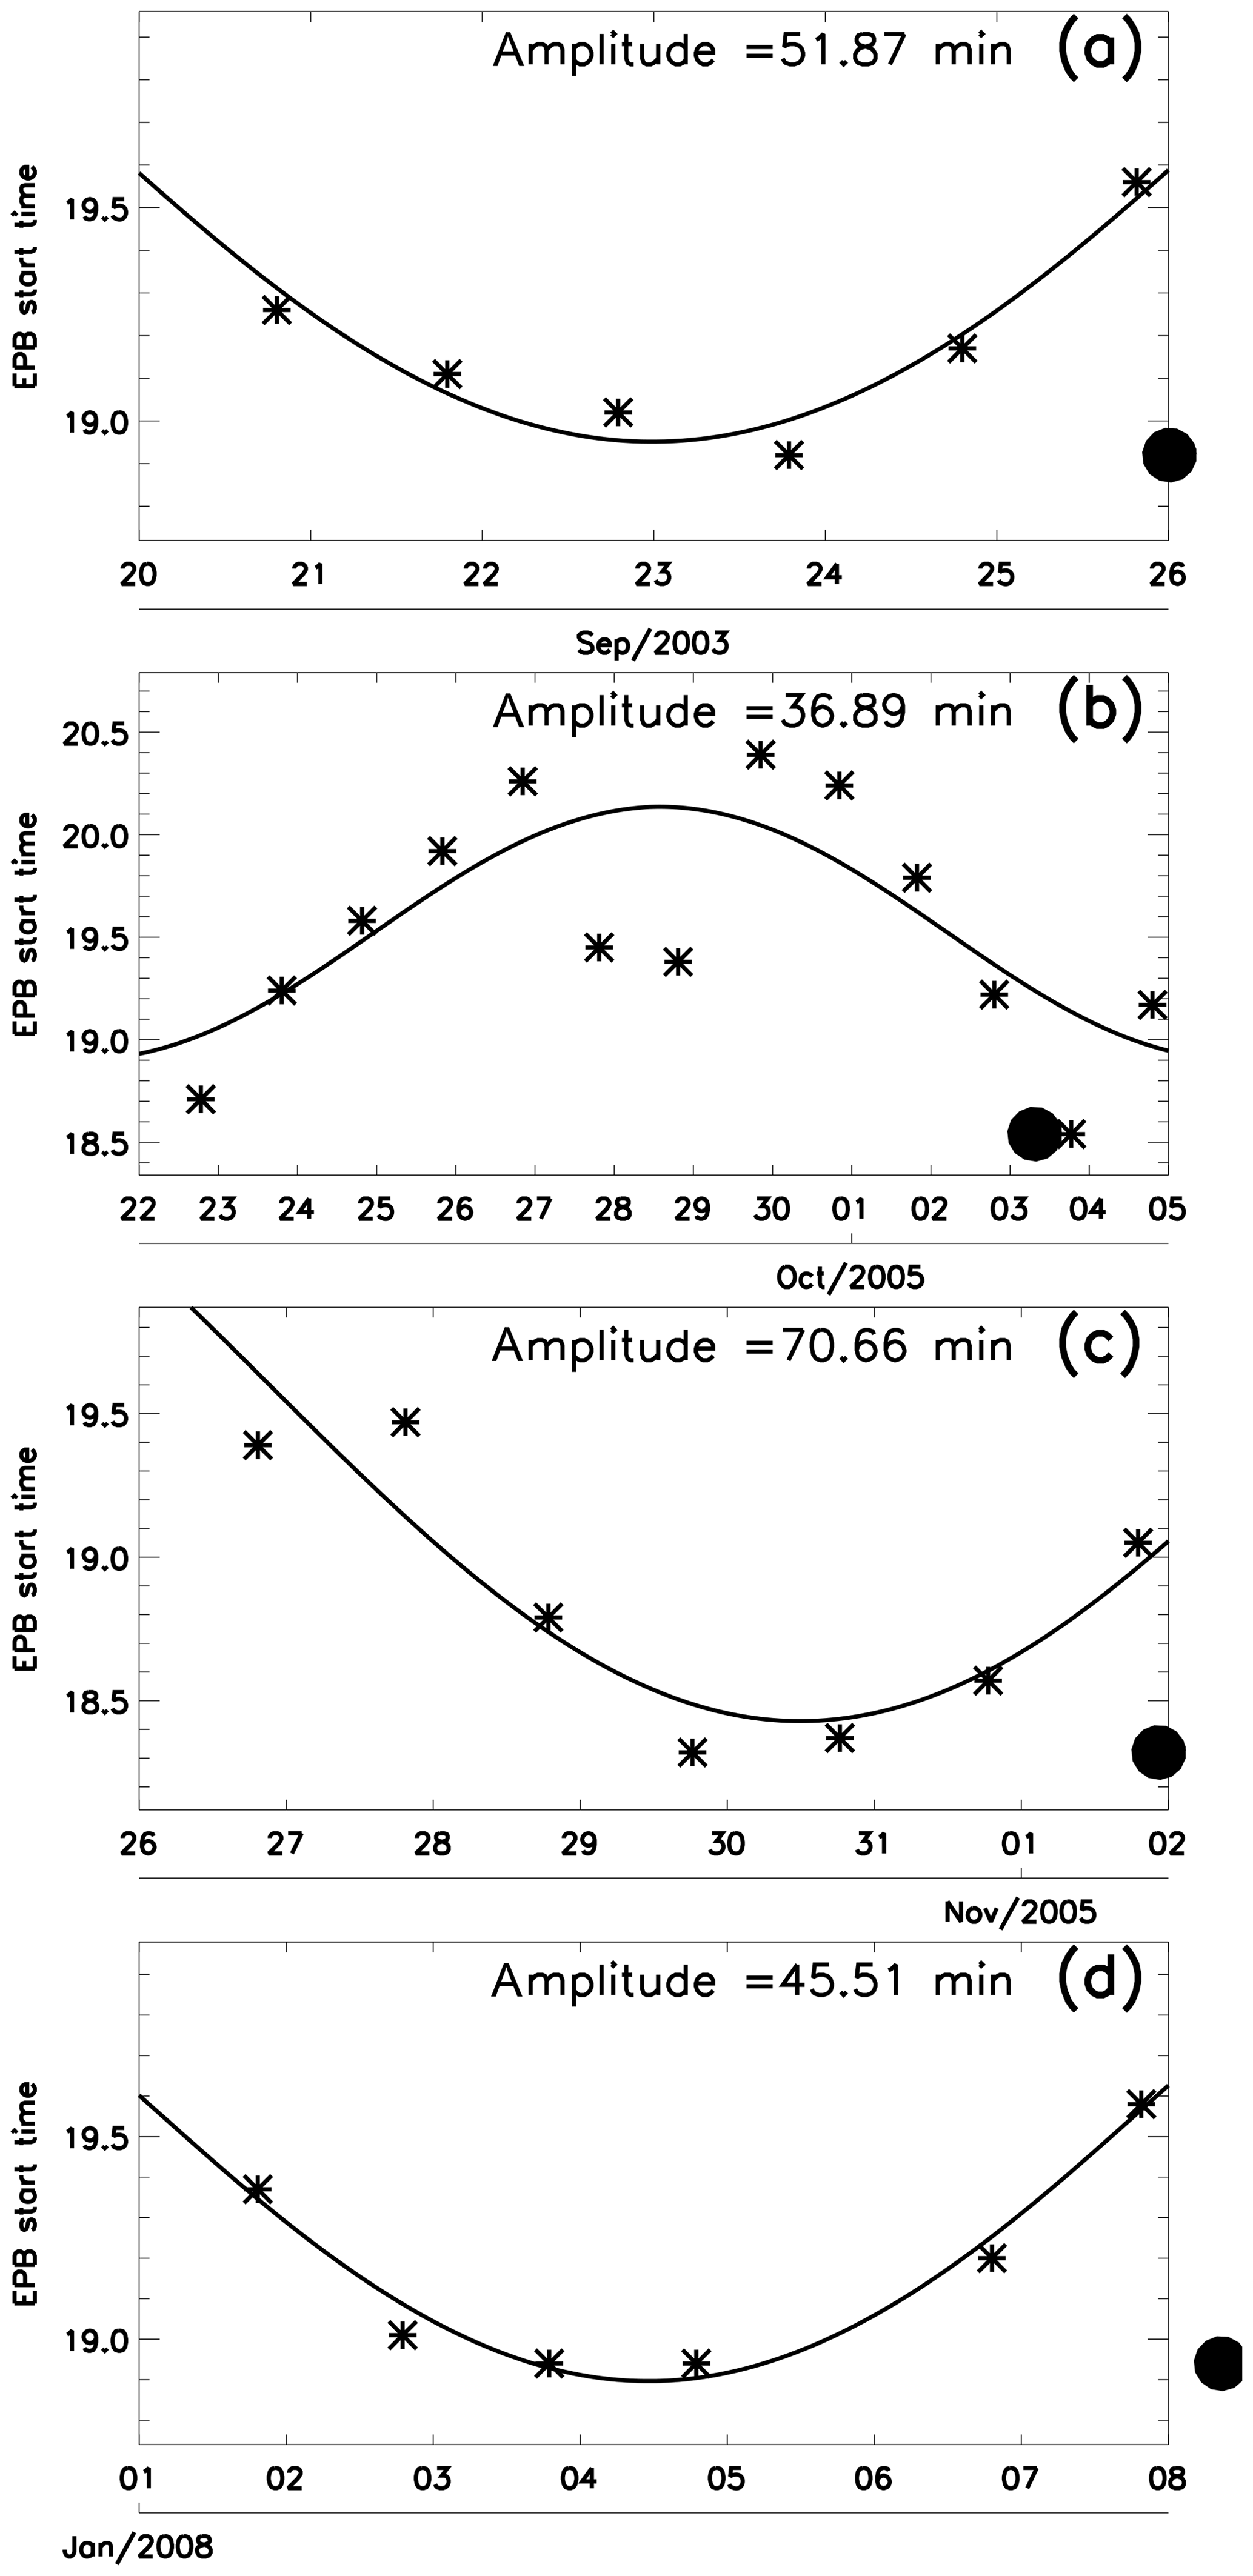
Figure 2Start times of plasma bubbles (stars) as functions of time. Solid line represents the best fit to a sinusoidal oscillation with a period of 14.5 d. The respective amplitudes are shown at the middle top of the panels. Panel (a) shows the results for September 2003. Panel (b) shows the results for September–October 2005. Panel (c) shows the results for October–November 2005. Panel (d) shows the results for January 2008. Filled circles indicate the new moons.
Simulations have shown that the 16 d planetary waves (PWs) have large amplitudes in the winter hemisphere at the lower levels of the atmosphere and high latitudes, but above the mesosphere, there is a penetration of this wave to the summer hemisphere, which allows them to be observed in both hemispheres, including in the equatorial region (Miyoshi, 1999).
Forbes and Leveroni (1992) have pointed out that 16 d oscillation in the E and F regions could be connected by the upward propagation of Rossby waves from the winter stratosphere. Although the 16 d PW has a well-defined seasonality in the lower atmosphere, according to the simulations, in the upper atmosphere the presence of this oscillation has been predicted to be more spread along the year (Miyoshi, 1999). It is also important to mention that the 16 d oscillations were observed in the mesosphere and lower thermosphere from 85 to 100 km altitude in the equatorial region in the zonal wind during the period around the September equinox and solstices of 1994 (Luo et al., 2002), which coincides with the periods of observation of the results of Fig. 2.
Lunar semidiurnal tides have been pointed out as important factors in the appearance and the start times of EPBs (e.g., Stening and Fejer, 2001). The main reason for the influence of the lunar tides in the EPB variability is the capability of the lunar tides to propagate upward to high levels of the atmosphere and consequently to affect the pre-reversal enhancement (PRE) amplitude and time (Stening and Fejer, 2001). Another factor to be considered is the moon phase (new moon) that coincides with zero position of the oscillation for all observed cases, including the case study observed from the DPS that will be shown ahead. The real mechanism that allows the lunar tides to act in the PRE is not well defined, but some works have pointed out either the direct propagation to the bottom side of the ionospheric F region (e.g., Evans, 1978; Forbes, 1982) or coupling of the E region dynamo to the F region (e.g., Immel et al., 2009; Eccles et al., 2011).
In order to corroborate the present results, data from the DPS deployed in São Luís have been used to investigate the occurrence of maximum vertical drifts. The main goal of this analysis is to try to observe more of this kind of oscillation in other ionospheric parameters. Although the DPS operates continuously every day, i.e., the digisonde does not depend on the tropospheric weather conditions, only a half cycle of the oscillation could be observed in the used data.
Figure 3 shows the temporal evolution of the time of the maximum vertical drift observed from the DPS data in early November 2005. An amplitude of ∼46 min was calculated, indicating that the PRE is sensitive to the semimonthly oscillation as well. An important factor in these observations was that this oscillation acted in the ionosphere for a long period, since the start times of EPBs from late September (Fig. 2b). There were simultaneous measurements of the start times of EPBs and the times of maximum vertical drifts in October 2005. However, the latter have not presented reliable results for the semimonthly oscillation.

Figure 3Same as Fig. 2 but for the time of the maximum of the vertical drift of the F layer.
Figures 2 and 3 show that the ionospheric parameter can be controlled by semimonthly oscillations. However, the strong day-to-day variability of the spread-F does not allow one to always observe this signature. Another difficulty in the DPS data analysis was that the algorithm does not give an exact start time of the oscillation; i.e., there was a temporal resolution of 10 min in this determination.
Although the performed fit to the start times of EPBs and the fit to the times of maximum vertical drifts of the F layer presented high amplitudes and very good agreements with the observation, only one case studied presented an almost full cycle (Fig. 2b). Then, a statistical analysis was done in order to observe the relevance of this approach and how frequent the modulation of the semimonthly oscillation is in the start times of EPBs. This analysis was performed considering the potential effect of the lunar tides on the ionosphere as simulated and discussed by Stening and Fejer (2001). In order to do that, a methodology described by Matsushita (1967) has also been used.
Figure 4 shows hourly means of the local start times of EPBs as a function of the lunar local time between 18:00 and 01:00, which corresponds to almost one cycle of the lunar tidal oscillation (12 h) with maximum after 01:00, minimum around 21:00 local lunar time and amplitude of ∼13.5 min. One can note that the scattering (error bars) changes along time. Assuming the standard deviation as a measurement of uncertainty, the corresponding 1σ levels of uncertainties were ∼4.8 min in amplitude and ∼0.63 h in phase. According to the normal distribution, 68 % of the points are between the ±1σ level around the mean value. Furthermore, one can see a good agreement between the 12 h oscillation and the data sets. This methodology has also been published in the work by Forbes et al. (2013). It is important to highlight that besides the well-known temporal variability of the lunar tide, the present data carry influences of other geophysical variability in the start times of EPBs.
The lunar time was calculated as , where t is the local solar time and ν is the age of the moon, which depends on the phases of the moon. Further details about the calculation of the lunar time can be found in Paulino et al. (2017) and references therein.
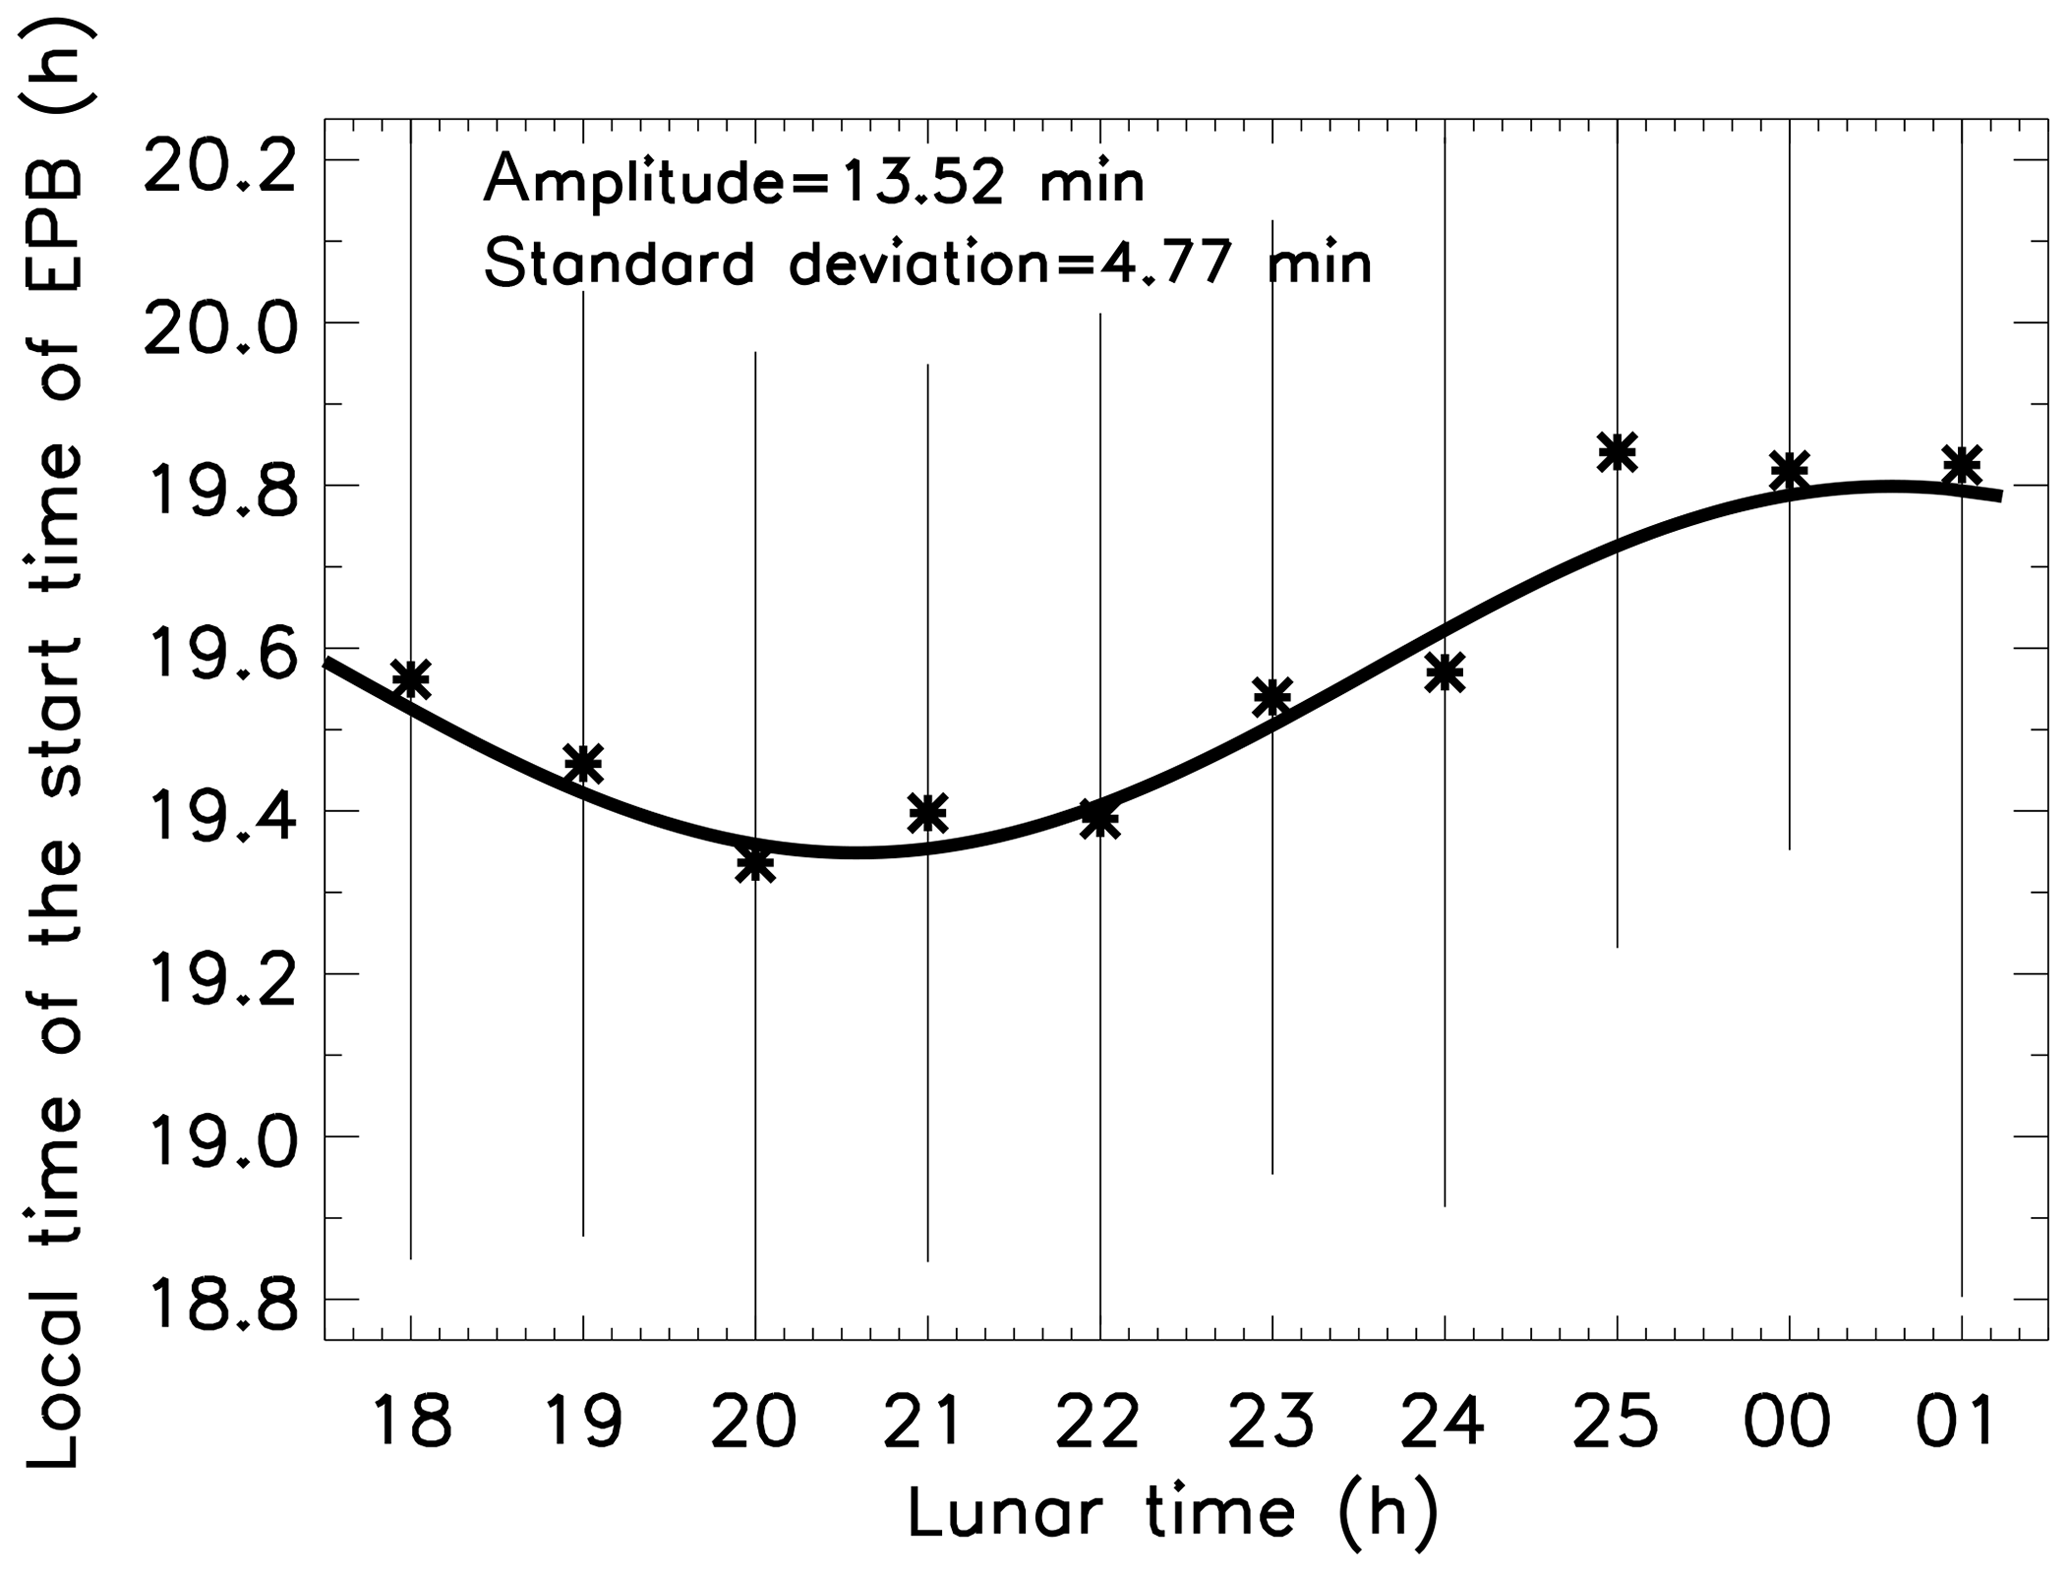
Figure 4Lunar semidiurnal M2 fit (solid line) to the start times of EPBs observed from the airglow images. The error bars are the standard deviation of the data within each hourly bin.
From the results of Fig. 4, it is clear that the semimonthly oscillation is always present in the start times of EPBs with a significant amplitude. It suggests that the lunar semidiurnal tide, which has a well-defined semimonthly variation, has an important role in the time of occurrence of EPBs. Previous studies have pointed out that the lunar semidiurnal tide can modulate ionospheric parameters such as the height and critical frequency of the F layer or PRE drifts. The present results strongly suggest that the generation of EPBs is affected as well. Further analysis of the start times of Spread-F using radar measurements will be important in the advances of the knowledge of the day-to-day variability of EPBs.
Using almost one solar cycle of data from OI630 airglow images, semimonthly oscillations in the start times of EPBs were observed and the results are summarized as follows.
-
Four periods of airglow observation showed amplitudes higher than 36 min in the start times of EPBs for 14.5 d oscillation, three periods of observations (September 2003, October 2005 and January 2008) revealed a good fit for the half cycle and the other case (September 2005) showed one almost complete cycle.
-
DPS measurements from São Luís showed semimonthly oscillation in the maximum vertical drifts of the F region related to the PRE.
-
Statistical analysis in the whole period of observations of EPBs in the airglow images revealed that semimonthly oscillations are always present in the start times of EPBs, when the lunar time was considered. Thus, it strongly suggests that the lunar semidiurnal tide has an important role in the start times of EPBs.
The present results indicate that one semimonthly dynamical structure can control either the start time or the amplitude of the PRE that can consequently produce EPBs. These results must contribute to understanding the day-to-day variability of equatorial plasma bubbles. However, the results show that besides the semimonthly oscillations, other phenomena are important to the day-to-day variability occurrence of EPBs since this oscillation is not dominant in the whole period of observation. Regarding the agents that are causing this oscillation, further investigations are necessary; however, semidiurnal lunar tides appeared as an important phenomenon in the times of appearance of EPBs.
All-sky image data can be requested from either the Aerolume (UFCG) or Lume (INPE) groups through the e-mail address of the first author of the paper. DPS ionograms can be requested to Inez S. Batista (inez.batista@inpe.br).
A video supplement is available for this publication. Please see https://doi.org/10.5446/45230 (Paulino, 2020).
The supplement related to this article is available online at: https://doi.org/10.5194/angeo-38-437-2020-supplement.
IP wrote the manuscript and did most of the airglow analysis. ARP discussed the semimonthly oscillation due to lunar tides and 16 d planetary waves. RYCC contributed to the discussion on the start times of EPBs. EAY reduced all of the image data, calculating the start times of EPBs. RAB contributed to running the experiments in São João do Cariri and helped with the analysis. HT contributed to the discussion of 16 d oscillation. ÂMS evaluated the times of maximum vertical drifts of the F layer. AFdM and CMW provided some computing codes to work with the OI6300 airglow images. ISB provided the DPS data for analysis.
The authors declare that they have no conflict of interest.
This article is part of the special issue “7th Brazilian meeting on Space Geophysics and Aeronomy”. It is a result of the Brazilian meeting on Space Geophysics and Aeronomy, Santa Maria/RS, Brazil, 5–9 November 2018.
Igo Paulino and Cristiano M. Wrasse thank the Conselho Nacional de Desenvolvimento Científico e Tecnológico (CNPq) for the financial support (303511/2017-6, 307653/2017-0). Ana Roberta Paulino thanks the Coordenação de Aperfeiçoamento de Pessoal de Nínel Superior (CAPES) for the scholarship and CNPq for the grant (no. 460624/2014-8). Ângela M. Santos acknowledges the Fundação de Amparo à Pesquisa do Estado de São Paulo – FAPESP – for the financial support under grant 2015/25357-4.
This research has been supported by the Conselho Nacional de Desenvolvimento Científico e Tecnológico (grant nos. 303511/2017-6, 307653/2017-0 and 460624/2014-8) and the Fundação de Amparo à Pesquisa do Estado de São Paulo (FAPESP) (grant no. 2015/25357-4).
This paper was edited by Fabiano Rodrigues and reviewed by two anonymous referees.
Abalde, J. R., Sahai, Y., Fagundes, P. R., Becker-Guedes, F., Bittencourt, J. A., Pillat, V. G., Lima, W. L. C., Candido, C. M. N., and de Freitas, T. F.: Day-to-day variability in the development of plasma bubbles associated with geomagnetic disturbances, J. Geophys. Res.-Space, 114, A04304, https://doi.org/10.1029/2008JA013788, 2009. a
Abdu, M. A.: Day-to-day and short-term variabilities in the equatorial plasma bubble/spread F irregularity seeding and development, Progress in Earth and Planetary Science, 6, 11, https://doi.org/10.1186/s40645-019-0258-1, 2019. a
Abdu, M. A. and Brum, C. G. M.: Electrodynamics of the vertical coupling processes in the atmosphere-ionosphere system of the low latitude region, Earth Planets Space, 61, 385–395, https://doi.org/10.1186/BF03353156, 2009. a
Abdu, M. A., Alam Kherani, E., Batista, I. S., de Paula, E. R., Fritts, D. C., and Sobral, J. H. A.: Gravity wave initiation of equatorial spread F/plasma bubble irregularities based on observational data from the SpreadFEx campaign, Ann. Geophys., 27, 2607–2622, https://doi.org/10.5194/angeo-27-2607-2009, 2009. a
Carter, B. A., Yizengaw, E., Retterer, J. M., Francis, M., Terkildsen, M., Marshall, R., Norman, R., and Zhang, K.: An analysis of the quiet time day-to-day variability in the formation of postsunset equatorial plasma bubbles in the Southeast Asian region, J. Geophys. Res.-Space, 119, 3206–3223, https://doi.org/10.1002/2013JA019570, 2014. a
Chang, L. C., Palo, S. E., Liu, H.-L., Fang, T.-W., and Lin, C. S.: Response of the thermosphere and ionosphere to an ultra fast Kelvin wave, J. Geophys. Res.-Space, 115, A00G04, https://doi.org/10.1029/2010JA015453, 2010. a
Eccles, J. V., St. Maurice, J. P., and Schunk, R. W.: Mechanisms underlying the prereversal enhancement of the vertical plasma drift in the low-latitude ionosphere, J. Geophys. Res.-Space, 120, 4950–4970, https://doi.org/10.1002/2014JA020664, 2015. a
Eccles, V., Rice, D. D., Sojka, J. J., Valladares, C. E., Bullett, T., and Chau, J. L.: Lunar atmospheric tidal effects in the plasma drifts observed by the Low-Latitude Ionospheric Sensor Network, J. Geophys. Res.-Space, 116, A07309, https://doi.org/10.1029/2010JA016282, 2011. a
Evans, J. V.: A note on lunar tides in the ionosphere, J. Geophys. Res.-Space, 83, 1647–1652, https://doi.org/10.1029/JA083iA04p01647, 1978. a
Forbes, J. M.: Atmospheric tide: 2. The solar and lunar semidiurnal components, J. Geophys. Res.-Space, 87, 5241–5252, https://doi.org/10.1029/JA087iA07p05241, 1982. a
Forbes, J. M.: Planetary Waves in the Thermosphere-Ionosphere System, J. Geomagn. Geoelectr., 48, 91–98, https://doi.org/10.5636/jgg.48.91, 1996. a
Forbes, J. M. and Leveroni, S.: Quasi 16-day oscillation in the ionosphere, Geophys. Res. Lett., 19, 981–984, https://doi.org/10.1029/92GL00399, 1992. a
Forbes, J. M., Zhang, X., Bruinsma, S., and Oberheide, J.: Lunar semidiurnal tide in the thermosphere under solar minimum conditions, J. Geophys. Res.-Space 118, 1788–1801, https://doi.org/10.1029/2012JA017962, 2013. a
Fritts, D. C., Vadas, S. L., Riggin, D. M., Abdu, M. A., Batista, I. S., Takahashi, H., Medeiros, A., Kamalabadi, F., Liu, H.-L., Fejer, B. G., and Taylor, M. J.: Gravity wave and tidal influences on equatorial spread F based on observations during the Spread F Experiment (SpreadFEx), Ann. Geophys., 26, 3235–3252, https://doi.org/10.5194/angeo-26-3235-2008, 2008. a
Huang, C.-S.: Effects of the postsunset vertical plasma drift on the generation of equatorial spread F, Progress in Earth and Planetary Science, 5, 3, https://doi.org/10.1186/s40645-017-0155-4, 2018. a
Huang, C.-S., de La Beaujardière, O., Roddy, P. A., Hunton, D. E., Ballenthin, J. O., Hairston, M. R., and Pfaff, R. F.: Large-scale quasiperiodic plasma bubbles: C/NOFS observations and causal mechanism, J. Geophys. Res.-Space, 118, 3602–3612, https://doi.org/10.1002/jgra.50338, 2013. a
Immel, T. J., England, S. L., Zhang, X., Forbes, J. M., and DeMajistre, R.: Upward propagating tidal effects across the E- and F-regions of the ionosphere, Earth Planets Space, 61, 505–512, https://doi.org/10.1186/BF03353167, 2009. a
Kudeki, E. and Bhattacharyya, S.: Postsunset vortex in equatorial F-region plasma drifts and implications for bottomside spread-F, J. Geophys. Res.-Space, 104, 28163–28170, https://doi.org/10.1029/1998JA900111, 1999. a
Kudeki, E., Akgiray, A., Milla, M., Chau, J. L., and Hysell, D. L.: Equatorial spread-F initiation: Post-sunset vortex, thermospheric winds, gravity waves, J. Atmos. Sol.-Terr. Phy., 69, 2416–2427, https://doi.org/10.1016/j.jastp.2007.04.012, 2007. a
Luo, Y., Manson, A. H., Meek, C. E., Meyer, C. K., Burrage, M. D., Fritts, D. C., Hall, C. M., Hocking, W. K., MacDougall, J., Riggin, D. M., and Vincent, R. A.: The 16-day planetary waves: multi-MF radar observations from the arctic to equator and comparisons with the HRDI measurements and the GSWM modelling results, Ann. Geophys., 20, 691–709, https://doi.org/10.5194/angeo-20-691-2002, 2002. a
Matsushita, S.: Lunar Tides in the Ionosphere, 547–602, Springer Berlin Heidelberg, Berlin, Heidelberg, https://doi.org/10.1007/978-3-642-46082-1_2, 1967. a
Miyoshi, Y.: Numerical simulation of the 5-day and 16-day waves in the mesopause region, Earth Planets Space, 51, 763–772, https://doi.org/10.1186/BF03353235, 1999. a, b
Onohara, A. N., Batista, I. S., and Takahashi, H.: The ultra-fast Kelvin waves in the equatorial ionosphere: observations and modeling, Ann. Geophys., 31, 209–215, https://doi.org/10.5194/angeo-31-209-2013, 2013. a
Paulino, I.: Appearance of Equatorial Plasma bubbles in the OI6300 airglow images, TIB, https://doi.org/10.5446/45230, 2020. a, b, c
Paulino, A. R., Lima, L. M., Almeida, S. L., Batista, P. P., Batista, I. S., Paulino, I., Takahashi, H., and Wrasse, C. M.: Lunar tides in total electron content over Brazil, J. Geophys. Res.-Space, 122, 7519–7529, https://doi.org/10.1002/2017JA024052, 2017. a
Paulino, I., Takahashi, H., Medeiros, A., Wrasse, C., Buriti, R., Sobral, J., and Gobbi, D.: Mesospheric gravity waves and ionospheric plasma bubbles observed during the COPEX campaign, J. Atmos. Sol.-Terr. Phy., 73, 1575–1580, https://doi.org/10.1016/j.jastp.2010.12.004, 2011. a
Paulino, I., Medeiros, A. F., Vadas, S. L., Wrasse, C. M., Takahashi, H., Buriti, R. A., Leite, D., Filgueira, S., Bageston, J. V., Sobral, J. H. A., and Gobbi, D.: Periodic waves in the lower thermosphere observed by OI630 nm airglow images, Ann. Geophys., 34, 293–301, https://doi.org/10.5194/angeo-34-293-2016, 2016. a
Resende, L. C. A., Denardini, C. M., Picanço, G. A. S., Moro, J., Barros, D., Figueiredo, C. A. O. B., and Silva, R. P.: On developing a new ionospheric plasma index for Brazilian equatorial F region irregularities, Ann. Geophys., 37, 807–818, https://doi.org/10.5194/angeo-37-807-2019, 2019. a
Saito, S. and Maruyama, T.: Effects of transequatorial thermospheric wind on plasma bubble occurrences, Journal of the National Institute of Information and Communications Technology, 56, 257–266, 2009. a
Stening, R. J. and Fejer, B. G.: Lunar tide in the equatorial F region vertical ion drift velocity, J. Geophys. Res.-Space, 106, 221–226, https://doi.org/10.1029/2000JA000175, 2001. a, b, c, d
Takahashi, H., Wrasse, C. M., Pancheva, D., Abdu, M. A., Batista, I. S., Lima, L. M., Batista, P. P., Clemesha, B. R., and Shiokawa, K.: Signatures of 3–6 day planetary waves in the equatorial mesosphere and ionosphere, Ann. Geophys., 24, 3343–3350, https://doi.org/10.5194/angeo-24-3343-2006, 2006. a
Takahashi, H., Taylor, M. J., Pautet, P.-D., Medeiros, A. F., Gobbi, D., Wrasse, C. M., Fechine, J., Abdu, M. A., Batista, I. S., Paula, E., Sobral, J. H. A., Arruda, D., Vadas, S. L., Sabbas, F. S., and Fritts, D. C.: Simultaneous observation of ionospheric plasma bubbles and mesospheric gravity waves during the SpreadFEx Campaign, Ann. Geophys., 27, 1477–1487, https://doi.org/10.5194/angeo-27-1477-2009, 2009. a
Taori, A., Patra, A. K., and Joshi, L. M.: Gravity wave seeding of equatorial plasma bubbles: An investigation with simultaneous F region, E region, and middle atmospheric measurements, J. Geophys. Res.-Space, 116, A05310, https://doi.org/10.1029/2010JA016229, 2011. a
Tsunoda, R. T., Saito, S., and Nguyen, T. T.: Post-sunset rise of equatorial F layer – or upwelling growth?, Progress in Earth and Planetary Science, 5, 22, https://doi.org/10.1186/s40645-018-0179-4, 2018. a
Zhu, Z., Luo, W., Lan, J., and Chang, S.: Features of 3–7-day planetary-wave-type oscillations in F-layer vertical drift and equatorial spread F observed over two low-latitude stations in China, Ann. Geophys., 35, 763–776, https://doi.org/10.5194/angeo-35-763-2017, 2017. a