the Creative Commons Attribution 4.0 License.
the Creative Commons Attribution 4.0 License.
 | 26 Mar 2020
Statistical analysis of the long-range transport of the 2015 Calbuco volcanic plume from ground-based and space-borne observations
Nelson Bègue
Lerato Shikwambana
Hassan Bencherif
Juan Pallotta
Venkataraman Sivakumar
Elian Wolfram
Nkanyiso Mbatha
Facundo Orte
David Jean Du Preez
Marion Ranaivombola
Stuart Piketh
Paola Formenti
This study investigates the influence of the 2015 Calbuco eruption (41.2∘ S, 72.4∘ W; Chile) on the total columnar aerosol optical properties over the Southern Hemisphere. The well-known technic of sun photometry was applied for the investigation of the transport and spatio-temporal evolution of the optical properties of the volcanic plume. The CIMEL sun photometer measurements performed at six South American and three African sites were statistically analysed. This study involves the use of the satellite observations and a back-trajectory model. The passage of the Calbuco plume is statistically detectable in the aerosol optical depth (AOD) observations obtained from sun photometer and MODIS observations. This statistical detection confirms that the majority of the plume was transported over the northeastern parts of South America and reached the South African region 1 week after the eruption. The plume impacted the southern parts of South America to a lesser extent. The highest AOD anomalies were observed over the northeastern parts of South America. Over the South African sites, the AOD anomalies induced by the spread of the plume were quite homogeneously distributed between the east and west coasts. The optical characteristics of the plume near the source region were consistent with an ash-bearing plume. Conversely, sites further from the Calbuco volcano were influenced by ash-free plume. The optical properties discussed in this paper will be used as inputs for numerical models for further investigation of the ageing of the Calbuco plume in a forthcoming study.
- Article
(18613 KB) - Full-text XML
- BibTeX
- EndNote


Given that major volcanic eruptions have the potential to inject large amounts of sulfur into the stratosphere, they are considered to be one of the main sources of stratospheric sulfur (Carn et al., 2015; Thomason et al., 2007). Sulfate aerosols are formed in the volcanic plume by the aqueous and gaseous oxidation of sulfur dioxide (SO2) and the subsequent nucleation and accumulation of particles and droplets (Watson and Oppenheimer, 2000). Thus, volcanic emissions may have a significant impact on the atmospheric composition and radiative budget (McCormick et al., 1995; Solomon et al., 1999, 2011). McCormick et al. (1995) showed that the increased aerosol loading following a major volcanic eruption can lead to significant warming of the middle atmosphere. For instance, a warming ranging from 1 to 4 ∘C was observed in the tropical stratosphere following the Pinatubo eruption in 1991 (Labitzke and McCormick et al., 1992; Young et al., 1994). Using ground-based and satellite observations, various studies have shown that a significant ozone loss occurs following a major volcanic eruption (Hofmann and Oltmans, 1993; Solomon et al., 2005). The sulfate aerosols formed following these events provide surfaces for heterogeneous chemical reactions, which lead to ozone depletion (Tie and Brasseur, 1995; Solomon et al., 1996; Bekki et al., 1997).
Previous studies have also pointed out that moderate volcanic eruptions (i.e. a volcanic explosive index between 3 and 5) can significantly modulate the stratospheric aerosol loading compared with the “background period” (i.e. free of the effects of a major volcanic eruption) (Haywood et al., 2010; Neely III et al., 2013). Both ground-based (Hofmann et al., 2009; Trickl et al., 2013; Zuev et al., 2017) and satellite (Vanhellemont et al., 2010; Vernier et al., 2011) observations suggest that the aerosol optical depth (AOD) of the stratospheric aerosol layer between 20 and 30 km has increased by 4 %–10 % yr−1 since 2000. Using the Whole Atmosphere Community Climate Model (WACCM, version 3), Neely III et al. (2013) showed that the increase in the AOD of the stratospheric aerosol layer is likely due to moderate volcanic eruptions. Satellite observations confirm that the decadal increase in stratospheric aerosol loadings are linked to a series of moderate volcanic eruptions that each injected around a megaton of SO2 into the lower stratosphere (Vernier et al., 2011). In spite of the fact that these recurrent volcanic eruptions inject less SO2 than major volcanic eruptions, they can impact the atmospheric radiation budget. Furthermore, taking the stratospheric aerosol burden into account in climate models has been shown to be necessary, as their presence can act as a significant counterbalance to global warming: the so called global warming hiatus (Solomon et al., 2011; Fyfe et al., 2013; Haywood et al., 2013; Ridley et al., 2014; Santer et al., 2014). The use of the Canadian Earth System Model (CanESM2), Fyfe et al. (2013) revealed that the moderate volcanic activity since 2000 has contributed to a reduction in global warming with an impact of K. Based on the use of the HadGEM2-ES coupled atmosphere–ocean Earth system model, Haywood et al. (2013) showed a global mean cooling of around −0.02 to −0.03 K over the period from 2008 to 2012. They showed that the eruptions may result the perceived hiatus in global temperatures that is caused by the small cooling effect, but they do not appear to be the primary cause. These previous studies highlight the importance of the stratospheric aerosol burden in climate models and emphasize the need to pursue the analysis of the moderate volcanic activity.
Moderate volcanic eruptions are considered to be the most influential events with respect to the stratospheric aerosol burden over the last decade. These moderate eruptions have mainly been observed in the Northern Hemisphere (Bourassa et al., 2010; Clarisse et al., 2012; Jégou et al., 2013; Kravitz et al. 2010; Sawamura et al., 2012). The Southern Hemisphere, in comparison, has primarily been affected by three moderate eruptions since 2010: (1) the Puyehue–Cordón Caulle (40.3∘ S, 72.1∘ W; Chile) in June 2011, which emitted 0.2 Tg of SO2 into the upper troposphere and lower stratosphere (UTLS; Clarisse et al., 2013; Theys et al., 2013; Koffman et al., 2017); (2) the Kelud eruption (7.5∘ S, 112.2∘ E; Indonesia) in February 2014, which injected 0.1–0.2 Tg of SO2 into the stratosphere (Kristiansen et al., 2015; Vernier et al., 2016); and (3) the Calbuco eruption (41.2∘ S, 72.4∘ W) in April 2015, which released 0.2–0.4 Tg into the UTLS (Bègue et al., 2017; Reckziegel et al., 2016; Mills et al., 2016). The amounts of SO2 injected during these events are smaller than those injected during the moderate eruptions that occurred in the Northern Hemisphere. For instance, the estimation of SO2 reported for these three moderate eruptions are 10–20 times smaller than the Nabro eruption (13.4∘ N, 41.7∘ E; Eritrea) in June 2011 (Bourassa et al., 2012; Sawamura et al; 2012) and a quarter of the amount emitted by the Sarychev eruption (48.1∘ N, 153.2∘ E; the Kuril Islands) in June 2009 (Clarisse et al., 2012; Kravitz et al., 2011; Jégou et al., 2013). This present study focuses on the analysis of the Calbuco eruption.
After 43 years of inactivity, the Calbuco volcano in Chile erupted on the 22 April 2015 followed by two intense explosive events recorded during the same week. The volcanic plume spread extensively in the Southern Hemisphere, which was explained by the dynamical context (Bègue et al., 2017). Using the advected potential vorticity fields derived for the 400 K isentropic level from MIMOSA (Modèle Isentropique de transport Mésoéchelle de transport de l'Ozone Stratospherique par Advection) and the Dynamical BArrier Location model (DyBAL; Portafaix et al., 2003), Bègue et al. (2017) showed that volcanic aerosols are predominantly transported eastward in planetary-scale tongues. The transport of the volcanic aerosol plume was modulated by the location of the subtropical barrier and the polar vortex, within which most of the zonal transport took place during the first week following the eruption (Bègue et al., 2017). During the same year, the Antarctic ozone hole reached a historical record daily average size in October. The influence of the Calbuco eruption on this significant Antarctic ozone depletion has been debated. Using the Specified Dynamics–Whole Atmosphere Community Climate Model (SD-WACCM) and balloon observations at Syowa (69.1∘ S, 34.6∘ E), Solomon et al. (2016) found that the Calbuco eruption might have been responsible for the extreme ozone depletion recorded over Antarctic in October 2015. Using the WACCM model in its free-running configuration, previous works have also revealed significant Antarctic ozone column losses following the moderate Calbuco eruption (Solomon et al., 2016; Ivy et al., 2017). Based on the use of the WACCM model and balloon observations at Syowa, the South Pole, and Neumayer-Station III (70.4∘ S, 8.2∘ W), Stone et al. (2017) confirmed the assumption that enhanced ozone depletion was mainly due to Calbuco aerosols. Particularly, these stratospheric volcanic aerosols greatly enhanced austral ozone depletion at 100–150 hPa between 55 and 68∘ S (Stone et al., 2017). More recently, Zhu et al. (2018) showed that the Calbuco aerosols depleted around 25 % of ozone near 70∘ S and created an additional 2.4×10⁶ km2 of ozone hole area in September 2015 (using the WACCM model). Conversely, Zuev et al. (2018) supports the assumption that the stratospheric volcanic aerosols from the moderate-magnitude eruption of Calbuco could not have contributed to the intensification of ozone depletion. By combining the ERA-Interim reanalysis data and the Hybrid Single Particle Lagrangian Integrated Trajectory (HYSPLIT) model, it was found that the volcanic plume was outside the stable polar vortex. Zuev et al. (2018) concluded that the cause of the abnormal stratospheric ozone depletion above the Antarctic during October and November was the behaviour of the polar vortex in that period. Through the analysis of the zonal average backscattering from CALIOP, Zhu et al. (2018) showed that the Calbuco aerosols progressed 16 km toward the South Pole during June. Moreover, Bègue et al. (2017) discussed the meridional spread of the Calbuco aerosols toward the South Pole, which was modulated by the Quasi-Biennial Oscillation.
The present paper reports on the sun photometry observations of the Calbuco plume at six South American and three African sites. The geographical location of these sites is helpful for improving the discussion on the latitudinal distribution of the Calbuco plume. Following the Puyehue–Cordón Caulle eruption, an effort was made to deploy the CIMEL sun photometer system over Argentina in order to detect aerosols from volcanic ash and Patagonian dust (Otero et al., 2015). These new databases, which have been integrated into the Aerosol RObotic NETwork (AERONET) global network since 2012 and 2013, will be used and analysed in this study. The usefulness of sun photometry measurements in the investigation of aerosols from major and moderate eruptions has been reported in many previous works (e.g. Hobbs et al., 1982; Gooding et al., 1983; Deshler et al., 1992; Watson and Oppenheimer, 2000, 2001; Porter et al., 2002; Mather et al., 2004; Sellitto et al., 2017, 2018). Most of these previous studies reported on the investigation of optical properties in young volcanic plumes near the source regions. The aim of this study is to quantify the influence of the Calbuco plume on the total columnar aerosols and to discuss the spatio-temporal evolution of the optical properties of the volcanic plume during its transport.
The paper is organized as follows: Sect. 2 describes the observations and the statistical approach used to investigate the transport and the optical characteristics of the plume; a description of the transport of the Calbuco plume is given in Sect. 3; the statistical detection of the volcanic plume and its contribution to total columnar aerosols are provided in Sect. 4; a discussion of the spatio-temporal evolution of the optical properties of the volcanic plume during its transport is presented in Sect. 5; and a summary and the perspectives of this study are given in Sect. 6.
2.1 Aerosols and sulfur dioxide observations
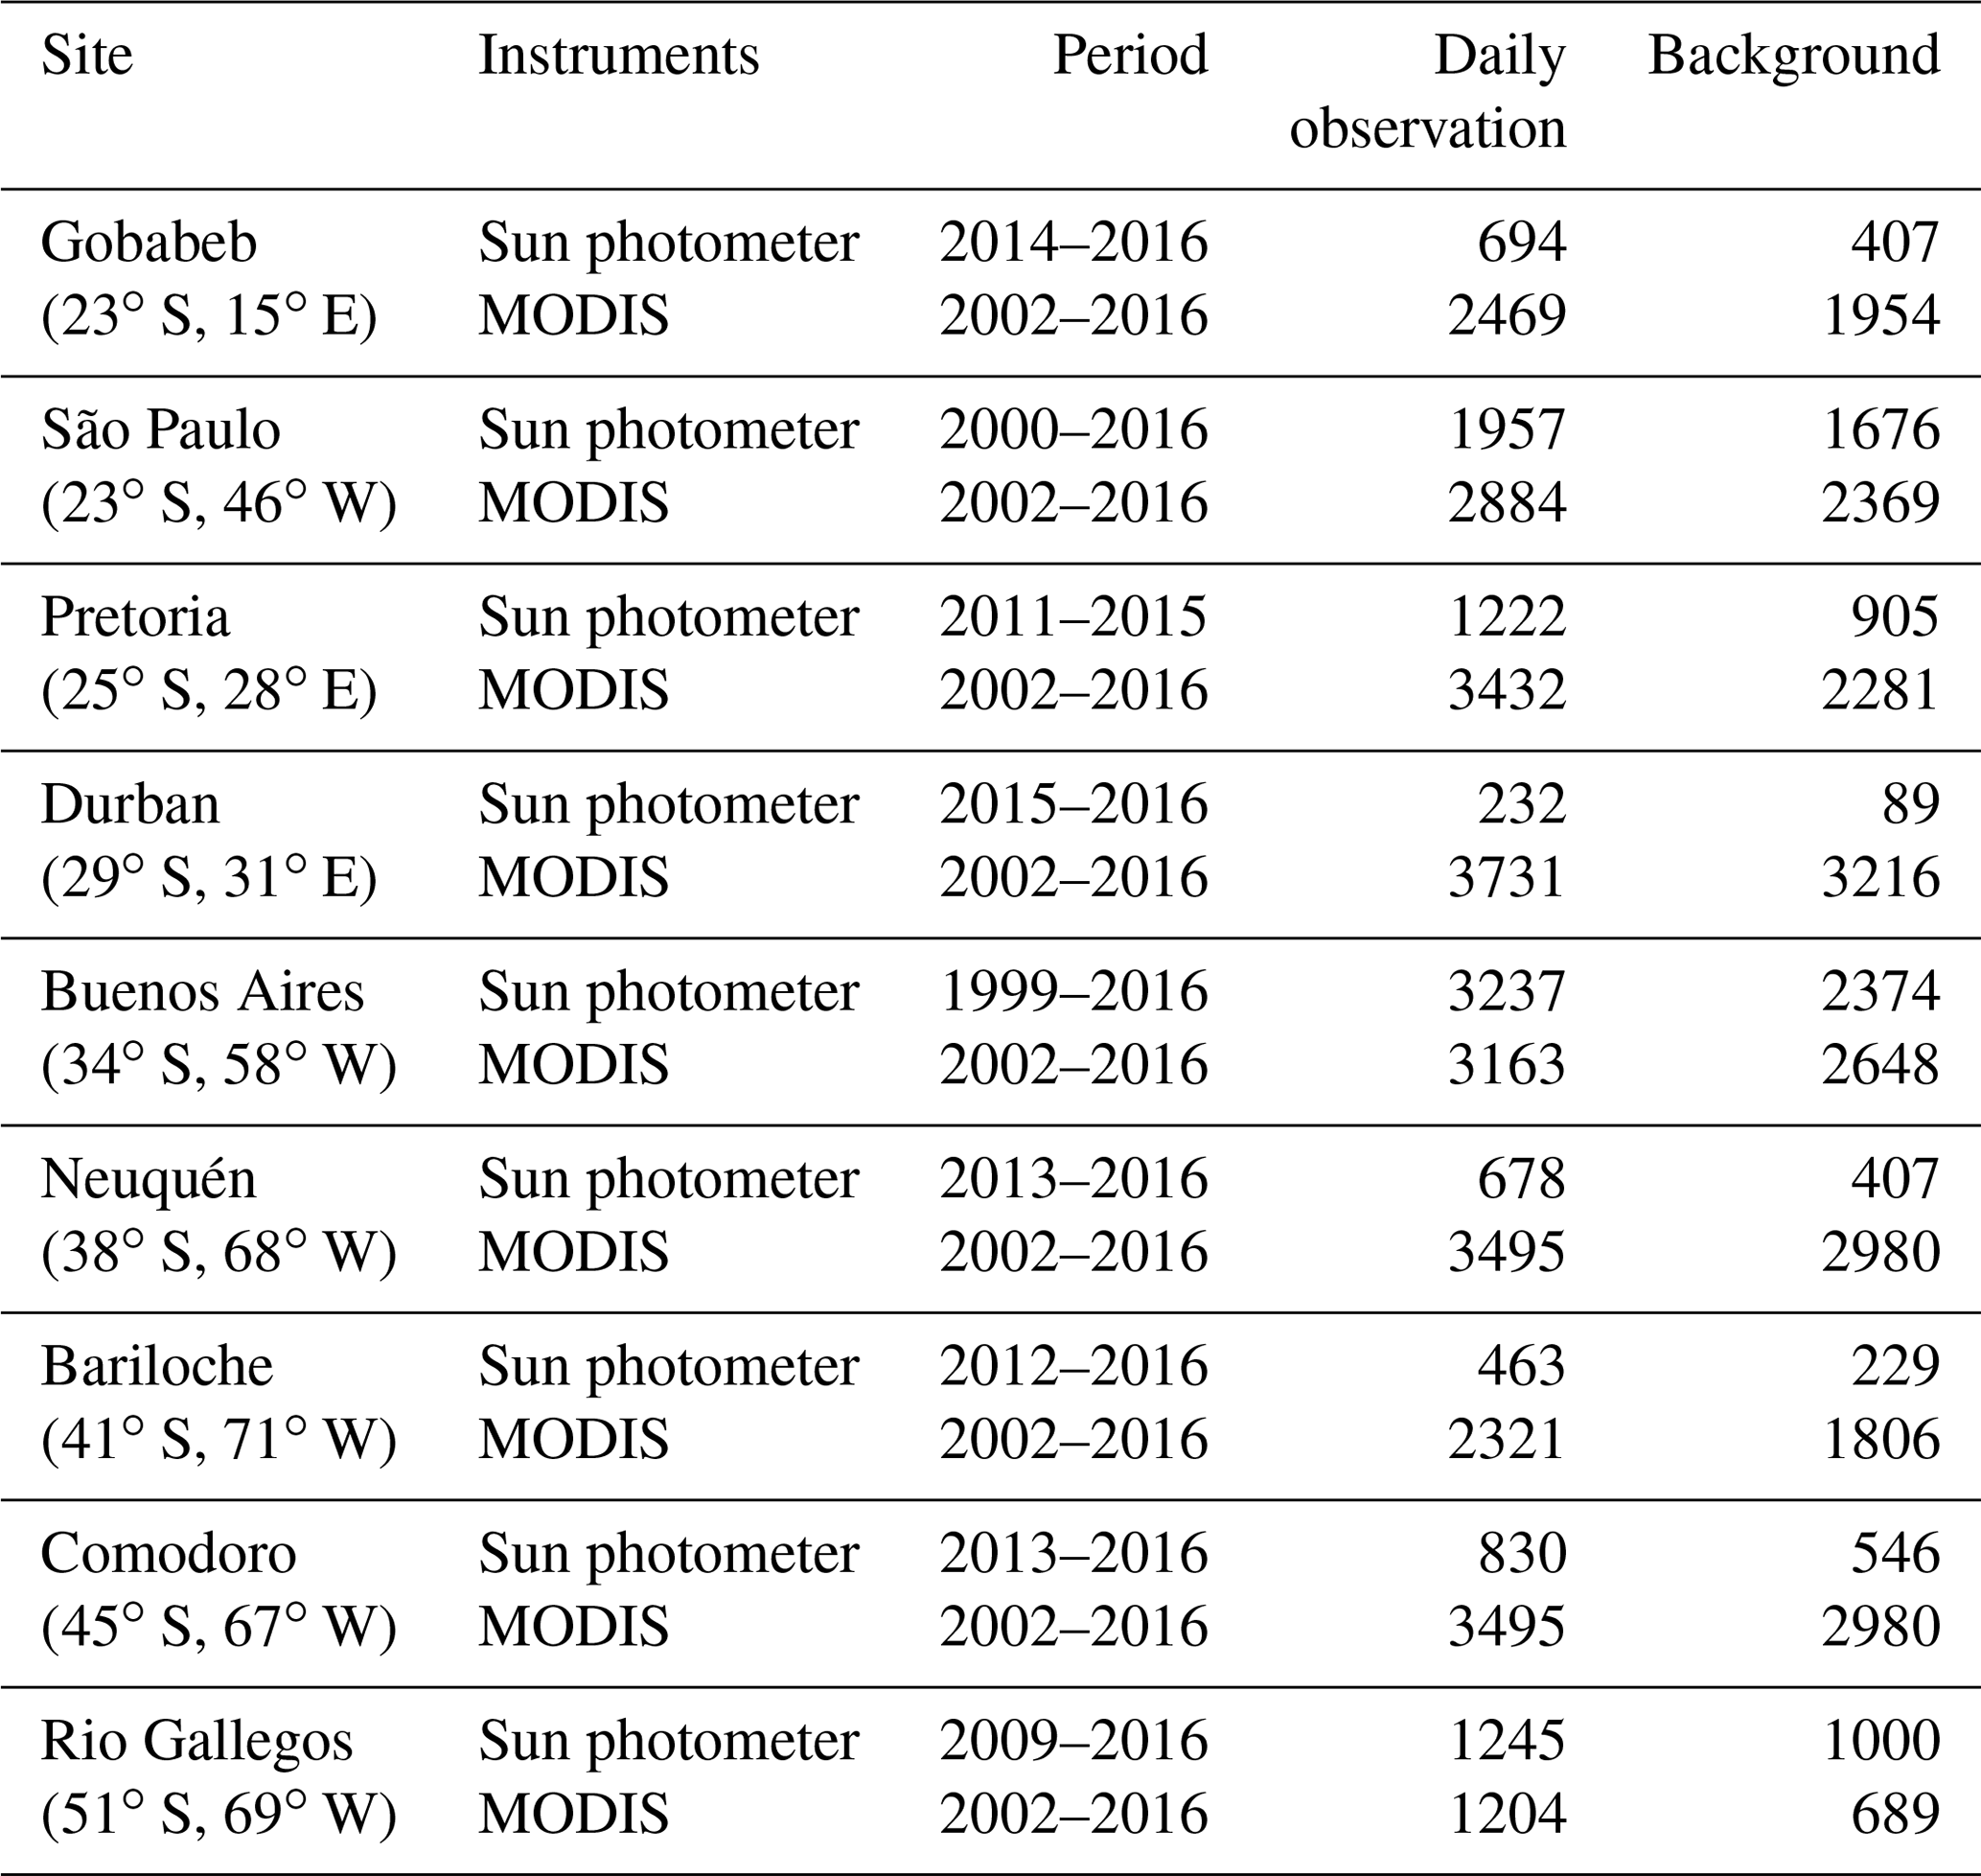
The ground-based sites selected for the analysis of the transport and the optical characteristics of the volcanic plume include nine AERONET sites in South America and southern Africa: São Paulo (23.3∘ S, 46.4∘ W), Gobabeb (23.3∘ S, 15.0∘ E), Pretoria (25.4∘ S, 28.1∘ E), Durban (29.5∘ S, 31.0∘ E), Buenos Aires (34.4∘ S, 58.2∘ W), Neuquén (38.5∘ S, 68 ∘ W), Bariloche (41.0∘ S, 71.2∘ W), Comodoro (45.5∘ S, 67.2∘ W), and Rio Gallegos (51.3∘ S, 69.1∘ W). The location of these sites in the Southern Hemisphere allows for a large-scale view of the transport of the volcanic aerosol plume. Measurements are obtained at 15 min intervals under cloud-free and daytime conditions. The direct solar extinction and diffuse sky radiance measurements are used to compute the AOD and to the retrieve the aerosol size distribution, using the methodology of Dubovik and King (2000). The estimated uncertainty in the AOD measurements under cloud-free conditions ranges from 0.01 to 0.02 (Dubovik et al., 2000, 2006; Eck et al., 2003, 2005). A detailed description of the CIMEL sun photometer, the AERONET network, and the associated data retrieval is given by Holben et al. (1998). The AOD values presented in this work are selected at Level 2.0 (cloud-screened and quality assured) and were downloaded from http://aeronet.gsfc.nasa.gov/ (last access: 5 March 2020). All of the available observations performed before the Calbuco eruption until 2016 are also used for this work. The available daily observations and the associated period for each site are reported in Table 1. The number of available daily observations range from 242 to 3495 (Durban and Neuquén respectively) (Table 1). The difference between these sites is mainly due to their activity period. It is worthwhile mentioning that measurements were made quasi-continuously at each site during the period selected for this study.
Table 1Number of available and background daily observations at each site for both the sun photometer and MODIS.
During the eruption, lidar measurements were also performed at the Bariloche site, which is the closest site to the Calbuco volcano (less than 90 km). The lidar installed at the San Carlos de Bariloche Airport uses a Nd : YAG laser emission system based on a Quantel Brilliant B 20 Hz laser, with 366 mJ at 1064 nm (Ristori et al., 2018). The collection of the backscattered photons is carried out with a 20 cm Cassegrain telescope connected to a spectrometric box via an optical fibre. The system can detect three elastics lines (355, 532, and 1064 nm), two Raman lines (387 and 607 nm), and water vapour (at 408 nm). In this study, elastic lidar signals from 532 nm were processed to retrieve the extinction profile (Fernald, 1984). The Klett–Fernald–Sassano (KFS) method was applied as the inversion algorithm. The analytical solution obtained using the KFS method assumes a constant relation between the extinction-to-backscattering profiles – referred to as the lidar ratio (LR) – which is a key point of this method. The LR value is obtained from the values reported in the literature (Trickl et al., 2013; Ridley et al., 2014; Sakai et al., 2016), which are associated with the nature of the aerosols, or iteratively using a reference AOD given by the sun photometer. In this study, we used the AOD given by the sun photometer deployed at the Bariloche site. Another parameter that we need to retrieve the optical properties is the altitude reference, which corresponds to the altitude without an aerosol load. The statistical uncertainties of the optical products are calculated based on the Monte Carlo method (D'Amico et al., 2016), which is widely used in EARLINET (the European Aerosol Research LIdar NETwork). The systematic errors related to the inversion method mainly stem from the input parameters: the LR and the altitude reference values. On average, the error related to the altitude reference is 15 %, and the error related to the LR is around 20 %.
The Moderate Resolution Imaging Spectroradiometer (MODIS) is an instrument aboard the Earth observation system (EOS) Terra (EOS AM) and Aqua (EOS PM) satellites. The orbit of Terra is timed so that it passes over the Equator from north to south in the morning. The orbit of Aqua is timed so that it passes over the Equator from north to south in the afternoon. MODIS provides radiance measurements in 36 spectral bands between 0.44 and 15 µm, with different spatial resolutions: 250 m (bands 1 and 2), 500 m (bands 3–7), and 1 km (bands 8–36) (Bennouna et al., 2013). MODIS aerosols retrievals are carried out separately over land and ocean using two independent algorithms (Bennouna et al., 2013). Numerous works such as Kharol et al. (2011), El-Metwally et al. (2010), and Baddock et al. (2009) have presented a comprehensive description of the Terra MODIS and have also outlined its operation. In this study, the MODIS data aboard the Terra (EOS AM) satellite were used: https://giovanni.gsfc.nasa.gov/giovanni/ (last access: 10 January 2020). The MODIS AOD data utilized in this work were collected for the 2002–2016 period over an (latitude and longitude) area centred on each site in order to analyse local and regional aerosol loadings. We only used high-resolution MODIS retrievals with very good quality flags to generate AOD statistics over these regions. Taking the previously mentioned conditions into account, the number of available daily observations ranged from 1204 to 3731 (at Rio Gallegos and Durban respectively; Table 1).
The Cloud-Aerosol Lidar with Orthogonal Polarization (CALIOP) instrument onboard the Cloud-Aerosol Lidar and Infrared Pathfinder Satellite Observation (CALIPSO) satellite was used to study the transport of the Calbuco plume. CALIPSO has flown in a sun-synchronous polar orbit since 2006 with a cycle of 16 d (Winker et al., 2009). In addition to CALIOP, CALIPSO is composed of two other instruments: (i) the Imaging Infrared Radiometer (IIR) and (ii) the Wide Field Camera (WFC). CALIOP is an elastically backscattered lidar operating at 532 and 1064 nm, equipped with a depolarization channel at 532 nm. Moreover, CALIOP can be categorized into two product levels: level 1 and level 2. The level 1 products are made up of calibrated and geolocated profiles of the attenuated backscatter returned signal. Level 2 products, in comparison, are derived from level 1 products and are classified in three types: profile, vertical feature mask, and layer products (Lopes et al., 2012). Layer products provide layer-averaged properties of detected aerosol and cloud. Profile products provide retrieved extinction and backscatter profiles within these layers. The data products are provided at various spatial resolutions. A detailed description of CALIPSO is given in Winker et al. (2009, 2010, 2013). In this work, the analysis of the 532 nm aerosol extinction coefficient data product for the period from 23 April to 3 May 2015 was used for the identification of volcanic plumes on the respective days of observation.
The Ozone Monitoring Instrument (OMI) data product OMSO2G is also used to analyse the transport of the SO2 plume from the source region to South Africa. OMI is a nadir-viewing spectrometer that has been operating aboard the National Aeronautics and Space Administration (NASA) EOS AURA satellite since July 2004. The AURA satellite occupies a near polar sun-synchronous orbit at an altitude of 705 km (Krotov et al., 2016). A full technical description of the OMI data product is given in the OMI Algorithm Theoretical Basis Documents (Barthia et al., 2002). The OMSO2G products used in this work are selected at Level 2.0, version 3, and are accessible from http://disc.sci.gsfc.nasa.gov/Aura/data-holdings/OMI/ (last access: 15 January 2020). The OMSO2G products are obtained from reflected solar radiation measured in spectral range from 310 to 340 nm. The data used in this work are reprocessed with the new algorithm based on principal component analysis (PCA; Li et al., 2013), which reduces the retrieval noise by 50 % compared with the previous version. The OMSO2G products are available for four vertical distributions in a sampling grid of with respect to latitude and longitude (Krotov et al., 2016). The stratospheric layer (STL) data set is used for this investigation. Earlier works have reported that this data set is suitable for studying volcanic eruptions (Sangeetha et al., 2018; Li et al., 2013; Krotov et al., 2016). The estimated uncertainty in SO2 values under cloud-free conditions for the four vertical distributions ranges from 0.1 to 0.4 DU and from 0.7 to 0.9 DU at equatorial and high latitudes respectively.
2.2 Back-trajectory model: HYSPLIT
The HYSPLIT model was used to calculate backward and forward trajectories in order to derive information on the transport of the volcanic aerosol plume. The National Oceanic and Atmospheric Administration (NOAA) Air Resource Laboratory (ARL) developed the HYSPLIT model that is currently used for computing simple and complex air parcel trajectories (Draxler and Rolph, 2003; Stein et al., 2015). The model can also provide information regarding the dispersion, chemical transformation, and deposition simulations of pollutants. The ability of HYSPLIT to derive information on the atmospheric transport, dispersion, and deposition of pollutants and volcanic ash has been highlighted in several studies (Stunder et al., 2007; Chen et al., 2012; Kumar et al., 2017; Sangeetha et al., 2018; Lopes et al., 2019; Shikwambana and Sivakumar, 2019). A detailed description and the historical evolution of the model is given by Stein et al. (2015) and is briefly presented here. The calculation of the trajectories is based on a hybrid method between the Lagrangian and Eulerian approaches (Stein et al., 2015). In order to reduce the uncertainties induced by the meteorological fields and the numerical methods employed, HYSPLIT can be run in the trajectory clustering mode. The concept of clustering is a multivariate statistical method that consists of merging the trajectories that are closer to each other and classifying them into distinct groups. In the present work, the back-trajectory calculations were helpful to determine if the measured AOD values over the selected sites were associated with air masses that originated from the Calbuco volcano. The back-trajectories of air masses were calculated every 6 h over the selected sites using the Global Data Assimilation System (GDAS) database for altitudes ranging from 16 to 19 km. The back-trajectory calculations were performed using the vertical motion calculation method.
2.3 Methodology
The characteristics of the optical properties of the volcanic plume were analysed using AOD measurements. The AOD measurements are comprised of the volcanic plume AODP and the background values. Thus, the aerosols optical depth of the volcanic plume at a given wavelength AODP (λ) can be obtained by subtracting the background aerosol optical depth AODB (λ) from the AOD (λ) measurements. In previous studies, this methodology has been applied to the Microtops II portable sun photometer measurements taken close to volcano site (Watson and Oppenheimer, 2001; Porter et al., 2002; Mather et al., 2004; Martin et al., 2009; Sellitto et al., 2017, 2018). In this paper, this approach was applied and adapted to CIMEL sun photometer measurements taken at nine sites. To investigate the properties of the volcanic plume, it is important to make background measurements when the atmosphere is clear of volcanic aerosols as well as measurements during an eruption. Given that CIMEL sun photometers are fixed instruments, this requirement is implicitly respected and allows for the definition of a statistically significant background situation. In the present work, the background period is defined as the period before January 2015 and after January 2016. Except for the Durban site, the AODB (λ) calculation is based on an average of 6 years of daily observations (Table 1). The anomalies were filtered out in order to obtain the daily optical depth of the “clear” atmospheric layer. Thus, the calculated daily AODB (λ) means from April to December were assumed to be within the standard deviation of the hourly recorded data. Moreover, the perturbation induced by the Puyehue–Cordón Caulle eruption (40.3∘ S, 72.1∘ W; Chile) (Diaz et al., 2014) on the calculation of the background values was taken into account. As a consequence, the measurements performed during the period from June to October 2011 were discarded from the calculation of the AODB (λ). Taking the above-mentioned conditions into account, the number of observations used for the calculation of the daily AODB (λ) means ranged from 89 to 2489 (Table 1). The uncertainty of the plume AOD (σAODp) is derived using the standard deviation of the AOD (λ) measurement and the standard deviation of the AODB (), as shown by Sellitto et al. (2017). This uncertainty is given by Eq. (1):
where n is the number of individual background measurements (AODB) made to compute the average background.
The spectral variability of the volcanic plume was analysed using the Angström exponent αP and the atmospheric turbidity βP (Angström, 1964). The Angström exponent αP is a well-known optical proxy for the aerosol size distribution (Shaw, 1983; Tomasi et al., 1997). The Angström exponent αP is generally close to zero or negative for aerosols whose extinction properties are governed by large particles (a mean radius distribution greater than 1 µm). Conversely, αP values greater than 1 are typical of small particles (a mean radius distribution less than 1 µm). The Angström turbidity βP is the best-fit value of AODP (λ) at 1 µm, which depends on the total number and refractive index of aerosol particles. In this work, the optical properties of the volcanic plume were analysed at three selected wavelength bands that correspond to ultraviolet (UV, 380 nm), visible (Vis, 500 nm), and near-infrared (NIR, 1020 nm). Previous works revealed that observations at UV wavelengths are helpful for the characterization of the optical and microphysical properties of the volcanic plume (Porter et al., 2002; Mather et al., 2004; Sellitto et al., 2017). The Angström exponent αP and turbidity βP of the volcanic plume are calculated at a specific wavelength pair, 380–1020 nm, given by Eqs. (2) and (3).
As reported by Sellitto et al. (2017), the use of a spectral interval that is as large as possible leads to a decrease in the uncertainties of αP and βP. According to this research, the uncertainties of the derived αP and βP values are calculated as follows:
The spatio-temporal data analysis carried out between MODIS and sun photometer instruments helps both to detect the passage of the volcanic plume and its contribution to the total aerosol column variation over the selected sites. The previously described methodology was applied to the MODIS observations in order to determine the AOD of the volcanic plume AODP-MODIS and the background values AODB-MODIS at 550 nm. MODIS observations are helpful for obtaining a good description of the background behaviour over sites where sampling is not sufficient, such as the Durban site. Table 1 reveals that the MODIS observations used to build the background situation are homogenous between the different sites and range between 689 and 3216 observations. It is necessary to convert the AOD values from MODIS and sun photometer observations to a common wavelength in order to compare them. The AOD values obtained from sun photometer at 500 nm were converted to the MODIS wavelength following Eq. (4), which has been used in previous works (Prasad and Singh, 2007; Alam et al., 2011):
where α is the Angström parameter obtained from sun photometer between 440 and 870 nm.
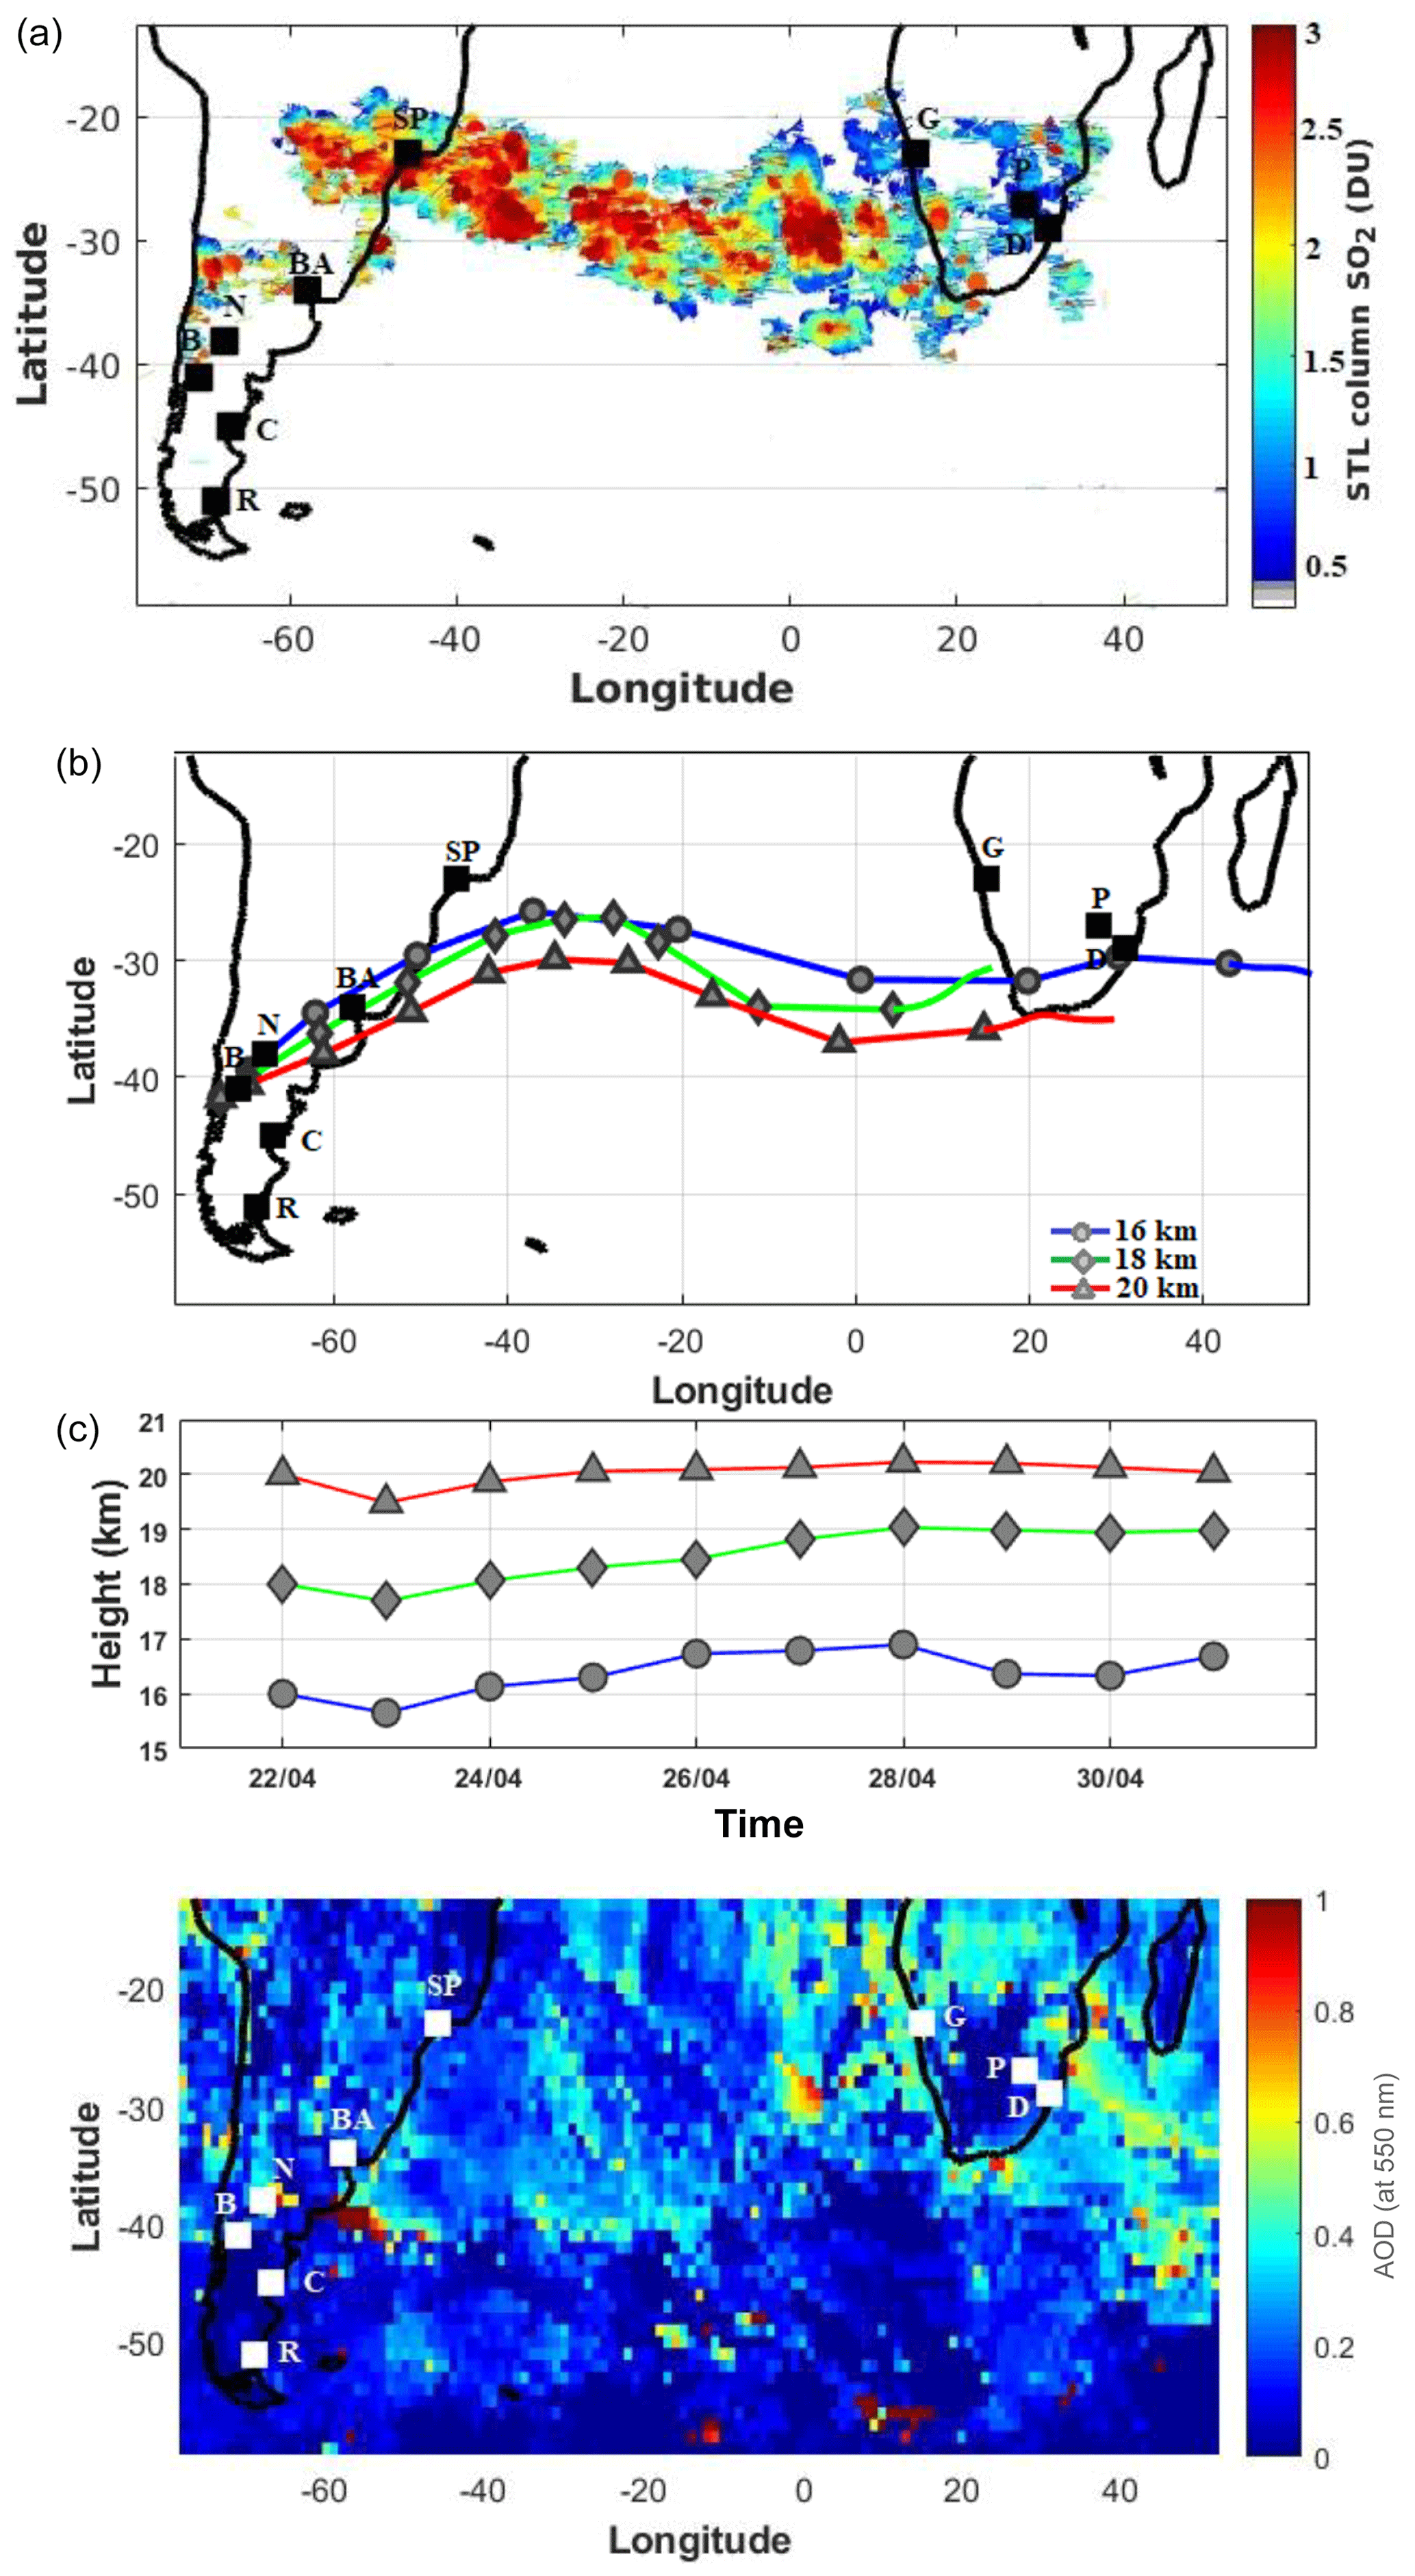
Figure 1(a) A time-averaged map of the SO2 column in the lower stratosphere observed by OMI during the 22 April–1 May period. (b) Forward-trajectory analysis of air masses from the HYSPLIT model starting at the Calbuco volcano coordinates at 16 km (blue line with grey dots), 18 km (green line with grey diamonds), and 20 km (red line with grey triangles). (c) A time-averaged map of MODIS AOD (550 nm) during the 22 April–1 May period. The locations of the selected sites are indicated by black boxes and the site abbreviations: Bariloche (B), Neuquén (N), Buenos Aires (BA), São Paulo (SP), Comodoro (C), Rio Gallegos (R), Gobabeb (G), Durban (D), and Pretoria (P).
Figure 1a depicts a time-averaged map of the OMI STL SO2 column between 22 April and 1 May. It is clearly shown that SO2 injected into the atmosphere is mainly transported northeastward over South America and passes over the São Paulo site. This figure also reveals a lack of SO2 observations over a region spanning from the vicinity of the Calbuco site to the southern parts of Argentina. This blind region obtained from OMI observations has already been reported in previous studies and is the result of a reduced signal-to-noise ratio due to the exposure of the low-orbiting satellite instrumentation to radiation and high-energy particles (Fioletov et al., 2016; Shikwambana and Sivakumar, 2019). Bègue et al. (2017) pointed out the lack of SO2 observations over this same region using Infrared Atmospheric Sounding Interferometer (IASI) measurements. Over South America, the highest SO2 values (2–2.5 DU) are found over southern Brazil and the northern parts of Argentina. It can be observed that the outflow of the SO2 plume towards the Atlantic Ocean is located over the aforementioned region. The plume was transported over the Atlantic Ocean by the general circulation and reached the African region. Large SO2 values (2–3 DU) were mainly observed during the transport of the plume over the South Atlantic. The SO2 plume then entered the western parts of South Africa and spread eastward. Figure 1a reveals that the SO2 plume was transported over South Africa. The observed SO2 values over South Africa are around 3 times weaker than those observed over South America and the Atlantic Ocean. The SO2 plume then progressively moved away, which resulted in a decrease in amplitude: this was to be expected due to the oxidation of SO2 to gaseous sulfuric acid which further condensed into H2SO4–H2O liquid aerosol (Bègue et al., 2017).

Figure 2The daily zonal extinction coefficient values (km−1) at 532 nm observed by CALIOP over the Calbuco volcano and in the vicinity of the São Paulo site (23∘ S, 46∘ W) on (a) 23 April, (b) 24 April, and (c) 26 April. The red star and the blue square correspond to the location of the Calbuco volcano and the maximum extinction values respectively. Back-trajectory analysis between the maximum extinction values and the Calbuco volcano are plotted by the green curve. The CALIPSO overpass trajectories are plotted by the orange curve.
Forward trajectories starting at the Calbuco volcano on 22 April at 14:00 UTC were calculated for a period of 10 d at three different altitudes between 16 and 20 km (Fig. 1b). It is worthwhile mentioning that the trajectories calculated by the HYSPLIT model are in fair agreement with the shape of the SO2 plume obtained from OMI observations for the same period. Figure 1b reveals that the air masses from the Calbuco site leave the South American region on 26 April for the three selected altitudes. It can be observed that the outflow of the air masses from Calbuco towards the Atlantic Ocean is located over southern Brazil and the northern parts of Argentina for the three selected altitudes (Fig. 1b). It is worth noting that this spread of the air masses from Calbuco obtained from the HYSPLIT model is consistent with the spread of the SO2 plume obtained from OMI observations. Over the Atlantic Ocean, the spatio-temporal distribution of the air masses from the Calbuco site depends on the given altitude. The original air masses from the Calbuco site at 16 km reached the southwestern parts of South Africa on 30 April at around 16.5 km. These air masses travelled to the eastern parts of South Africa 1 d later and reached the southwestern Indian Ocean on 1 May at 16.9 km. Conversely, the original air masses from the Calbuco site at 18 and 20 km reached the western and the southern parts of South Africa on 1 May. The trajectory analysis reveals that the air masses from Calbuco are advected eastward and mainly in the Southern Hemisphere. This result is found to be in agreement with previous published results (e.g. Bègue et al., 2017; Shikwambana and Sivakumar, 2018; Zhu et al., 2018). Bègue et al. (2017) showed that the latitudinal extent of the Calbuco plume was bounded by the subtropical barrier and the polar vortex. The air masses from Calbuco were advected between South America and South Africa following the wave shape of the dynamical barriers (Bègue et al., 2017).
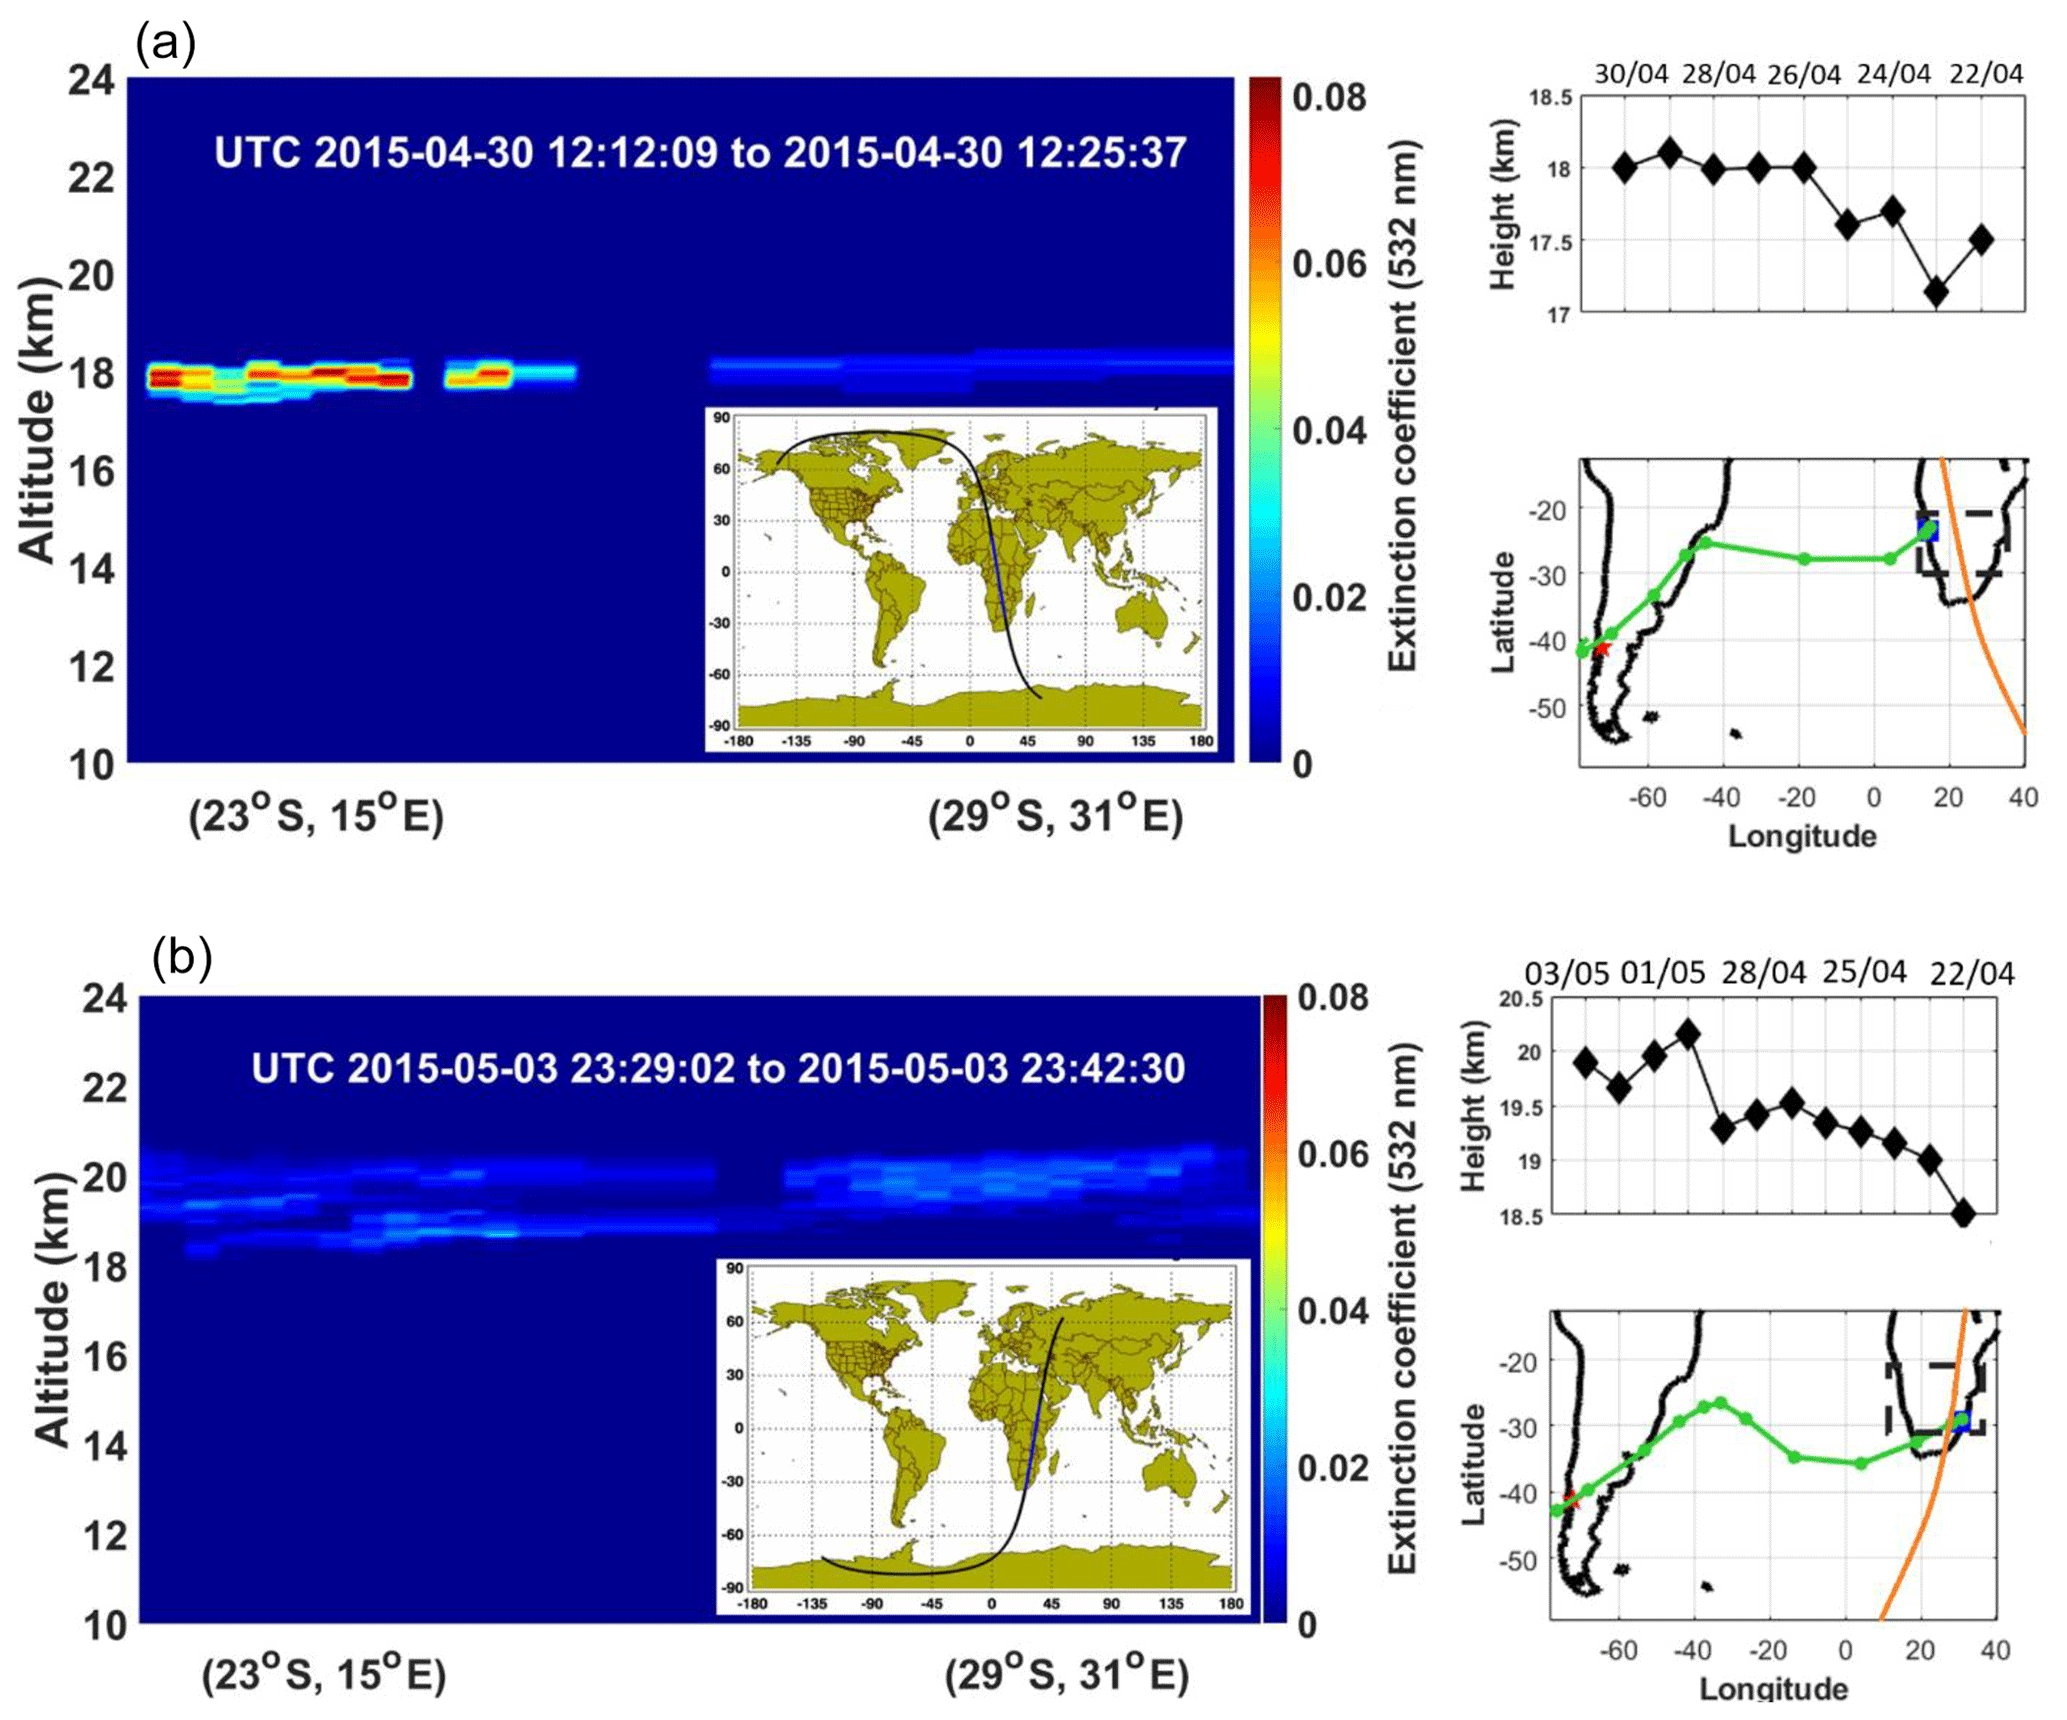
Figure 3Daily zonal extinction coefficient values (km−1) at 532 nm observed by CALIOP over the South African region on (a) 30 April and (b) 3 May. The red star and the blue square correspond to the location of the Calbuco volcano and the maximum extinction values respectively. Back-trajectory analysis between the maximum extinction values and the Calbuco volcano is represented by the green curve. The CALIPSO overpass trajectories are plotted by the orange curve.
Figure 1c shows a time-averaged map of MODIS AOD at 550 nm between 22 April and 1 May. The AOD values coincident with the forward trajectories calculated from the HYSPLIT model could be explained by the presence of the Calbuco plume. Thus, the synergy between the forward trajectories and the MODIS observations allows for the determination of the AOD values associated with the Calbuco eruption. It can be deduced that the large AOD values (0.6–1) mainly observed over the South American region in the vicinity of the Neuquén site are linked to the Calbuco eruption (Fig. 1c). Analysis of the forward trajectories and the MODIS observations also indicate that a large AOD values (0.6–0.8) around to the African region are coincident with the Calbuco plume pathways. Over the Atlantic Ocean, the AOD values associated with the passage of the Calbuco plume range between 0.4 and 0.8.
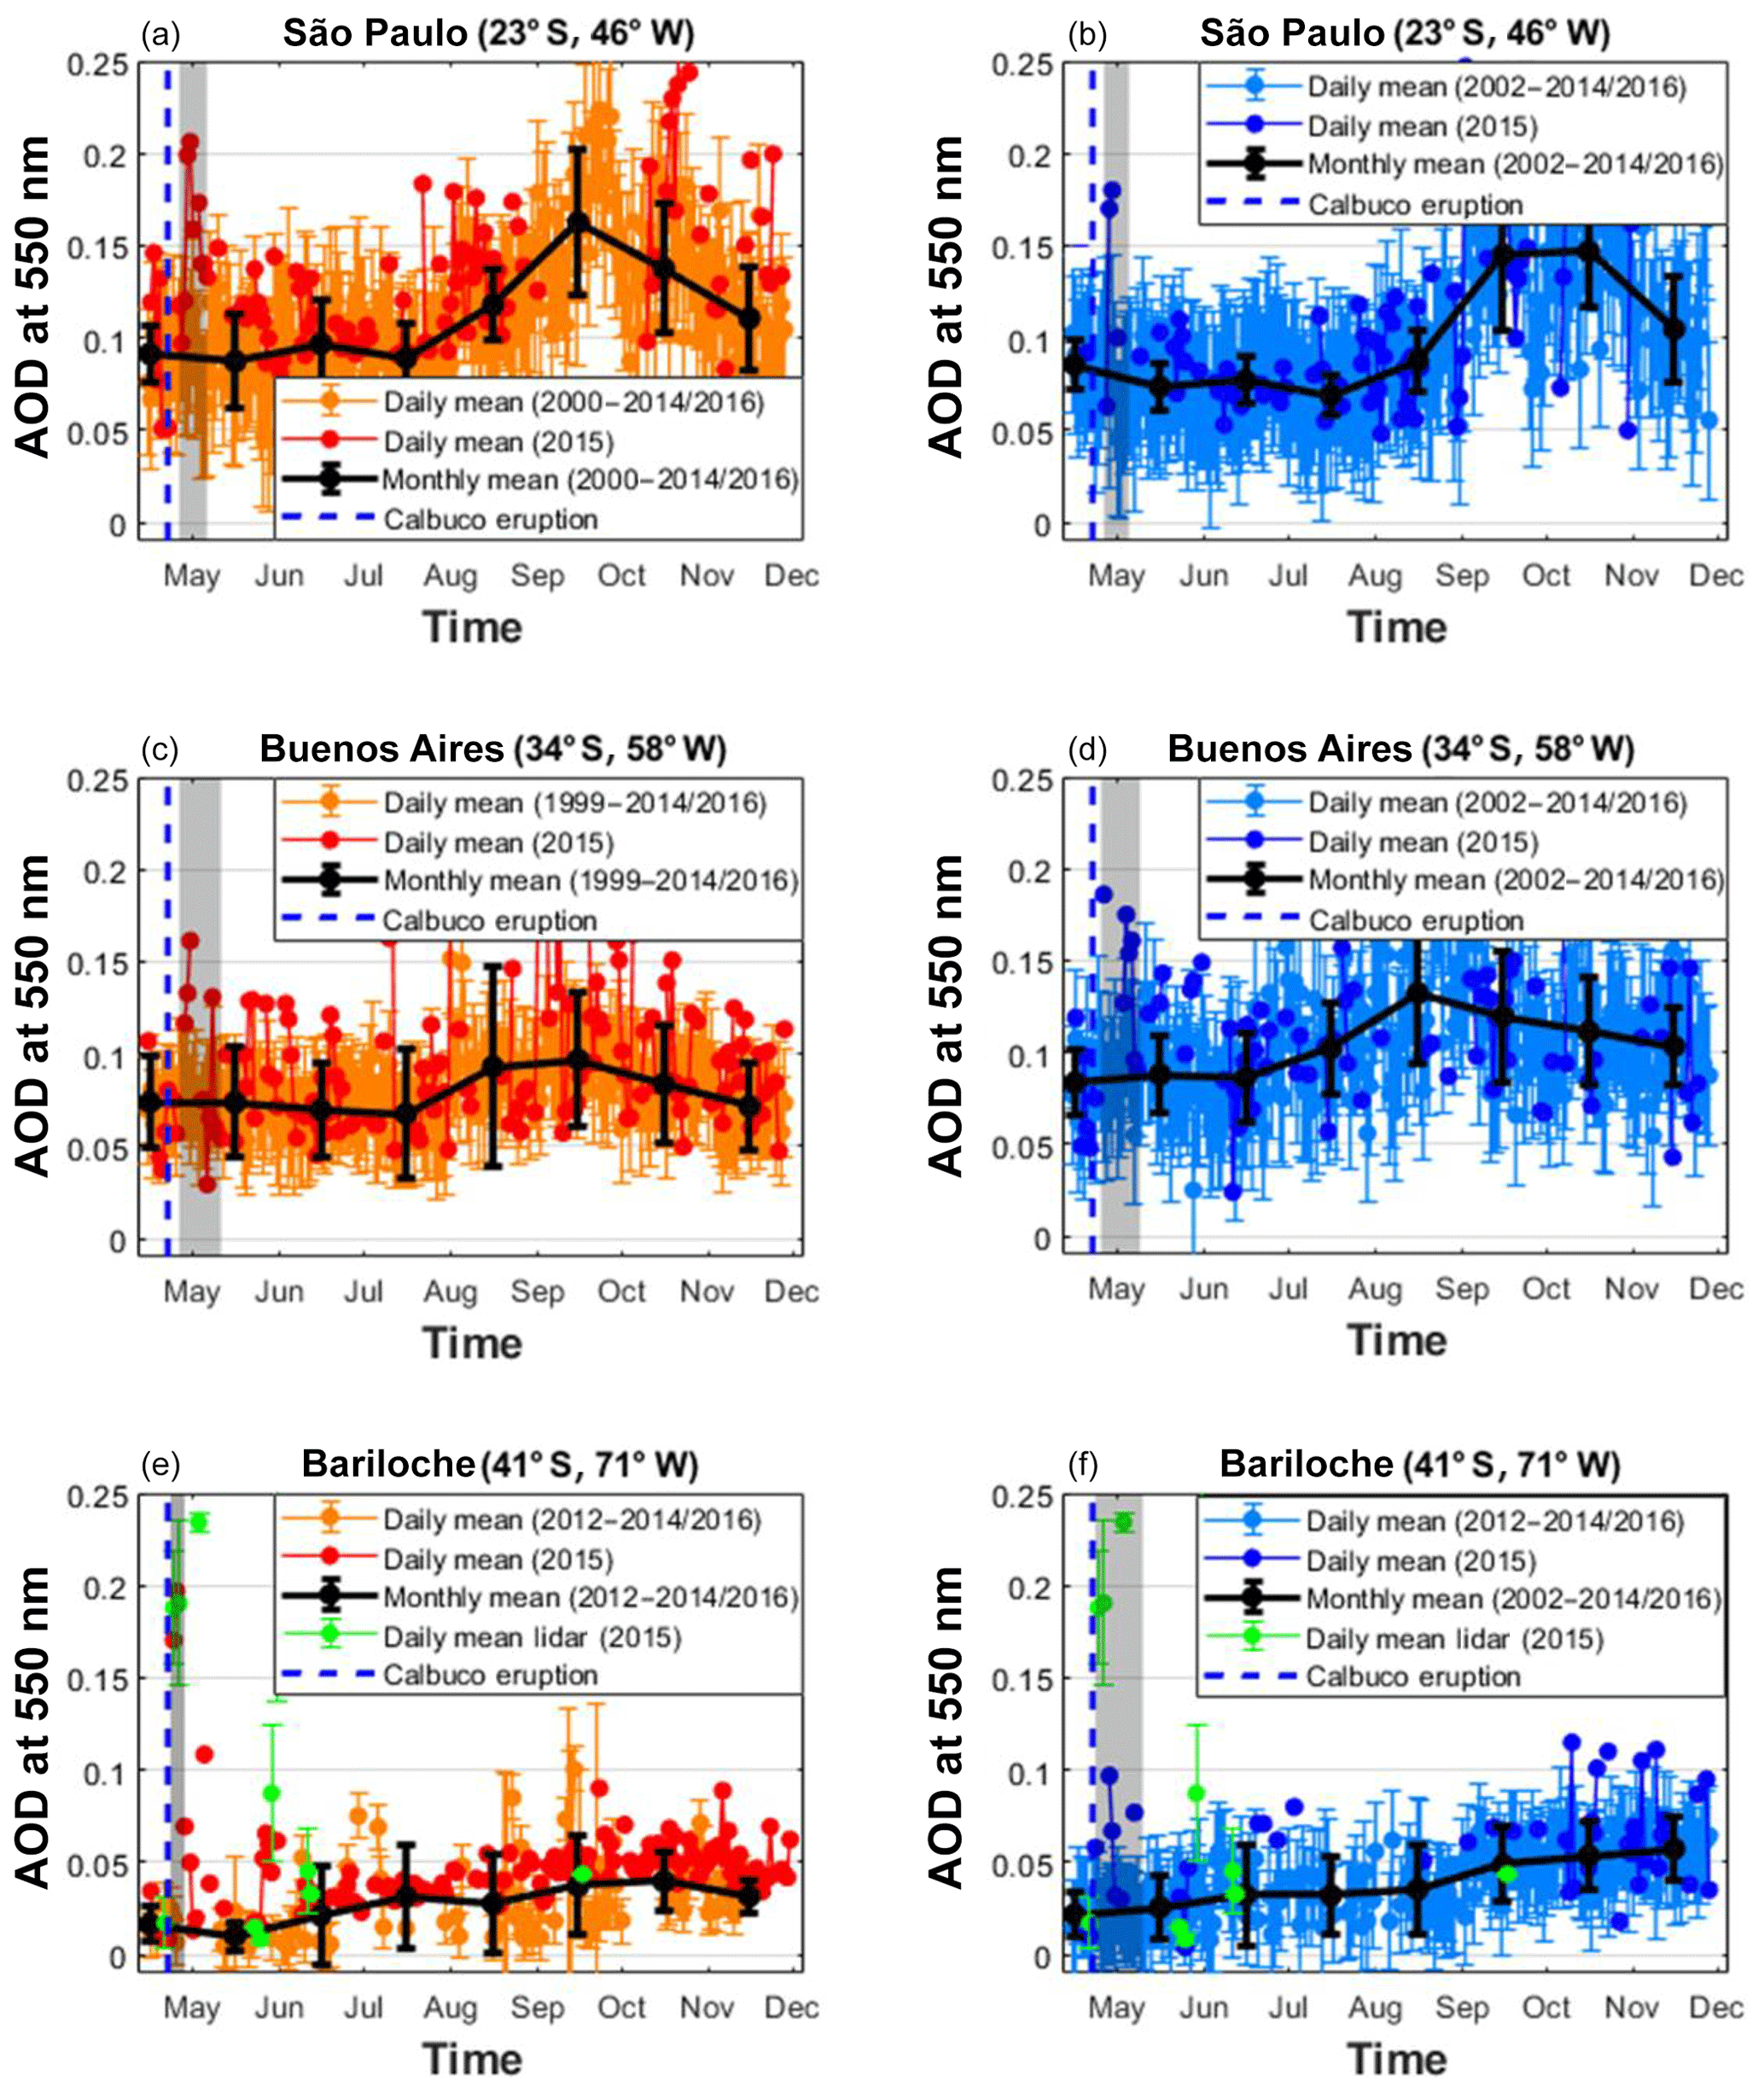
Figure 4Daily mean AOD values (550 nm) obtained over (a, b) São Paulo, (c, d) Buenos Aires, and (e, f) Bariloche from sun photometer and lidar observations (a, c, e) as well as MODIS observations (b, d, f) from 15 April to 1 December. The grey area corresponds to the influence of the volcanic plume over a given site. The black line indicates the monthly mean values.
The daily extinction coefficients at 532 nm observed by CALIOP between 17:30 and 18:40 UTC on 23 April over the Calbuco volcano and São Paulo site are depicted in Fig. 2. High extinction coefficient values (greater than or equal to 0.35 km−1) are observed in the vicinity of the Calbuco volcano and the Neuquén site between 14 and 18 km (Fig. 2a). The back-trajectory analysis clearly indicates that this thick aerosol layer observed by CALIOP is connected to the Calbuco eruption. The aerosol plume is structured in two layers that are separated by weak extinction coefficient values (0.01–0.02 km−1). The first layer is found between the Calbuco volcano and the Bariloche site with a vertical extent of 14–18 km. The second layer is centred over the Neuquén site with a weaker vertical extent ranging from 15.5 to 18 km. This two-layered structure of the plume indicates its inhomogeneity at this stage. A total of 1 d later, the volcanic aerosol layer is observed between the Neuquén and Buenos Aires sites and is structured into one compact layer spanning from 16 to 18 km (Fig. 2b). On 26 April, extinction coefficient values greater than or equal to 0.15 km−1 associated with the Calbuco eruption are observed near the São Paulo site between 18 and 20 km (Fig. 2c). The altitude of the high extinction coefficient values is in agreement with the results obtained by Lopes et al. (2019) from lidar observations over the São Paulo site. The spread of the plume over the northeastern parts of South America is associated with a decrease in thickness. This decrease could be explained by the sedimentary process that mainly impacted the coarse aerosol particles, such as volcanic ash, near the source region. Figure 2 reveals that the top layer of aerosols increased slightly during transport toward the northeastern parts of South America from 23 to 26 April. This feature of the volcanic aerosol plume over the African region is investigated using the daily extinction coefficients at 532 nm observed by CALIOP over a region extending from 23∘ S, 15∘ E to 29∘ S, 31∘ E (Fig. 3). On 30 April, a thin discontinuous aerosol layer (less than 1 km) extending from west to east is visible on CALIOP observations (Fig. 3a). The highest extinction values (0.05–0.07 km−1) are mainly found in the western parts of South Africa in the vicinity of the Gobabeb site, whereas the weakest values (0.02–0.03 km−1) are observed in the eastern parts of South Africa in the vicinity of the Durban site. This suggests that the volcanic plume reached the western parts of South Africa a few days later (as shown above) and propagated east, reaching the eastern side of the country on 30 April. Thus, a total of 3 d later, an increase in both the extinction coefficient values and the thickness of volcanic plume is observed in the vicinity of the Durban (Fig. 3b). Conversely, the dilution of the volcanic plume is associated with a 50 % decrease in the extinction coefficient values over the western parts of South Africa. The observed extinction values over South America are around 10 times higher than those observed over South Africa (Figs. 2, 3).

Figure 5Daily mean AOD values (550 nm) obtained over (a, b) Neuquén, (c, d) Comodoro, and (e, f) Rio Gallegos from sun photometer (a, c, e) and MODIS observations (b, d, f) from 15 April to 1 December. The grey area corresponds to the influence of the volcanic plume over a given site. The black line indicates the monthly mean values.
Overall, the satellite observations indicate that the majority of the aerosol plume is injected into the lower stratosphere and propagates toward South Africa during the week following the eruption. It also seems that the southern parts of Argentina were not influenced by the volcanic plume during this period of time. The synergy between the satellite and ground-based observations reinforces the description of the latitudinal distribution of the volcanic plume. The detection of the volcanic plume from the ground-based observations is discussed in detail in the next section.
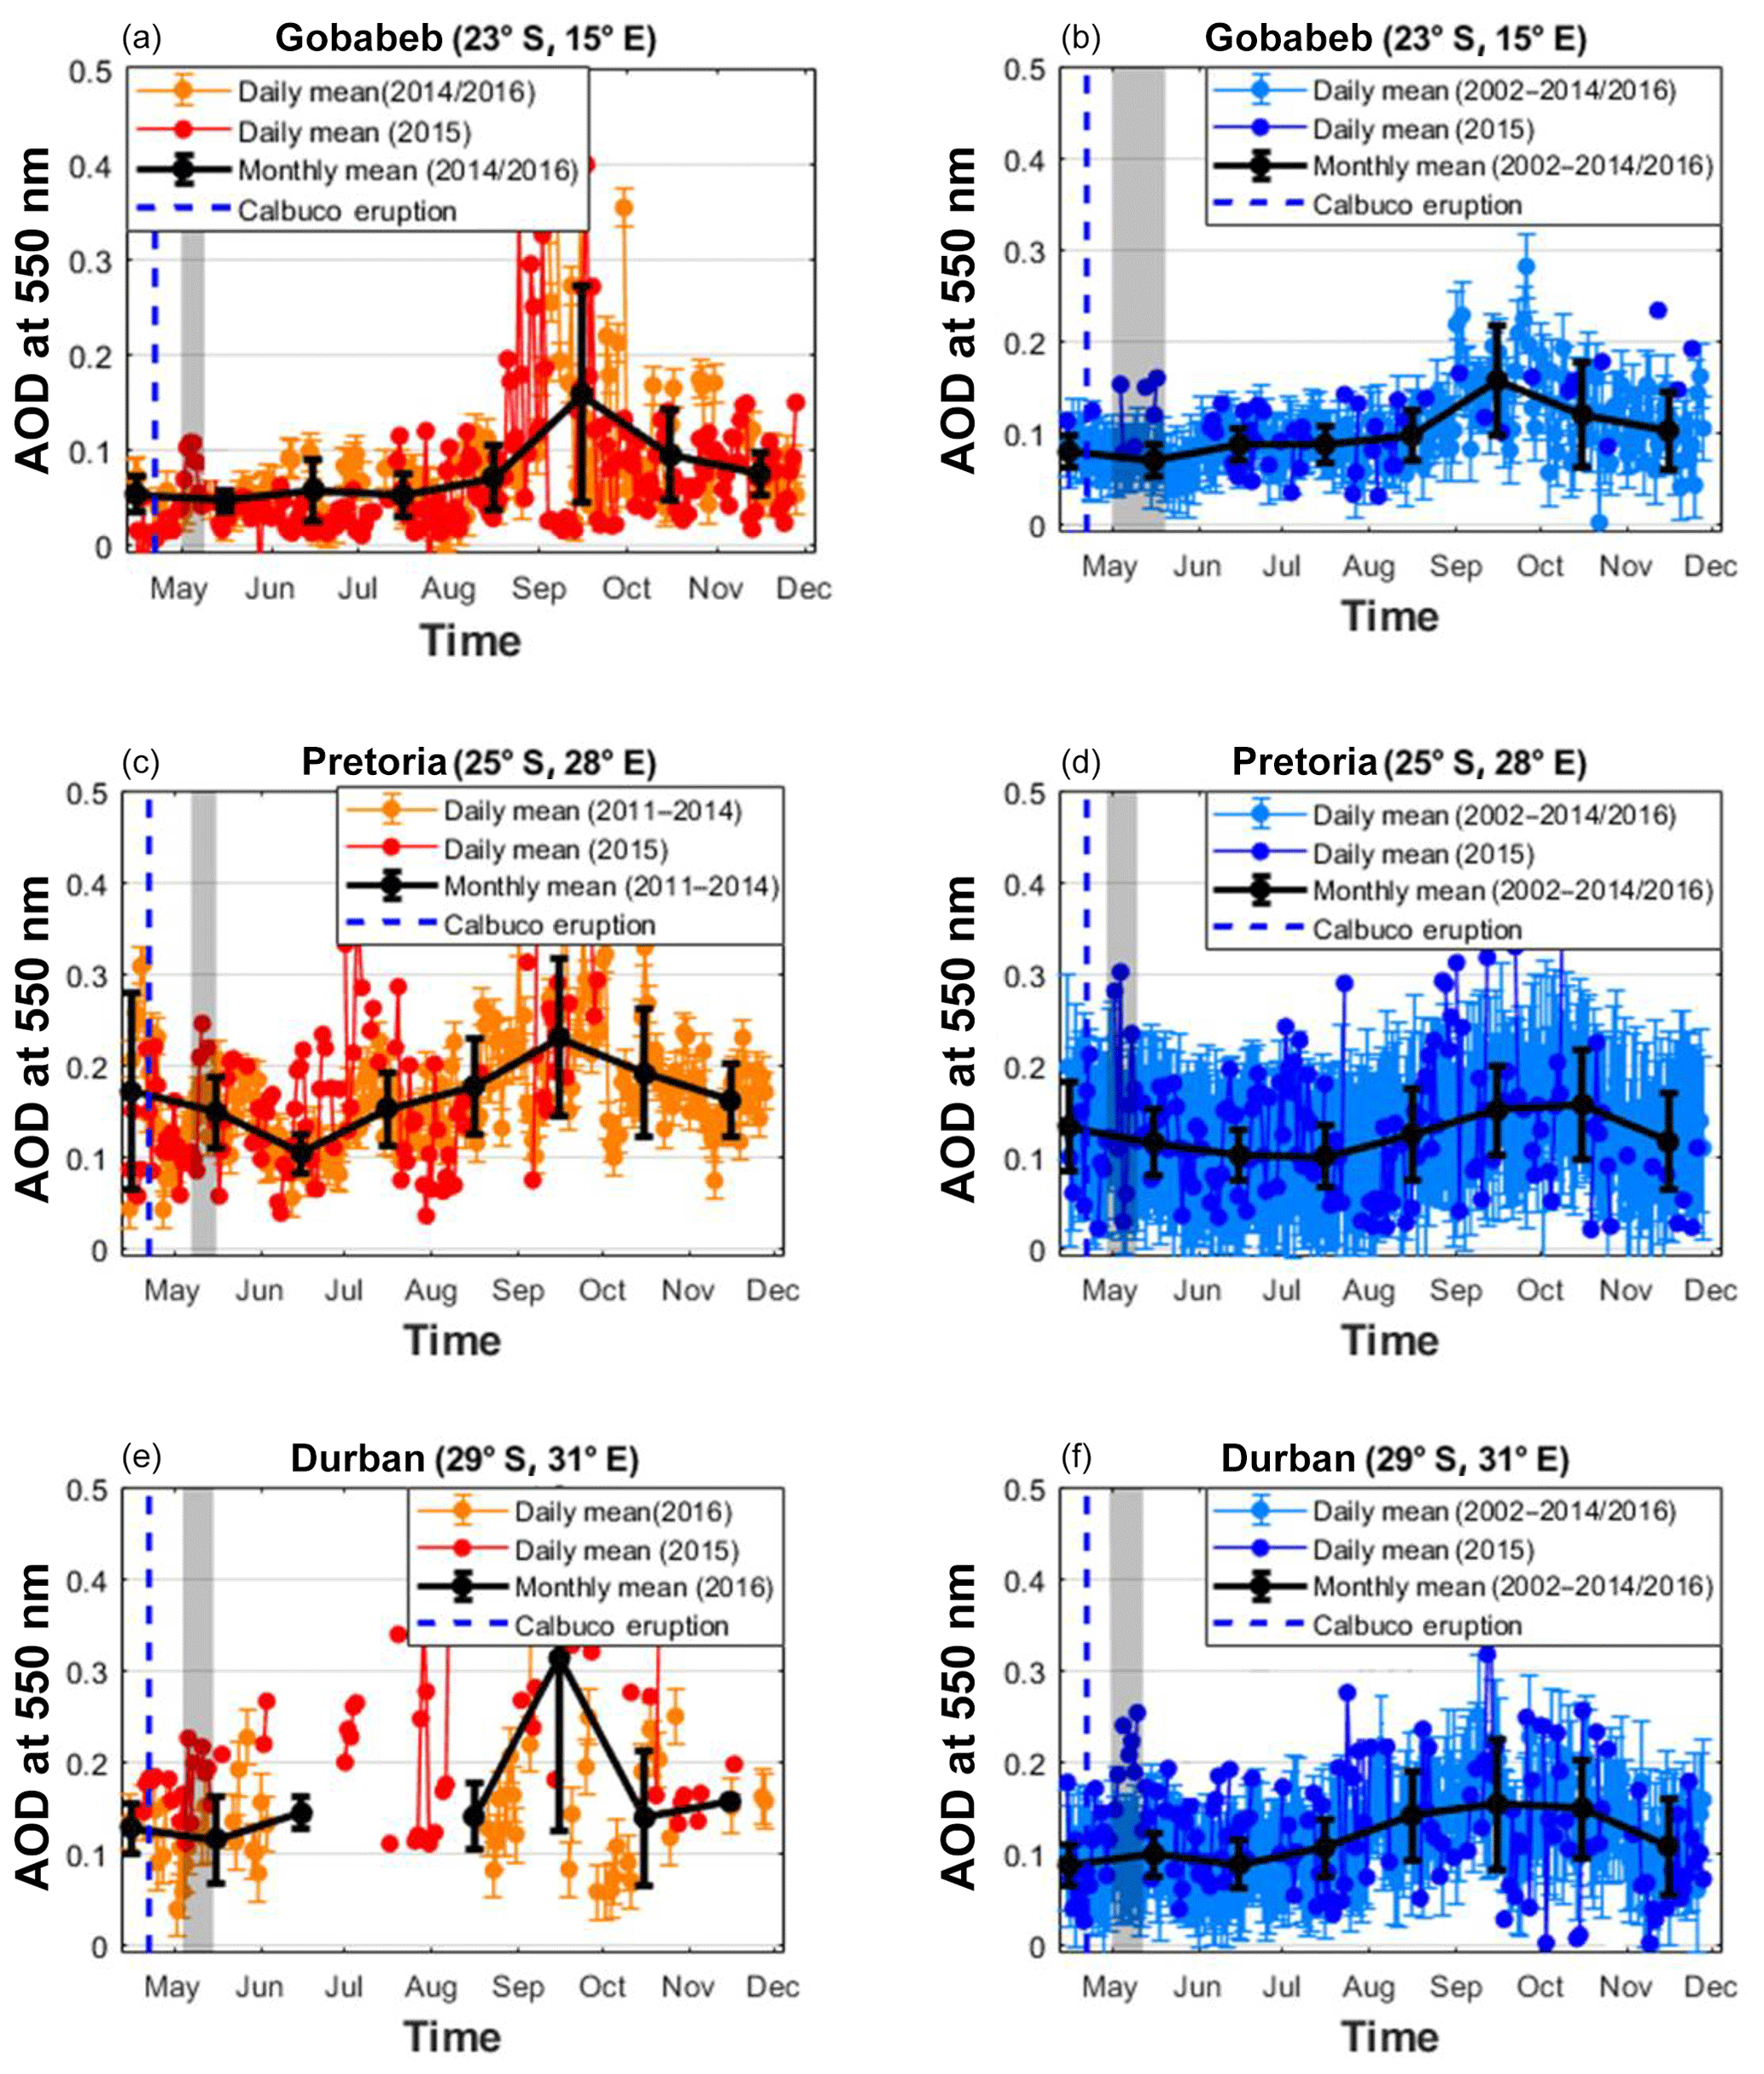
Figure 6Daily mean AOD values (550 nm) obtained over (a, b) Gobabeb, (c, d) Pretoria, and (e, f) Durban from sun photometer (a, c, e) and MODIS observations (b, d, f) from 15 April to 1 December. The grey area corresponds to the influence of the volcanic plume over a given site. The black line indicates the monthly mean values.
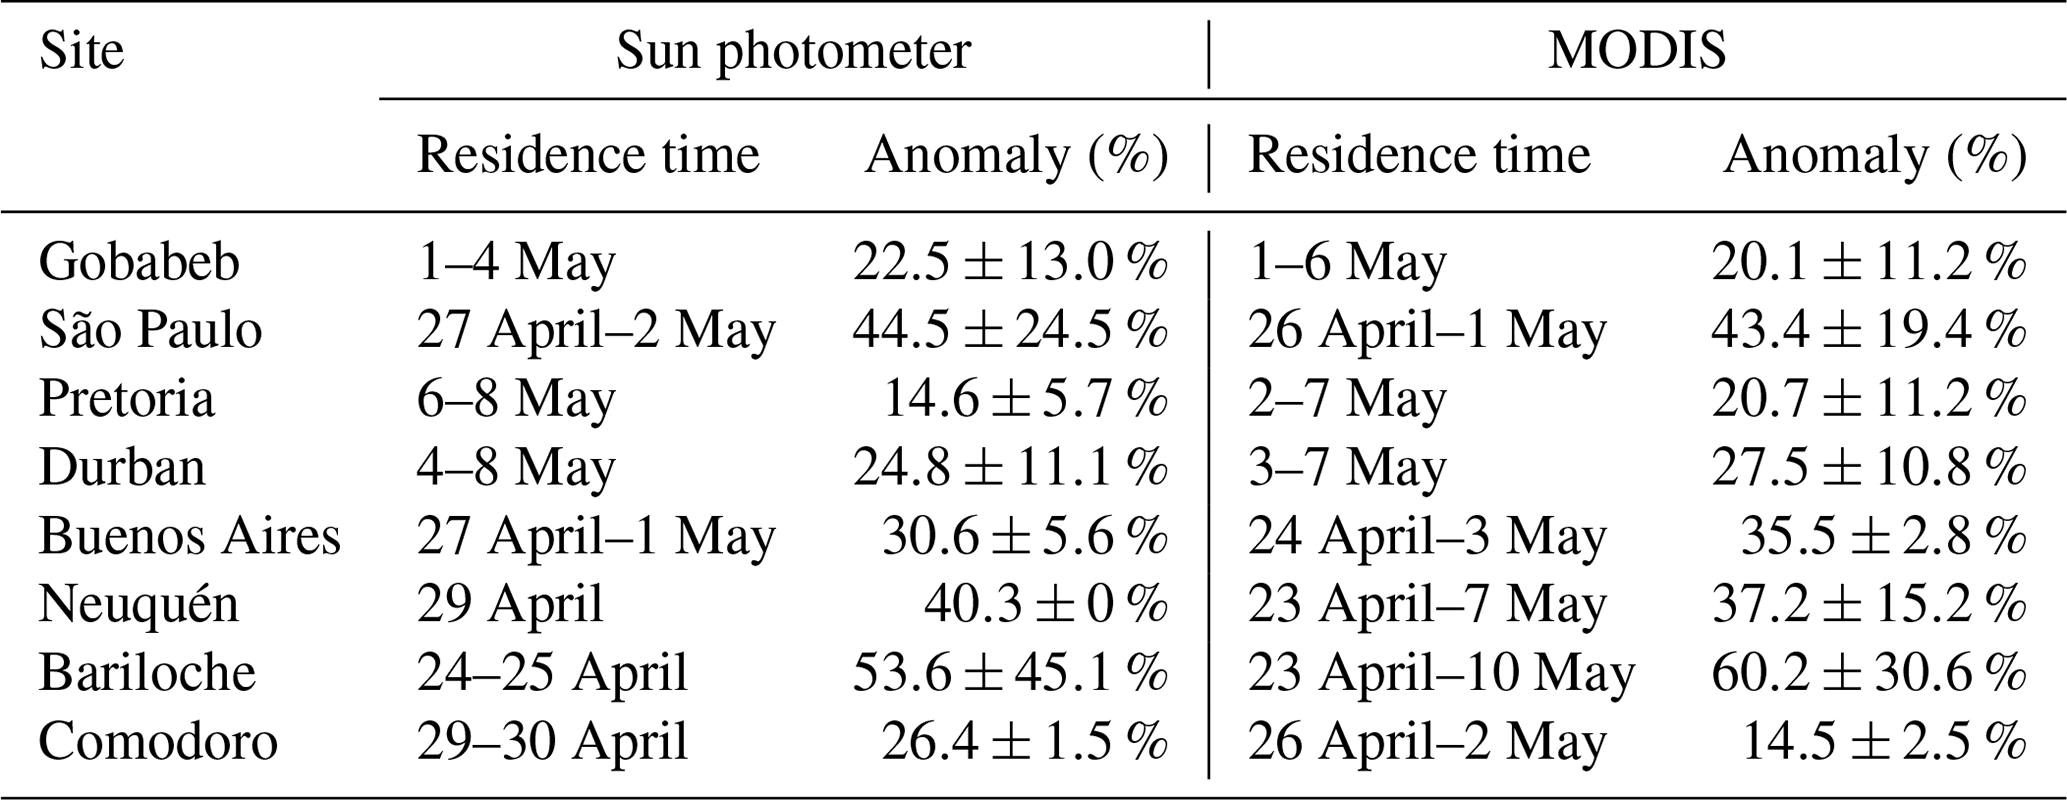
Table 2Averaged anomaly of AOD values and the corresponding standard deviation (as a percentage) induced by the Calbuco plume during its residence over each site.
4.1 Statistical detection of the volcanic plume
Figures 4 and 5 depict the daily mean evolution of the AOD at 550 nm obtained from sun photometer and MODIS observations at six South American sites between 15 April and 1 December. The selected sites allow for an overview of the latitudinal distribution of AOD over the South American region. These sites are located in urban and semiurban areas dominated by industrial activities and local air pollution (e.g. vehicle emissions and air traffic). Thus, a north–south gradient appears in the background AOD values obtained from sun photometer and satellite observations over South America (Figs. 4, 5): background AOD values and their variability decrease with increasing latitude. The annual mean AOD background values range from in São Paulo to in Rio Gallegos. The highest AOD values (with an annual mean of greater than or equal to 0.10) and the largest variability are observed at São Paulo and Buenos Aires respectively (Fig. 4a, b, c, d). These regions are the most industrialized of the selected South American sites (Gassman et al., 2000; Lopes et al., 2019). The AOD values over the Neuquén site, which is located 4∘ south of Buenos Aires, are half of those observed at Buenos Aires on average (Fig. 5a, b). In addition to urban and industrial activities, the evolution of the background values over São Paulo and Buenos Aires is influenced by biomass burning activities, which explain the increase in AOD values during the austral winter (June–August) (Andreae et al., 2004; Freitas et al., 2009; Torres et al., 2010). Based on sun photometer observations over South America, Hoelzemann et al. (2009) showed a clear difference in the AOD behaviour between sites influenced by fires and those influenced by urban emissions. This explains the contrast between the northern and southern parts of South America.
The South American region is influenced by the regional and long-range transport of air masses from several potential sources of aerosols, which induce seasonal variability in the optical properties of aerosols over the country. For instance, the transport of dust from the Patagonian region impacts the seasonal variability of the optical properties of aerosols at neighbouring sites such as Comodoro (Li et al., 2010; Otero et al., 2015). Moreover, the southern parts of Argentina are frequently impacted by air masses from the Antarctic, which could influence the variability of AOD over Rio Gallegos (Kirchhoff et al., 1997; Otero et al., 2015). We can also not exclude the hypothesis that the increase in the AOD values observed from sun photometer and MODIS measurements performed at Rio Gallegos during the austral winter could be explained by the transport of air masses from the Antarctic region (Fig. 5e, f). Figure 6a reveals that the background AOD values and their variability over São Paulo and Buenos Aires compare fairly well with the observed values over the Gobabeb site ( on average). The background AOD values observed at Gobabeb are slightly lower than those observed at Durban ( on average) and Pretoria ( on average) from both the sun photometer and MODIS (Fig. 6). The Gobabeb site, in the Namib Desert, is far less sensitive to the effect of urban pollution than the Durban and Pretoria sites. It can be observed that all of these African sites exhibit an increase in the AOD values during the austral spring season, which is well known to be the biomass burning season (Eck et al., 2003; Garstang et al., 1996; Das et al., 2015; Piketh et al., 1999; Kumar et al., 2017).
The daily AOD measurements performed between 15 April and 1 December 2015 were compared with background values in order to highlight the passage of the volcanic plume. Furthermore, back-trajectory analysis of daily AOD measurements from 2015 with higher than background values were carried out in order to link these observations to the Calbuco plume. Thus, it is possible to determine the residence time of the plume over a specific site. This duration is defined as the period during which AOD measurements from 2015 fall outside of the standard deviation of the daily background means. The residence time of the Calbuco plume detected from total columnar aerosols measurements is reported in Table 2 and is depicted by the grey shaded areas in Figs. 4, 5, and 6. The estimation of the residence time of the plume mainly depends on the availability of daily observations. This condition results in discrepancies in the residence time between the MODIS and sun photometer observations. Given its good temporal resolution, the daily comparison of the observed AOD from MODIS during the background period and during the Calbuco event is possible over a long period of time. Measurements collected by these two instruments are complementary and allow for the improvement of the estimation of the residence time over the selected sites. This is clearly illustrated by the Bariloche site, as no measurements were recorded at this site by the sun photometer from 26 April to 10 May during the background period (Fig. 4e, f); however, the use of MODIS observations has allowed for the estimation of the residence time to be improved, with the conclusion that the plume passed over this site from 23 April to 10 May 2015. In spite of the large variability in the background values over the São Paulo and Buenos Aires sites, the passage of the volcanic plume is clearly visible from the sun photometer and MODIS observations (Fig. 4a, b, c, d). This previous comment is also true for the African sites (Fig. 6). It is worthwhile mentioning that the residence times obtained for these sites are in agreement with the chronology reported in the previous subsection from CALIOP and OMI observations. It can be observed that the passage of the volcanic plume is not clearly visible over the southern parts of the South American region. Figure 4e reveals that the passage of the Calbuco plume over the Rio Gallegos site is not visible from AOD measurements recorded by the sun photometer. This could be explained by the low daily sampling interval during 2015. Conversely, the AOD measurements recorded by MODIS from 12 to 25 May 2015 are higher than daily background values (Fig. 5f). The air mass back-trajectory calculations confirm the link between these observations and the Calbuco eruption, which is in agreement with the results reported by Zuev et al. (2018). They analysed the trajectory of air masses associated with the Calbuco volcano from 22 April until the end of August between 15 and 19 km using the NOAA HYSPLIT model. Zuev et al. (2018) showed that the air masses were within the limits of the subtropical stream and the polar vortex, impacting the southern parts of South America. However, the aforementioned MODIS observations are within the standard deviation of the daily background mean. As a consequence, it is impossible to determine the residence time over the Rio Gallegos site following the previously defined statistical criteria. Figure 5e and f do not call the passage of the volcanic plume over the Rio Gallegos site into question but rather suggest that the AOD measurements are not statistically significant. A possible explanation for this is that the amount of aerosols transported toward Rio Gallegos is lower than the amount transported toward the northern parts of South America, which then reaches South Africa a few days later. Thus, this lower concentration of volcanic aerosols gets lost in the variability of the background values. In the following subsection, the contribution of the volcanic plume to the total columnar aerosols will be discussed in more detail.

Figure 7Daily mean AOD anomaly (%) at (a, b) São Paulo, (c, d) Bariloche, and (e, f) Gobabeb calculated from sun photometer (a, c, e) and MODIS (d, d, f) observations between 19 April and 31 May.
4.2 Statistical variations of the total columnar aerosols
The daily AOD anomalies induced by the transport of the volcanic plume are estimated and calculated as a relative difference by considering the daily background as a reference value. The Bariloche site is clearly the most exposed to the volcanic plume, which is illustrated by the significant difference (a factor of 2.5 on average) between the daily AOD measurements from 2015 and the background values (Fig. 4e). During the first few days following the eruption, the AOD values obtained from lidar and sun photometer observations range from 0.18 to 0.24 (Fig. 4e). This validates that these high values are not the result of technical artefacts but are rather attributed to the passage of the Calbuco plume detected by two independent ground-based instruments. The maximum values of the relative difference are observed over the Bariloche site (Fig. 7c, d). Figures 7c and d reveal that the AOD anomalies calculated from the sun photometer and MODIS observations during the first few days after the eruption range from 35 % to 85 %. Moreover, despite its geographical distance from the Calbuco volcano site and its significant background variability, the passage of the plume over the São Paulo site induced significant daily AOD anomalies ranging from 20 % to 55 % (Fig. 7a, b). The African sites situated in the west, such as Gobabeb, were the first impacted by the volcanic plume, and AOD anomalies induced by its spread are significant. Over the Gobabeb site, the daily AOD anomalies ranged from 10 % to 55 % (Fig. 7e, f). Table 2 contains the mean AOD anomaly values calculated during the plume's residence over all of the selected sites. Overall, the AOD anomalies induced by the passage of the plume over the South American sites are higher on average than those obtained over the South African sites (Table 2). This is consistent with the contrast in the extinction coefficients obtained by CALIOP between South America and South Africa that were reported in the previous subsection. Table 2 reveals that the highest AOD anomalies (greater than 35 %) are observed over the northeastern parts of South America, enclosing the Bariloche, Neuquén, Buenos Aires, and São Paulo sites. The AOD anomalies for the Comodoro site, which is south of the Calbuco site, are estimated to be 26.4±1.5 % and 14.5±2.5 % from the sun photometer and MODIS respectively. There seems to be a difference between the sites located to the north and south of the Calbuco volcano with regards to the AOD anomalies induced by the passage of the plume. It is worthwhile mentioning that the latitudinal distribution of AOD anomalies over South America is consistent with the geographical spread of the volcanic plume obtained from satellite observations. Both the satellite and ground-based observations reveal that the majority of the volcanic plume was transported over the northeastern part of South America during the first few days following the eruption. Conversely, the AOD anomalies induced by the spread of the plume from west to east over South Africa have a homogeneous distribution. On average, the AOD anomalies for Gobabeb and Durban from sun photometer observations are estimated to be 22.5±13.0 % and 24.8±11.1 % respectively, whereas the values from MODIS observations are estimated to be 20.1±11.2 % and 27.5±10.8 % respectively (Table 2). On average, the difference between the AOD anomalies obtained from MODIS and sun photometer observations is less than 7 % with the exception of the Comodoro site, where the difference is estimated to be 11.9 %. The discrepancies in term of AOD anomalies between MODIS and sun photometer observations may be primarily attributed to the estimation of the residence times, as previously mentioned. It is important to note that the discrepancies between background measurements from MODIS and sun photometer observations should not be excluded.
Table 3Statistical parameters for the comparison between sun photometer (Phot) and MODIS (MOD) observations for each site.
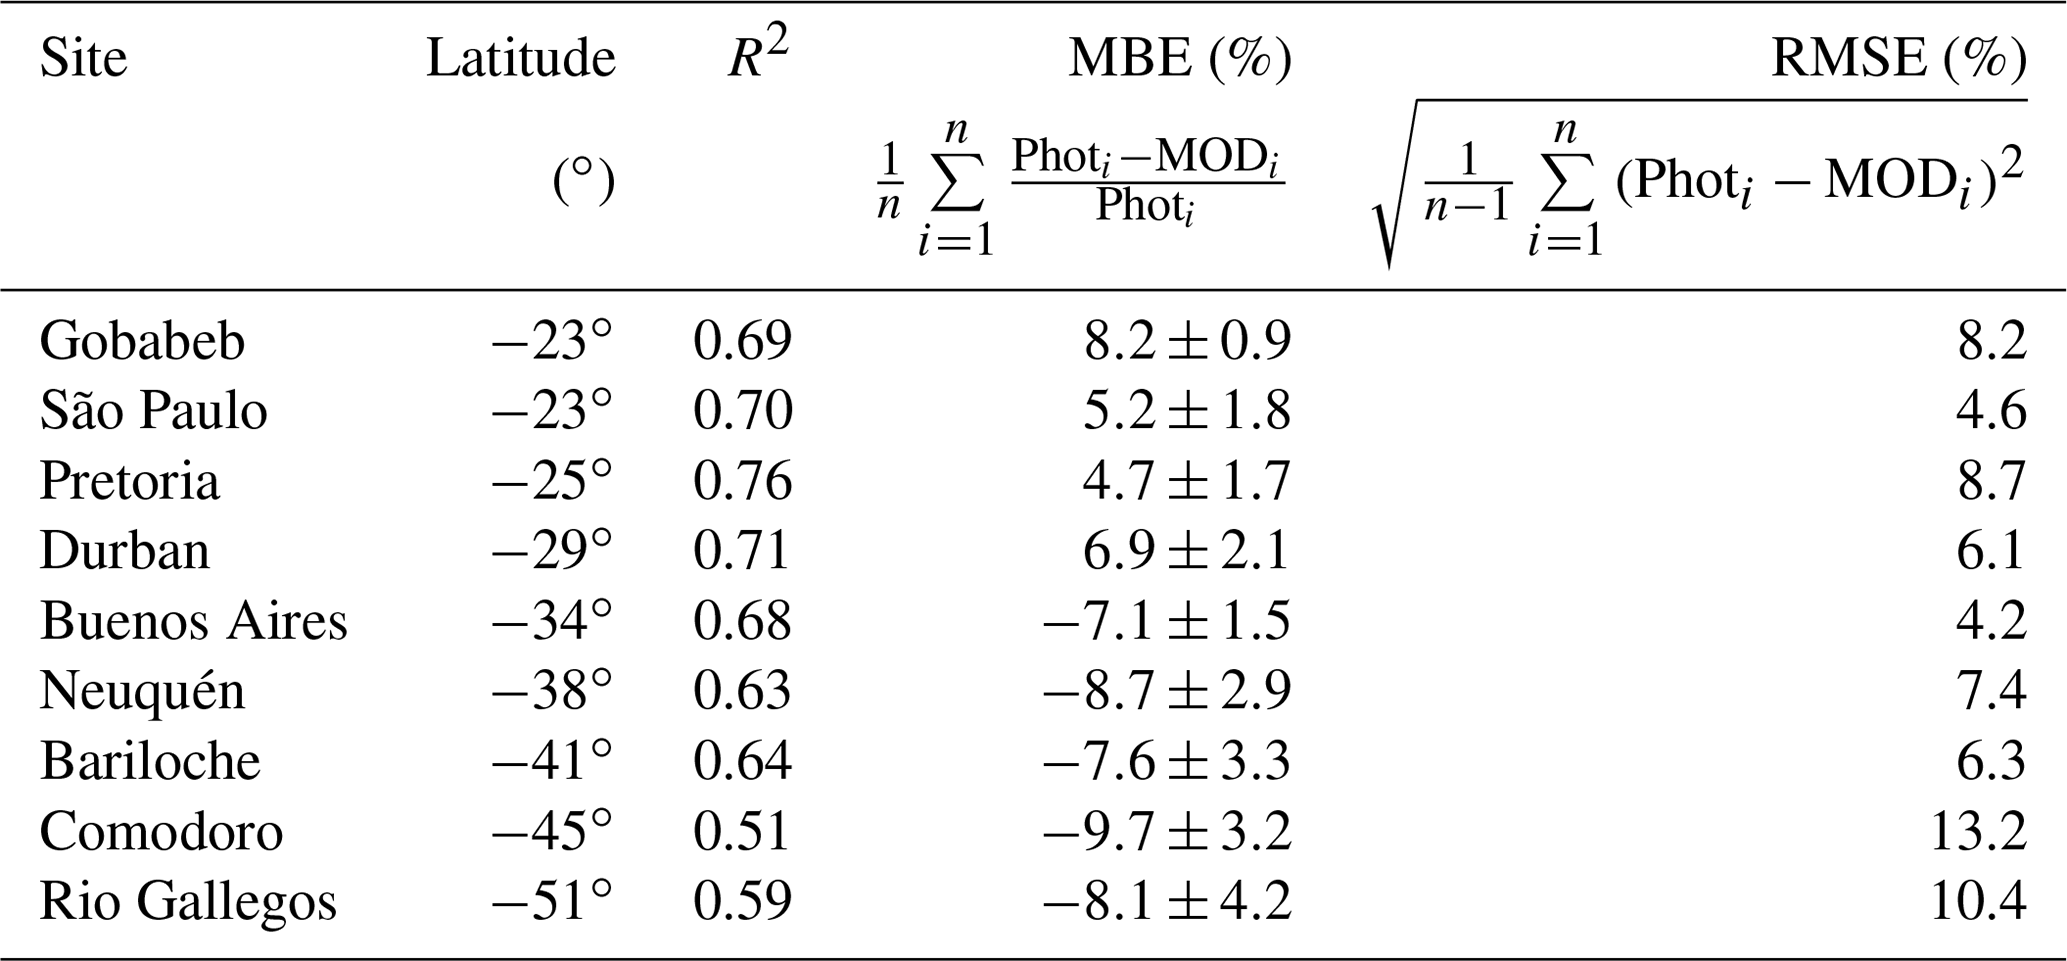
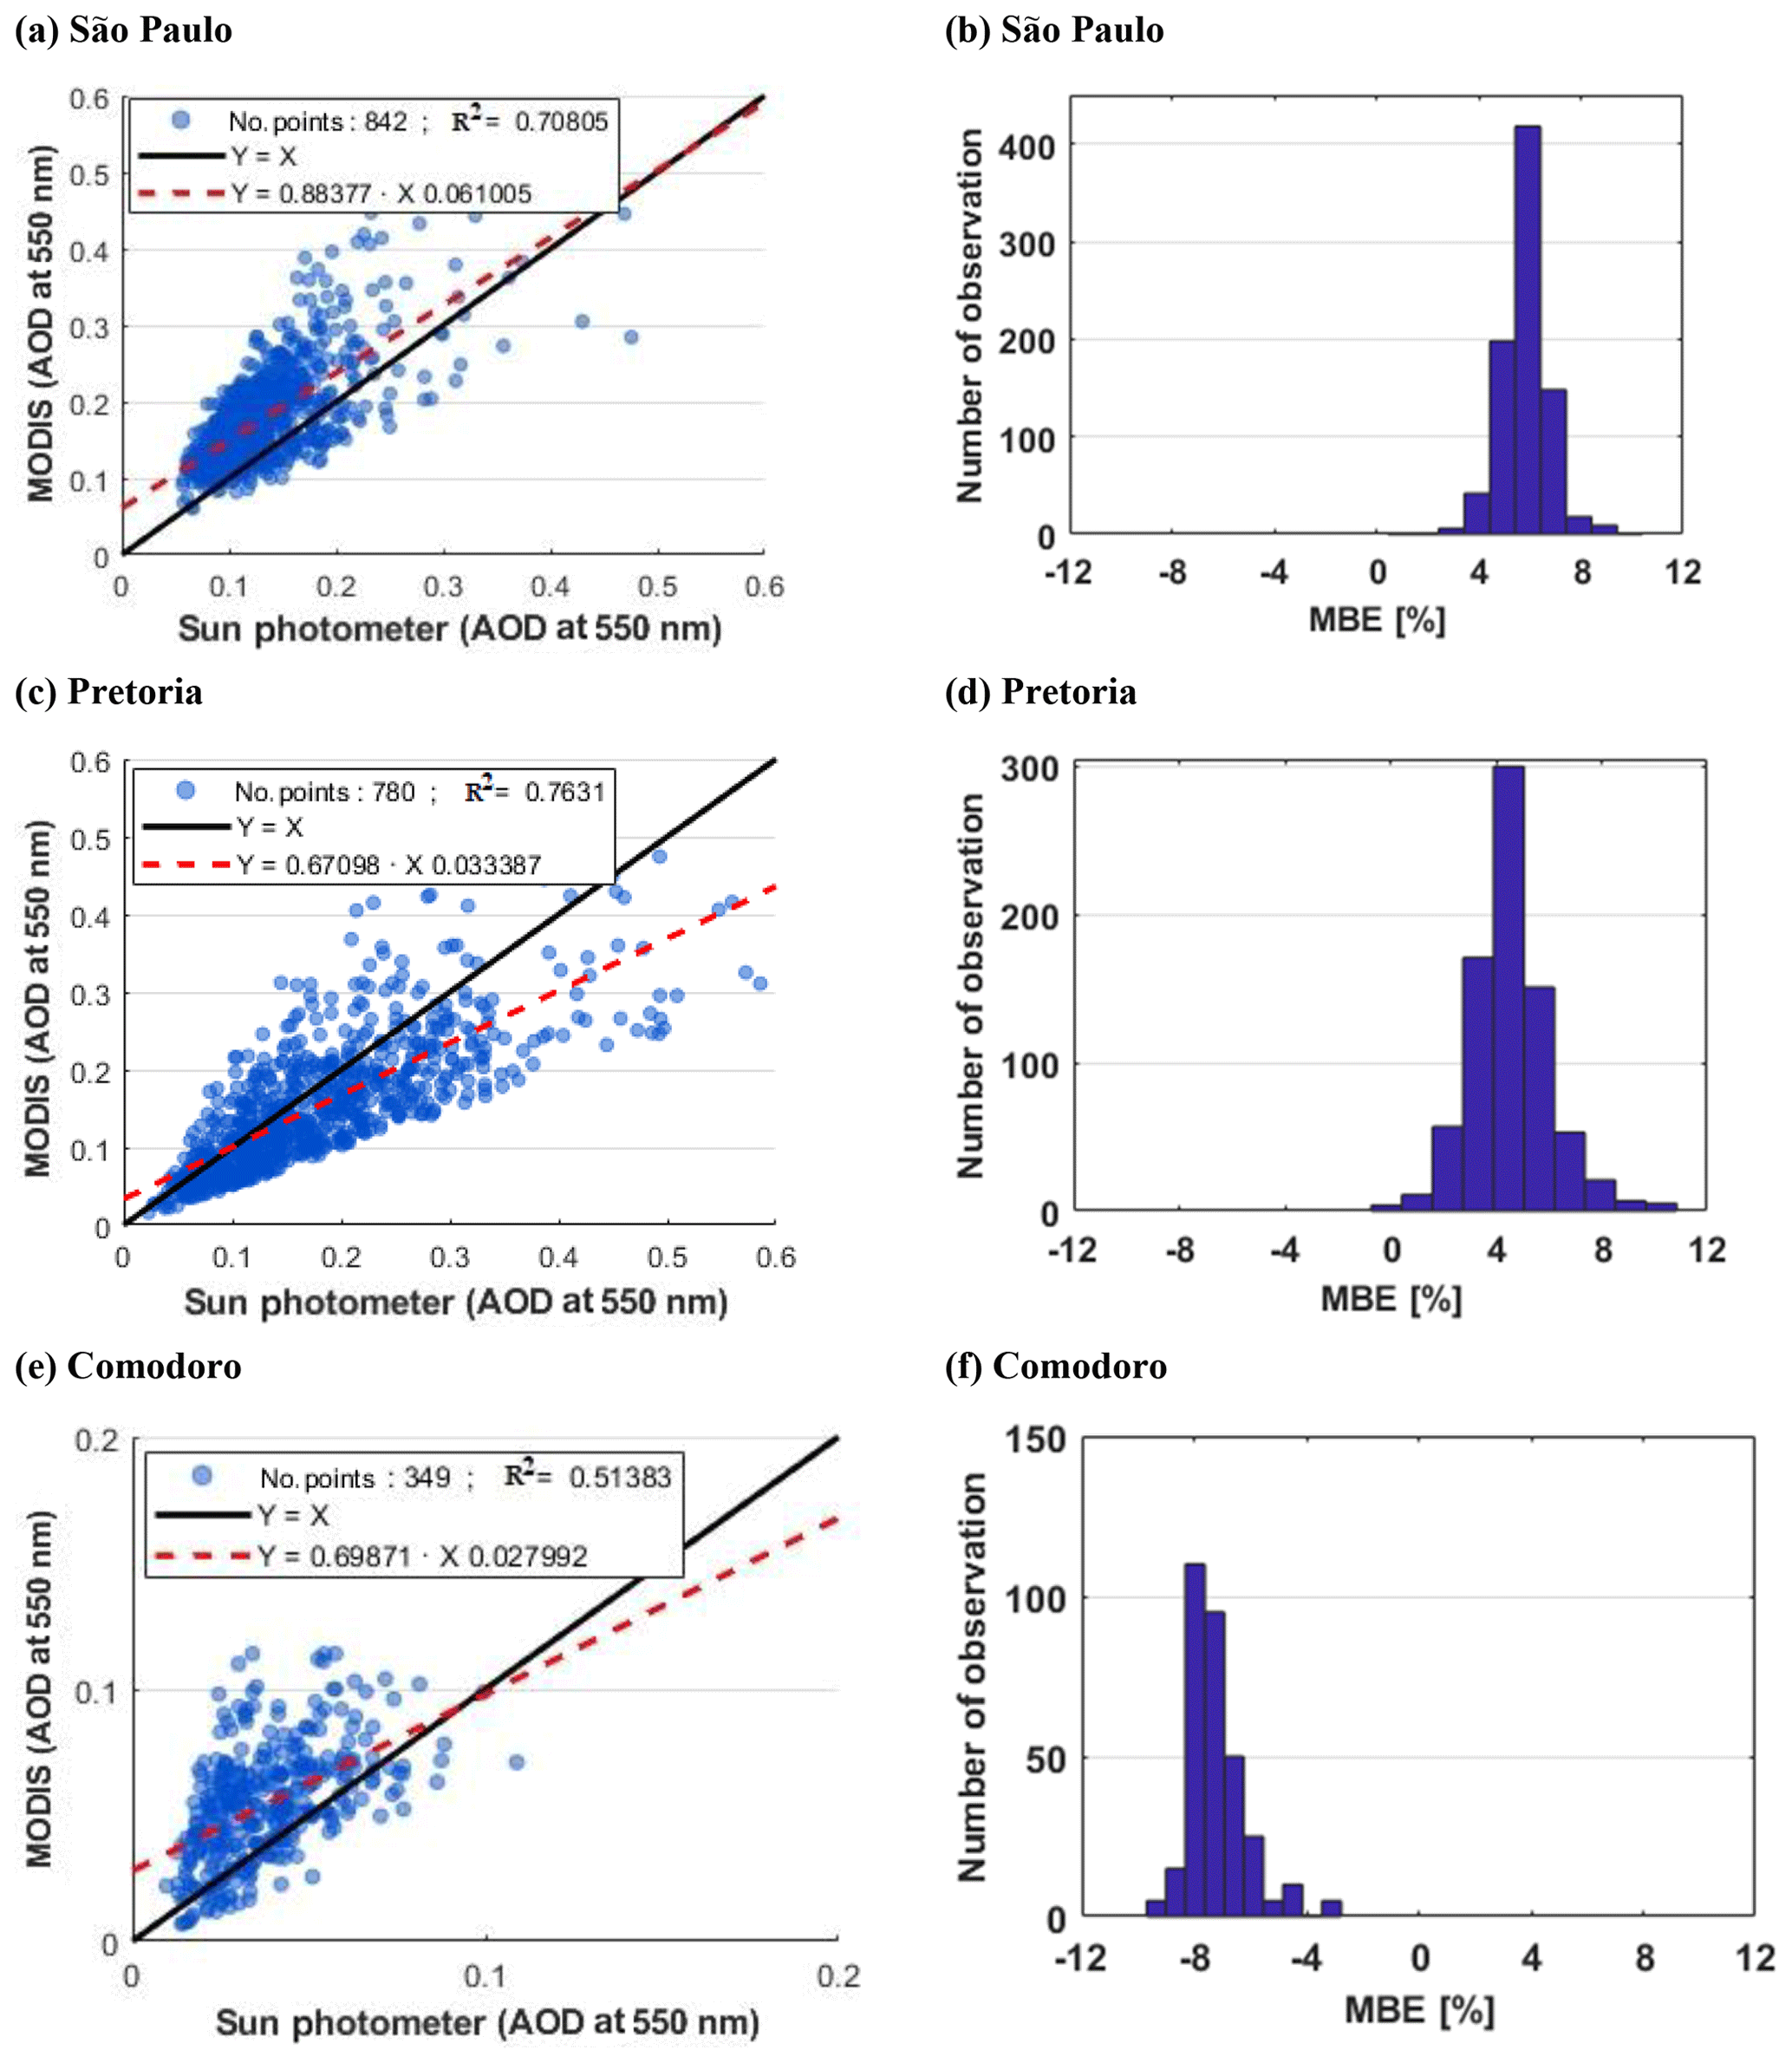
Figure 8Correlation of AOD daily mean observations (550 nm) between sun photometer and MODIS observations during the entire period of available data at (a, b) São Paulo, (c, d) Pretoria, and (e, f) Comodoro. The histograms show the mean bias error (MBE) of the two data sets against the number of observations for each site.
The correlation coefficient and mean bias error (MBE) values between sun photometer and MODIS AOD observations are depicted in Fig. 8 and reported in Table 3. The correlation coefficient values range from 0.51 to 0.76 with the highest correlation observed over the Pretoria site (Fig. 8c, d). This is in agreement with previous studies which have revealed that MODIS and sun photometer observations are significantly correlated over land instead of over the ocean and coastal sites due to the low surface reflectivity over land (Chu et al., 2002; Vermote et al., 1997; Hoelzemann et al., 2009; Bréon et al., 2011). It is worth noting that the correlation between the sun photometer and MODIS observations over the São Paulo site is similar to those observed over Durban and Pretoria (Fig. 8a, b). In addition, the root-mean-square error (RMSE) was calculated and is reported in Table 3. The RMSE and MBE values range from 4.2 % to 13.2 % and from −9.7 % ±3.2 % to 8.2 % ± 0.9 % respectively. The highest discrepancies between the sun photometer and MODIS measurements (a correlation coefficient lower than 0.60 and a RMSE greater than 9 %) are observed in the southern parts of South America, close to the Comodoro and Rio Gallegos sites. In particular, the Comodoro site has the weakest correlation (0.51) and the lowest MBE value of −9.7 % ± 3.2 % (Fig. 8e, f). Previous studies have already pointed out the bias in the AOD data sets collected by MODIS and ground-based instruments in the Southern Hemisphere between 45 and 65∘ S (Zhang and Reid, 2006; Shi et al., 2011; Lehahn et al., 2010; Madry et al., 2011; Toth et al., 2013). Madry et al. (2011) suggested that this bias could be due to the production of sea salt particles from the near-surface high winds occurring along this zonal band. Toth et al. (2013) investigated the quality of MODIS data sets in this zonal band by comparing them with CALIOP and sun photometer observations. They showed that about 30 %–40 % of the observed bias with the ground-based observations could be attributed to cloud contamination. Table 3, reveals that MODIS overestimates the AOD when compared with sun photometer observations for most of the selected sites, which is consistent with previous studies (Ichoku et al., 2005; Abdou et al., 2005; Hauser et al., 2005; Hoelzemann et al., 2009). This bias may be explained by the fact that sun photometer measurements are made under cloud-free conditions, whereas MODIS is able to detect aerosols under cloudy conditions. However, sub-pixel cloud can be targeted as aerosols, which erroneously raises the retrieved AOD (Hoelzemann et al., 2009). Conversely, we note that MODIS underestimates the AOD when compared with sun photometer observations over the São Paulo and the South African sites (Table 3). For the latter, this was found to be consistent with results obtained by Hao et al. (2005) during the Southern African Regional Science Initiative(SAFARI 2000) campaign which showed that AOD values from MODIS are systematically lower at 470, 550, and 660 nm compared with ground-based measurements by automated and handheld sun photometers in the regions of intense biomass burning. They suggested that this bias may be due to errors in the assumed aerosol scattering phase function or surface directional properties. Thus, several potential causes (surface reflectance, cloud contamination, and retrieval bias) could contribute to the discrepancies between MODIS and sun photometer observations (Tripathi et al., 2005; More et al., 2013; Kumar et al., 2015). The previously mentioned statistical results indicate that the daily AOD values obtained from sun photometer and MODIS observations are in fairly good agreement. Overall, the anomalies induced by the transport of the Calbuco plume can be statistically detected and evaluated using AOD measurements at mid-visible wavelengths. In order to improve the discussion, the observed AOD from the UV to the NIR spectral ranges will be analysed in the following section.
The time evolution of the extinction profile obtained from the co-located lidar measurements at 532 nm confirms the presence of the volcanic plume between 12 and 15 km on 24 and 25 April over the Bariloche site (Fig. 9a). The spectral variability of plume-isolated AOD (AODP) values obtained from sun photometer observations during the aforementioned period is shown in Fig. 9b and c. For both days, the AODP evolution is not characterized by wavelength dependence (Fig. 9b) but is similar to those from the UV and NIR spectral range (average 0.18±0.05). This optical behaviour is typical of an aerosol layer dominated by larger particles such as mineral dust or ash particles (Mather et al., 2004; Bègue et al., 2012; Sellitto et al., 2018). The Angström exponent αP and the uncertainty calculated for the 380–1020 nm wavelength pair using Eqs. (2) and (4) respectively are also shown in Fig. 9b. The mean Angström exponent αP values on 24 and 25 April are and 0.1±0.06 respectively. These values confirm the dominance of larger particles with a radius greater than 1 µm (Watson and Oppenheimer, 2000). The time evolution of the Angström turbidity βP and its uncertainty derived using Eqs. (3) and (5) are depicted in Fig. 9c. The βP parameter increases with the number of particles. Thus, the Angström turbidity βP evolution is correlated with the AODP values, as depicted in Fig. 9b. As a consequence, weak βP values are consistent with the plume being less thick and with weak AODp values. Conversely, high βP (greater than 0.1, indicating a thick aerosol layer) and weak αP (less than 0.5, indicating the presence of coarse particle) can be associated with relevant burdens of larger particles, such as volcanic ash (Sellitto et al., 2018). On average, the Angström turbidity βP values range from 0.16±0.06 on 24 April to 0.19±0.04 on 25 April over the Bariloche site. For both days, a negative correlation is observed between the Angström exponent αP and the turbidity βP. This suggests a significant increase in larger particles over the Bariloche site. Thus, this negative correlation reveals the presence of a thick aerosol layer dominated by larger particles over the Bariloche site 2 d after the eruption. These results are found to be in agreement with estimations of Angström coefficients for ash-bearing plume that have been reported in previous studies (e.g. Watson and Oppenheimer, 2000, 2001; Porter et al., 2002; Mather et al., 2004; Martin et al., 2009; Sellitto et al., 2017, 2018). During the minor eruption of the Lascar volcano (23.4∘ S, 67.7∘ W; Chile) in 2003, the Angström exponent αP (440–1020 nm) and turbidity βP derived from Microtops sun photometer observations for ash-bearing plumes were found to be smaller than 0.3 and ranged from 0.04 to 0.10 (Mather et al., 2004). Using sun photometer observations during the last Mount Etna (37.5∘ N, 14.6∘ E) eruption, Sellitto et al. (2017) found the Angström exponent αP (380–1020 nm) and turbidity βP for ash-bearing plumes to be equal to and 0.08±0.05 respectively. During the eruption of the Mount Etna volcano in October 1997, the Angström exponent αP (440–1020 nm) and turbidity βP derived from CIMEL sun photometer observations for ash-bearing plumes ranged from −0.20 to 0.20 and from 0.16 to 0.65 respectively. It is worth mentioning that our Angström coefficient estimations are in agreement with the ash-bearing plume observed at Mount Etna by Watson and Oppenheimer (2001).
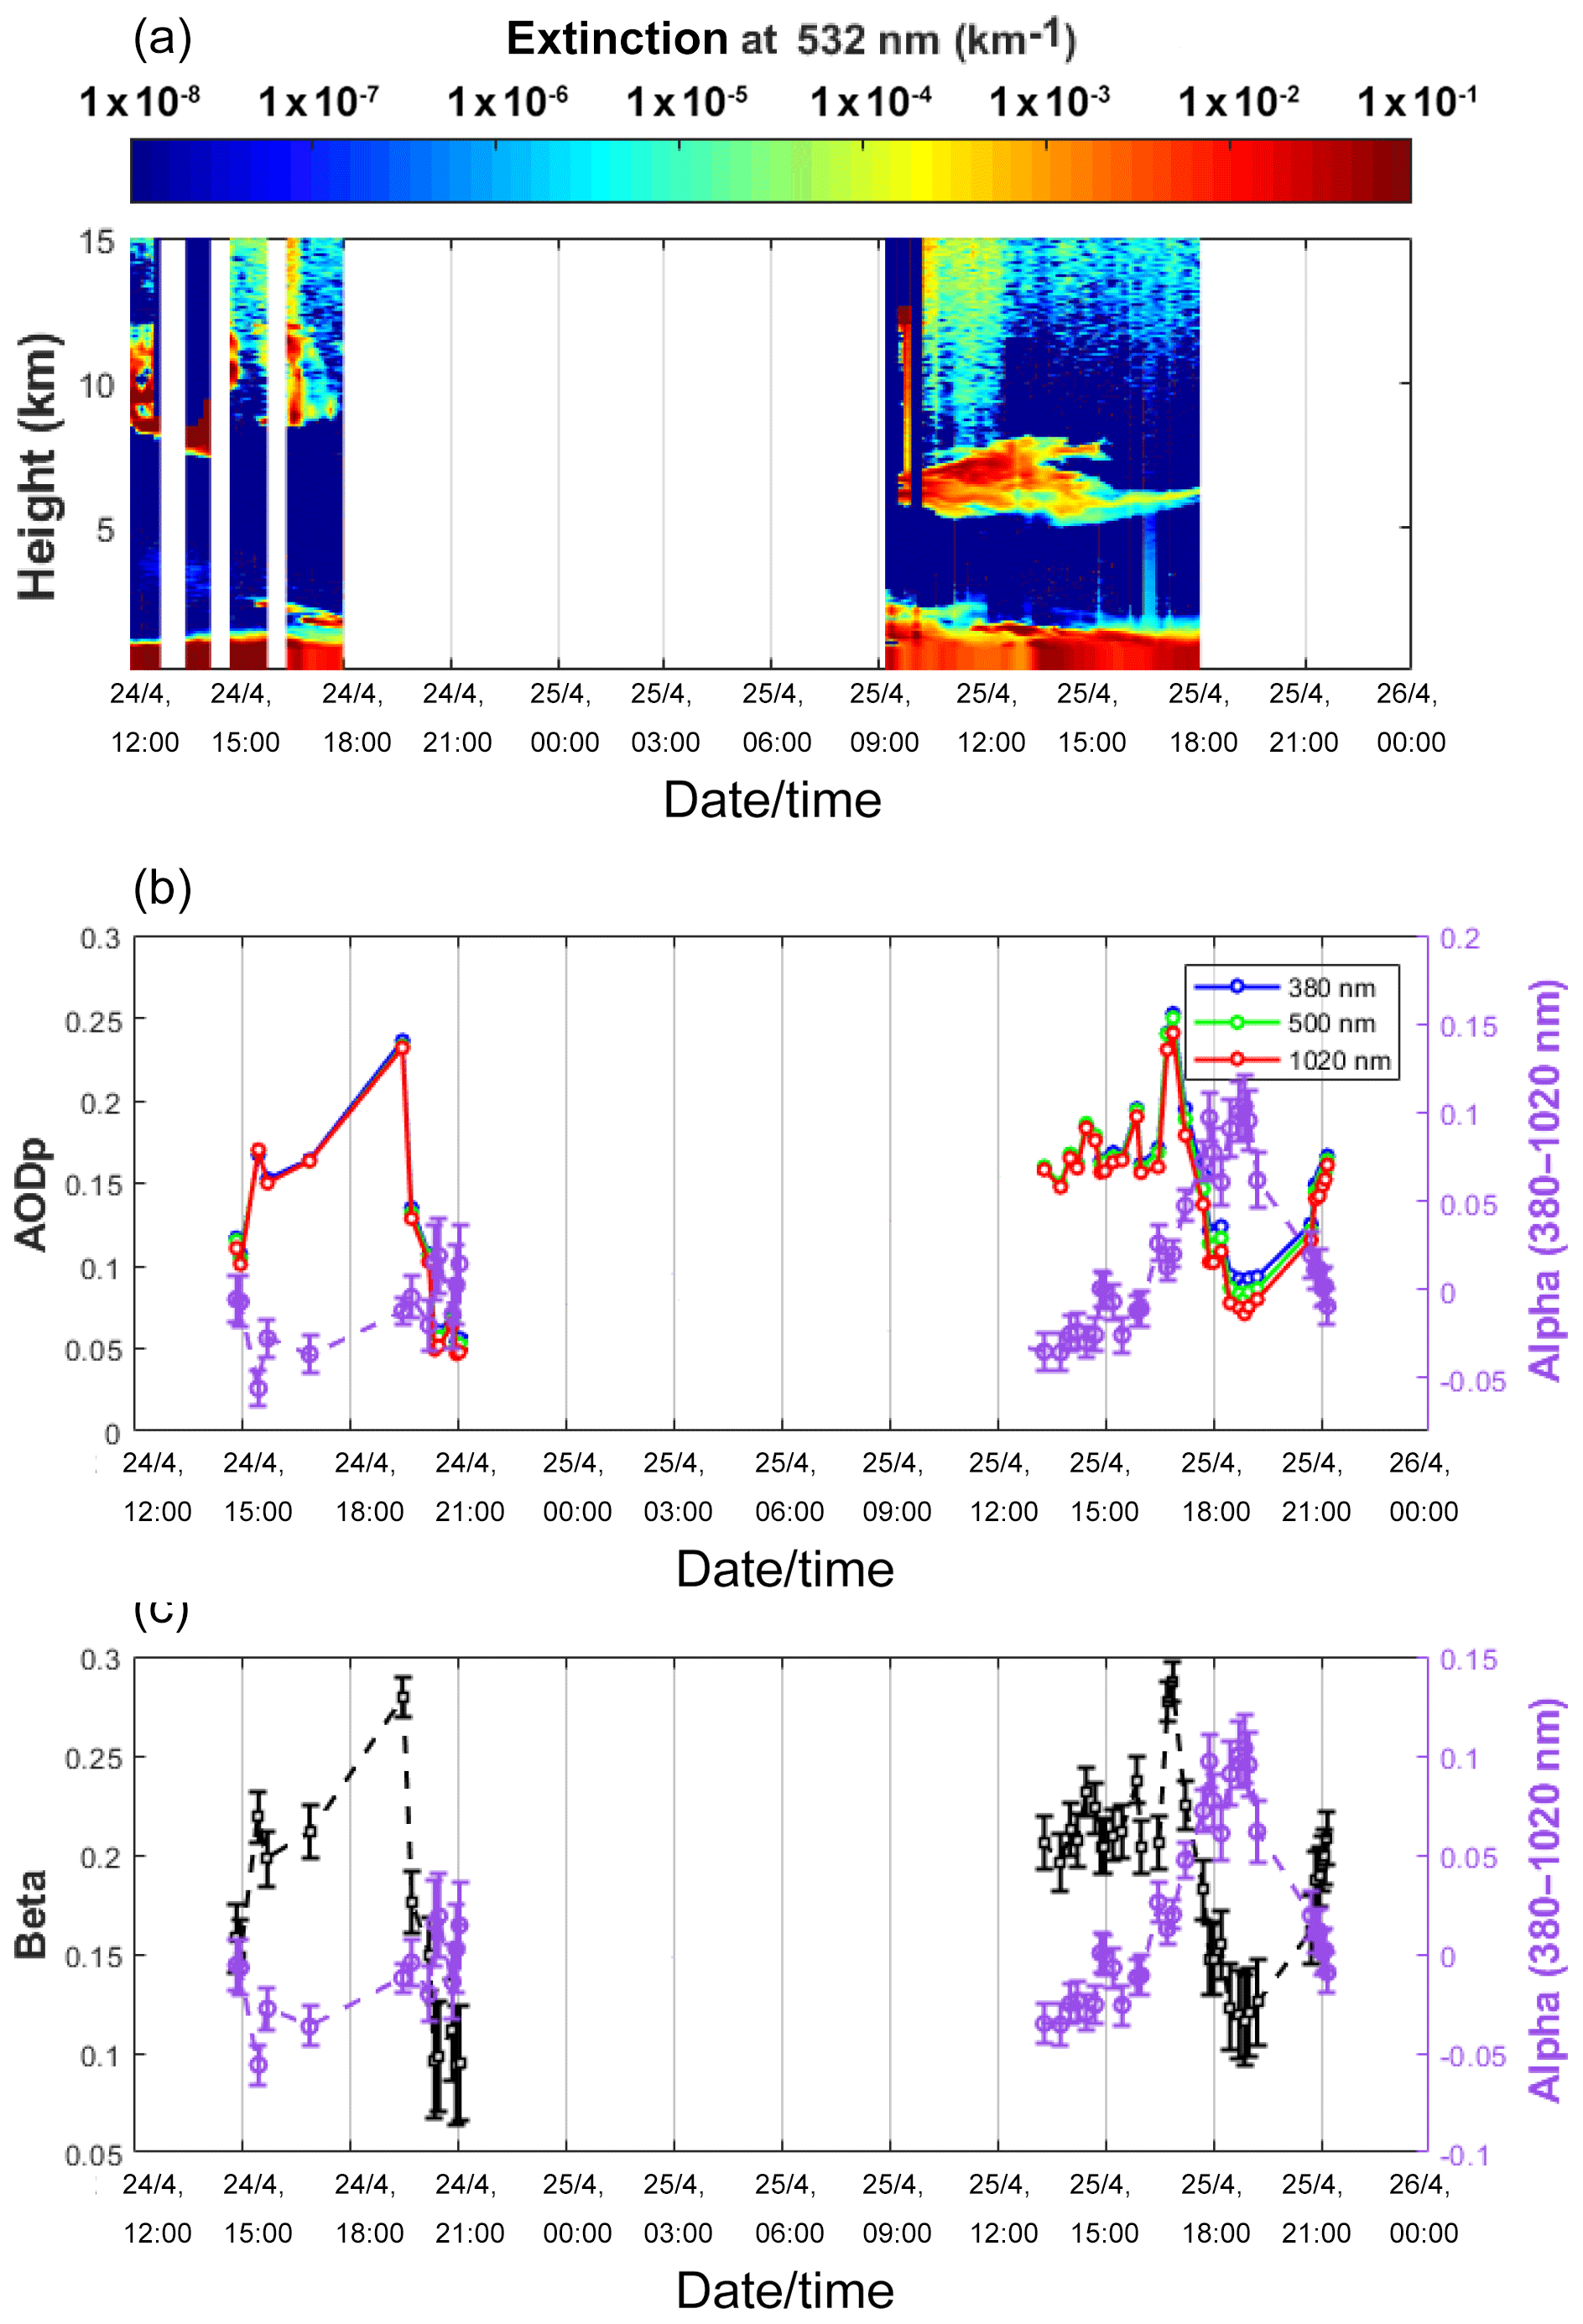
Figure 9(a) The time evolution of the extinction profile (532 nm) obtained from lidar observations at Bariloche between 24 and 25 April 2015. (b) The time evolution of the plume-isolated AOD in the UV–NIR wavelength range versus the Angström exponent (380–1020 nm) from sun photometer observations at Bariloche between 24 and 25 April 2015. (c) The time evolution of the Angström turbidity versus the Angström exponent (380–1020 nm) from sun photometer observations at Bariloche between 24 and 25 April 2015.
Figure 10 illustrates that the optical characteristics of the volcanic plume evolved during its transport. On 29 April, the AODp values at the Neuquén site were characterized by a wavelength dependence (Fig. 10a). Figure 10a indicates that higher AODp values were observed in the UV range (ranging from 0.08 to 0.27) than in the NIR range (ranging from 0.08 to 0.03). This optical behaviour is typical of an aerosol layer dominated by smaller particles (a radius lower than 1 µm). This is confirmed by the Angström exponent αP values which ranged from 1.2 to 1.5 (Fig. 10a). Figure 10c reveals that the Angström turbidity βP values ranged from 0.02 to 0.062 with a mean value of 0.04±0.02, which suggests the presence of a thin aerosol layer. This Angström coefficient estimation is consistent with ash-free plumes previously observed for other volcanic eruptions (Watson and Oppenheimer, 2000, 2001; Porter et al., 2002; Mather et al., 2004; Martin et al., 2009; Sellitto et al., 2017, 2018). For instance, the Angström exponent αP (440–1020 nm) and turbidity βP estimated from Microtops observations during the Pacaya volcanic eruption (14.2∘ N, 90.4∘ W; Guatemala) in 2011 were 1.4±0.7 and 0.05±0.07 on average respectively. Figure 10b depicts the AODP evolution during the day when the plume reached the Gobabeb site. Over this site, the time evolution of AODP is characterized by both an increase in the volcanic aerosol burden at all wavelengths and a wavelength dependence on 1 May. Thus, higher AODp values were observed in the UV range (ranging from 0.04 to 0.15) than in the NIR range (ranging from 0.03 to 0.05). The Angström exponent αP ranged between 0.3 and 1.5 with a mean value of 1.1±0.75. This suggests that the particle size distribution of the plume was not homogenous (Fig. 10b). The plume then progressively moved away, resulting in a weaker signal that lead to a decrease in βP and a more scattered αP. The increase in the Angström exponent αP is correlated with the Angström turbidity βP (ranging from 0.025 to 0.050; Fig. 10d). This correlation suggests the presence of a thin aerosol layer dominated by smaller particles over the Gobabeb site. These Angström coefficient values are also consistent with the ash-free plume spread over the Gobabeb site on 1 May (Fig. 10d).

Figure 10The time evolution of the plume-isolated AOD in the UV–NIR wavelength versus the Angström exponent (380–1020 nm) (a) for 29 April over Neuquén and (b) for 1 May over Gobabeb. The time evolution of the Angström turbidity versus the Angström exponent (380–1020 nm) (c) for 29 April over Neuquén and (d) for 1 May over Gobabeb.
Table 4The mean and standard deviation for the plume-isolated Angström exponent and turbidity from 24 to 30 April for the Bariloche, Neuquén, Buenos Aires, and São Paulo sites. These values are obtained from sun photometer measurements. The empty grids indicate that no observations were available.
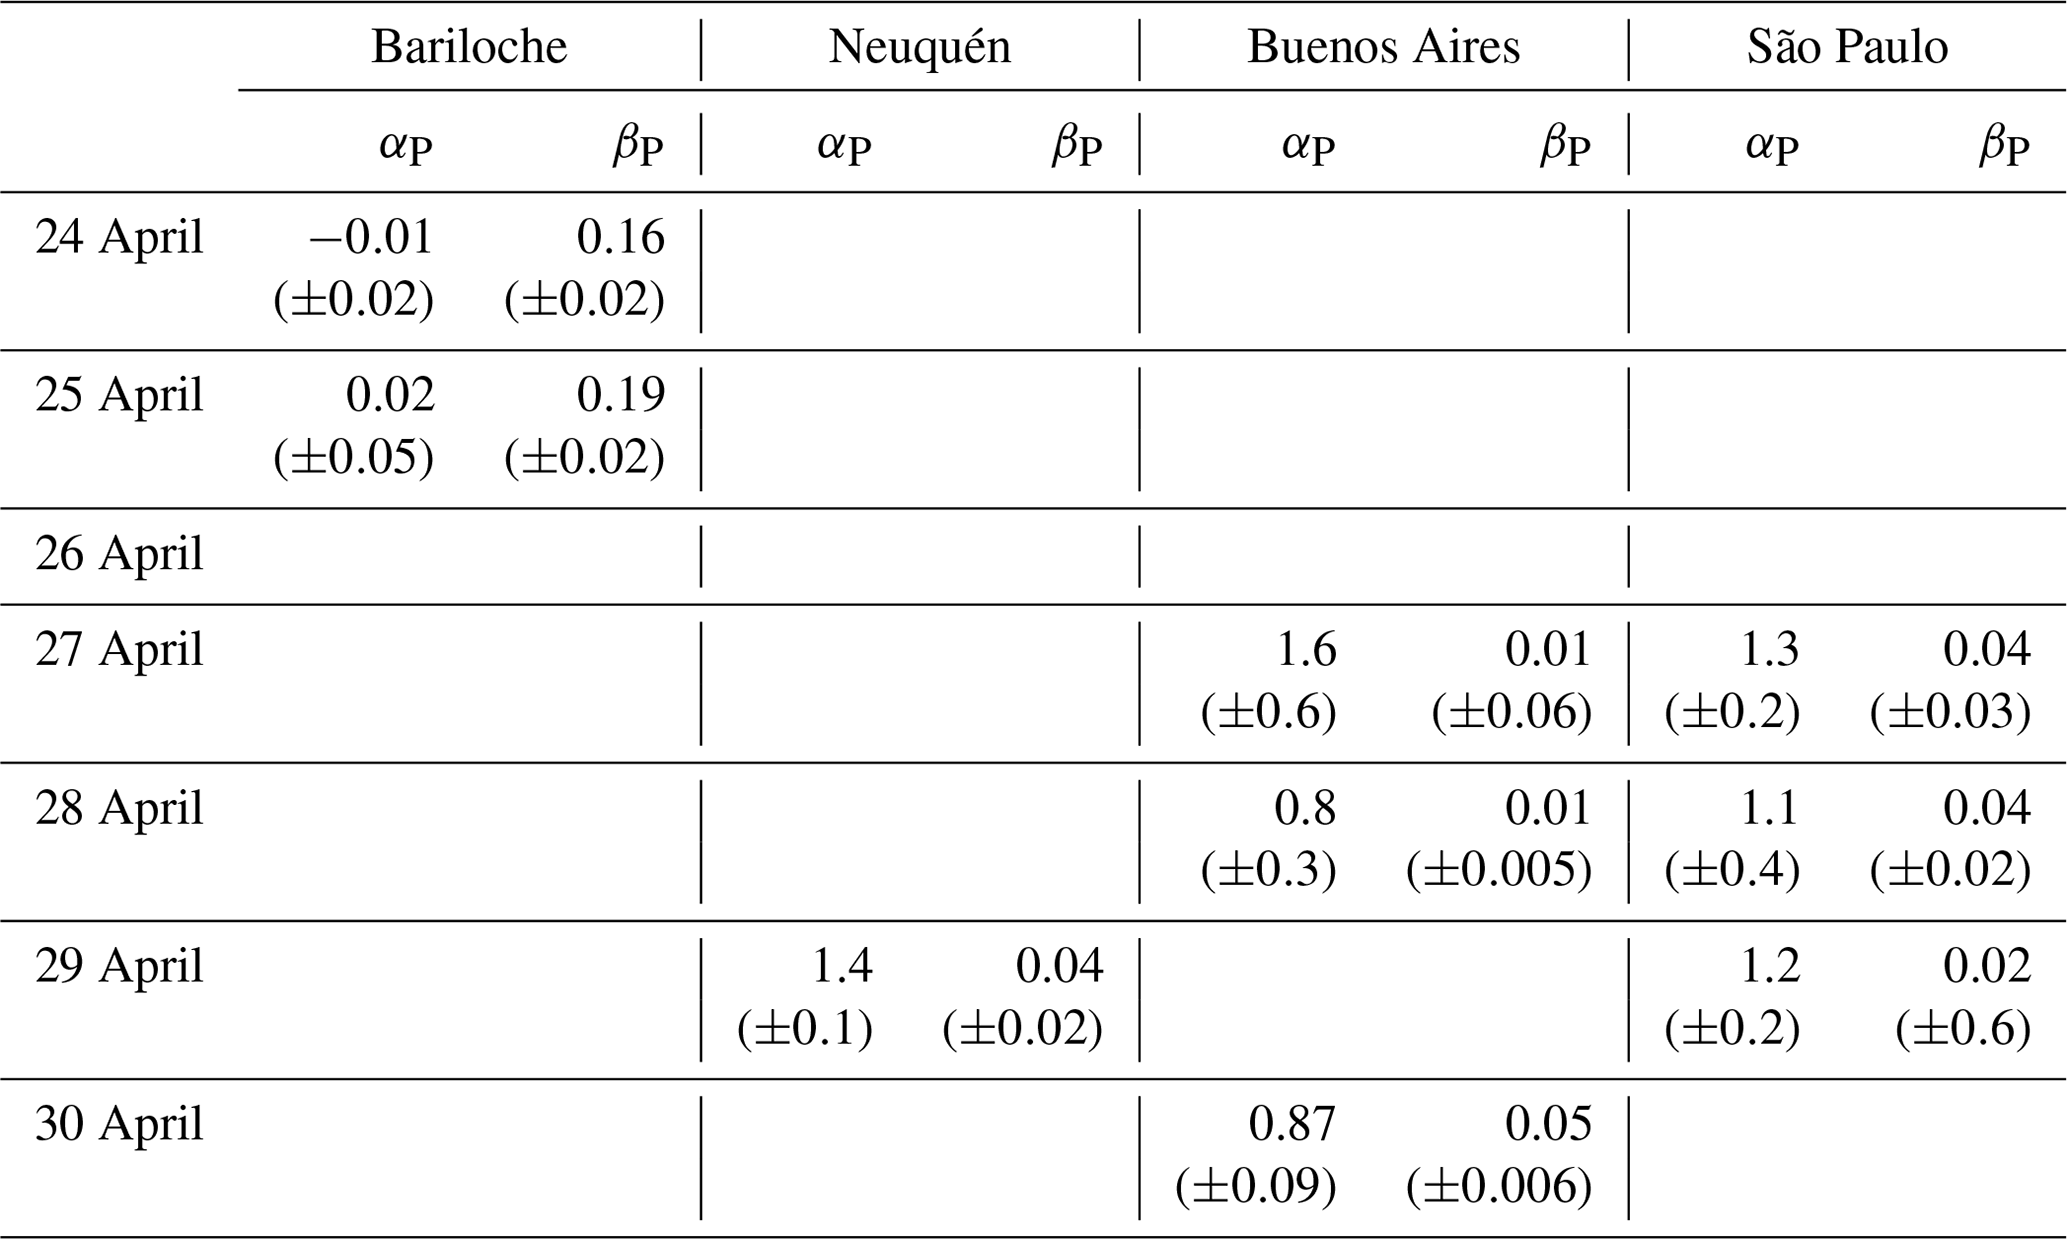
Table 5The mean and standard deviation for the plume-isolated Angström exponent and turbidity from 1 to 8 May for the Gobabeb, Pretoria, and Durban sites. The empty grids indicate that no observations were available.
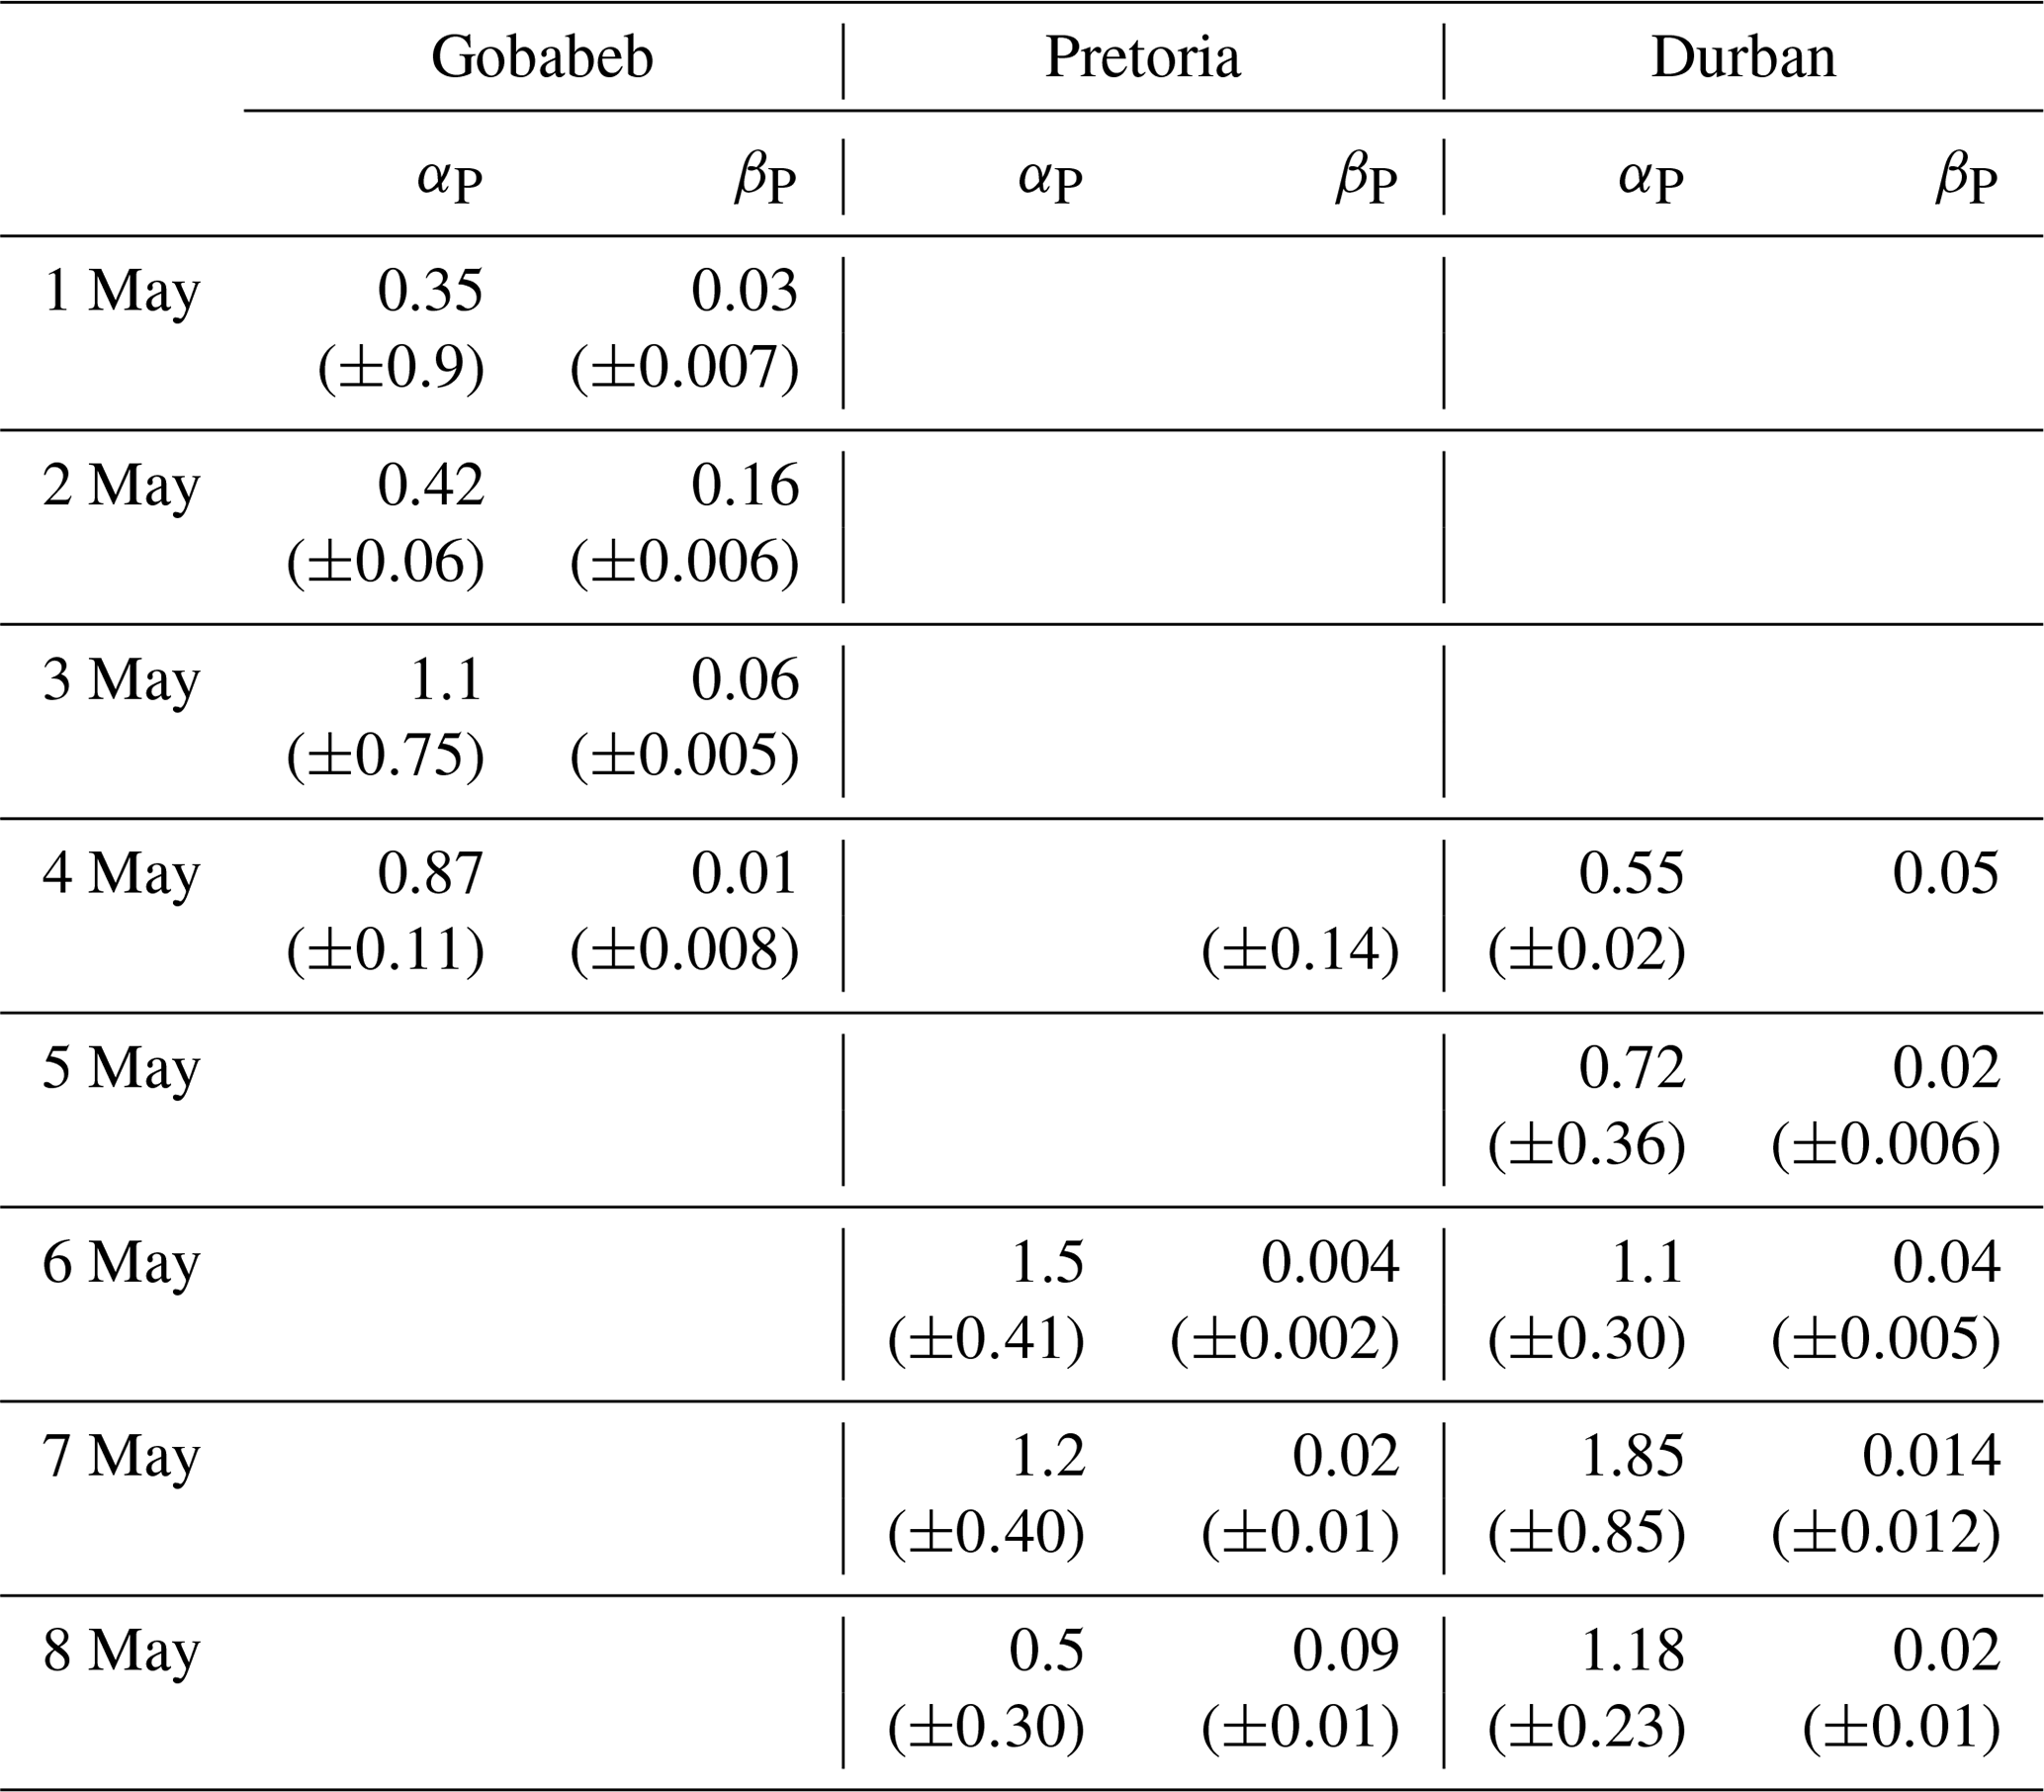
Overall, the ash-bearing air mass is characterized by a thick plume containing large particles (αP<0.30 and βP>0.16) that are mainly located near the Calbuco site (at sites such as Bariloche) during the first few days after the eruption (24–25 April). Due to the sedimentation process, these large ash particles fall out quickly close to the source region. The fraction that survives the near-source fall-out processes are then transported over long distance. Hence, sites further from the Calbuco volcano are influenced by this ash-free air mass characterized by a thin plume composed of small particles (αP≥0.3 and βP<0.15). These results are consistent with previous studies indicating that the volcanic plume is dominated by larger particles near the source (Hobbs et al., 1982; Rose et al., 2000; Watson and Oppenheimer, 2000; Webster et al., 2012). Rose et al. (1982) showed that this phenomenon could be explained by competing mechanisms involving the adsorption of smaller particles by ash. As reported by Sparks et al. (1997), aggregation processes are more important near the source. The evolution of the plume thickness obtained from sun photometer observations are consistent with the evolution obtained from CALIOP observations and those presented in Sect. 3. Furthermore, the time evolution of the optical characteristics of the plume over the selected sites was also analysed via the estimation of the Angström coefficients. Their mean values are reported in Tables 4 and 5. Over the selected sites, the Angström turbidity βP does not evolve significantly over time and is less than 0.06 on average. The Angström exponent αP tends to decrease slightly over time with the exception of the São Paulo site where it remains fairly constant (ranging from 1.1 to 1.3). These values are in agreement with the Angström exponent αP retrieved from lidar observations over São Paulo (Lopes et al., 2019). The slight decrease is clearly visible at the Buenos Aires, Gobabeb, and Durban sites where the Angström exponent αP is roughly half the above-mentioned values and reaches a value lower than 0.6 on average (Tables 4, 5). These low Angström coefficient values suggest that the plume evolves over time so that large particles dominate the distribution with a lower optical depth. The decrease in the Angström exponent αP could be due to enhanced particle growth in the plume induced by microphysical processes such as aggregation or coagulation. The balance between growth and removal processes impacts the residence time of the volcanic plume and its size distributions. Moreover, the time evolution of the optical properties of the volcanic plume over the selected sites could also be explained by the dynamical context. Indeed, the ageing of an aerosol plume is a complex mechanism controlled by many parameters (Bègue et al., 2012; Guermazi et al., 2019).
The influence of the Calbuco eruption on the total columnar aerosol optical properties in the Southern Hemisphere has been presented in this investigation. The study mainly focuses on the analysis of the sun photometer measurements performed at six South American and three African sites. Satellite observations (MODIS, OMI, and CALIOP) were combined with ground-based observations (sun photometer and lidar). Moreover, a back-trajectory model (HYSPLIT) was used in order to investigate the transport of the volcanic plume. The spatio-temporal evolution of the volcanic plume obtained from satellite observations was found to be consistent with ground-based time series and was also in agreement with previous works. It is found that the majority of the plume aerosols were injected up to the lower stratosphere and propagated towards South Africa during the week following the eruption. The spread of the plume over the northeastern parts of South America was associated with a decrease in thickness. The satellite observations pointed out that the southern parts of Argentina were not influenced by the volcanic plume during the first few weeks following the eruption. The synergy between the space-based and ground-based observations has allowed for further description of the plume over the southern parts of South America.
The statistical analysis applied to the sun photometer and MODIS observations emphasized the presence of a north–south decreasing gradient in the background AOD values over the South American region. The highest AOD values were observed at the São Paulo and Buenos Aires sites, which are the most industrialized regions of the selected South American sites. The statistical detection of the plume agreed with the chronology of the plume transport obtained from satellite observations. Moreover, this statistical approach revealed that the plume also impacted the southern parts of South America, albeit to a lesser extent. The anomalies induced by the transport of the Calbuco plume on the total columnar aerosol optical properties were statistically evaluated in the mid-visible wavelength. The highest AOD anomalies are observed over the northeastern parts of the South America. Given its proximity to the Calbuco volcano, the Bariloche site was the most impacted by the volcanic plume with daily AOD anomalies ranging from 35 % to 85 %. Over the South African sites, the AOD anomalies induced by the dispersion of the plume were homogeneously distributed. The observed contrast between the South American and African regions was highlighted by the extinction values from CALIOP observations.
From the spectral variability of the plume, only the AOD was analysed from the UV–NIR spectral range. The optical characteristics of the plume near the source region are consistent with an ash-bearing plume. This spectral analysis of the plume reveals the evolution of its optical properties over sites that are located further from the Calbuco volcano. Thus, the Angström coefficient values are consistent with an ash-free plume over these sites. The optical evolution of the volcanic plume during its transport was in agreement with previous works (Hobbs et al., 1982; Rose et al., 2000; Watson and Oppenheimer, 2000; Webster et al., 2012; Sellitto et al., 2018) and can be explained by microphysical processes as well as by dynamics (Baker et al., 2014; Bègue et al., 2017; Guermazi et al., 2019; Nimgomba et al., 2019). The Angström coefficients were useful to obtain a first estimation of the optical characteristics and the size distribution of the aerosol plume. Nevertheless, the Angström coefficients were not sufficient to describe the ageing of the aerosols plume during its transport in detail. The parameters that contributed to the ageing of the Calbuco plume require further investigation and will form the basis for a forthcoming study.
The aerosol optical properties from ground-based (sun photometer) and satellite (MODIS and CALIOP) observations are available on-line from the sources listed in the paper. The sulfur dioxide measurements from OMI observations are available on-line from the sources listed in the paper. The lidar data recorded at Bariloche are available from the Servicio Meteorológico Nacional upon request.
NB analysed the sun photometer measurements and performed the back-trajectory analysis using the HYSPLIT model. LS contributed to the MODIS and CALIOP data analysis and interpretation. VS analysed the sulfur dioxide measurements from the OMI observations. JP was responsible for the retrieval of the aerosol optical properties from lidar observations. All authors contributed to data analysis and interpretation as well as to the preparation of the paper.
The authors declare that they have no conflict of interest.
We thank Eduardo Quel, Lidia Otero, Paulo Artaxo, Brent Holben, Salvador Jacobo, Stuart Piketh, Gillian Maggs-Kolling, Derek Griffith, Sivakumar Venkataraman, and their staff for establishing and maintaining the Bariloche, Neuquén, Buenos Aires, São Paulo, Comodoro, Rio Gallegos, Gobabeb, Pretoria, and Durban sites used in this investigation (http://aeronet.gsfc.nasa.gov/, last access: 5 March 2020). The authors would like to thank the members of the Servicio Meteorológico Nacional (SMN) for their contribution to data acquisition over South America. The authors are grateful to JICA (Japan International Cooperation Agency) and JST (Japan Science and Technology Agency) for the funding support of SAVER-Net (South American Environmental Risk-Network). The MODIS observations used in this paper were produced using the GIOVANNI online data system, which is developed and maintained by NASA GES DISC (https://giovanni.gsfc.nasa.gov/giovanni/, last access: 10 January 2020). We would like to acknowledge the OMI (http://disc.sci.gsfc.nasa.gov/Aura/data-holdings/OMI, last access: 15 January 2020) and CALIPSO (http://www.https.com//:eosweb.larc.nasa.gov/, last access: 10 January 2020) programmes for providing access to data via their websites. The authors especially want to thank the staff members of CEILAP (Centro de Investigaciones en Láseres y Aplicaciones), who work on the lidar system at the Bariloche site. The authors gratefully acknowledge the NOAA Air Resources Laboratory (ARL) for the provision of the HYSPLIT transport and dispersion model and/or READY website (http://www.ready.noaa.gov, last access: 5 January 2020) used in this publication.
This paper was edited by Petr Pisoft and reviewed by two anonymous referees.
The authors acknowledge the South African–French PROTEA programme (project no. 42470VA) and CNRS-NRF LIA ARSAIO (Atmospheric Research in Southern Africa and Indian Ocean) for supporting the research activities. This work was supported by the French–Argentine ECOS-Sud A16U01 project and the Université de la Réunion through the federation Observatoire des Milieux Naturels et des Changements Globaux (OMNCG) of the OSU-R (Observatoire des Sciences de l'Univers – La Reunion).
Abdou, W. A., Diner, D. J., Martonchik, J. V., Bruegge, C. J., Kahn, R. A., Gaitley, B. J., Crean, K. A., Remer, L. A., and Holben, B.: Comparison of coincident Multiangle Imaging Spectroradiometer and Moderate Resolution Imaging Spectroradiometer aerosol optical depths over land and ocean scenes containing Aerosol Robotic Network sites, J. Geophys. Res.-Atmos., 110, https://doi.org/10.1029/2004JD004693, 2005.
Andreae, M. O., Rosenfeld, D., Artaxo, P., Costa, A. A., Frank, G. P., Longo, K. M., and Silva-Dias, M. A. F. D.: Smoking rain clouds over the Amazon, Science, 303, 1337–1342, 2004.
Angström, A.: The parameters of atmospheric turbidity, Tellus, 16, 64–75, 1964.
Alam, K., Qureshi, S., and Blaschke, T.: Monitoring spatio-temporal aerosol patterns over Pakistan based on MODIS, TOMS, and MISR satellite data and a HYSPLIT model, Atmos. Environ., 45, 4641–4651, 2011.
Baddock, M. C., Bullard, J. E., and Bryant, R. G.: Dust source identification using MODIS: A comparison of techniques applied to the Lake Eyre Basin, Australia, Remote Sens. Environ., 113, 1511–1528, https://doi.org/10.1016/j.rse.2009.03.002, 2009.
Baker, A. R., Laskina, O., and Grassian, V. H.: Processing and Ageing in the Atmosphere, in: Mineral dust, Springer, Dordrecht, 75–92, 2014.
Bennouna, Y. S., Cachorro, V. E., Torres, B., Toledano, C., Berjón, A., de Frutos, A. M., and Alonso Fernández, C. I.: Atmospheric turbidity determined by the annual cycle of the aerosol optical depth over north-center Spain from ground (AERONET) and satellite (MODIS), Atmos. Environ., 67, 352–364, 2013.
Bègue, N., Tulet, P., Chaboureau, J. P., Roberts, G., Gomes, L., and Mallet, M.: Long-range transport of Saharan dust over northwestern Europe during EUCAARI 2008 campaign: Evolution of dust optical properties by scavenging, J. Geophys. Res.-Atmos., 117, https://doi.org/10.1029/2012JD017611, 2012.
Bègue, N., Vignelles, D., Berthet, G., Portafaix, T., Payen, G., Jégou, F., Bencherif, H., Jumelet, J., Vernier, J. P., Lurton., T., Renard, J. B., Clarisse., L., Duverger, V., Posny, F., Metzger, J. M., and Godin-Beekmann, S.: Long-range isentropic transport of stratospheric aerosols over Southern Hemisphere following the Calbuco eruption in April 2015, 15019–15036, https://doi.org/10.5194/acp-17-15019-2017, 2017.
Bhartia, P. K.: OMI Algorithm Theoretical Basis Document Volume II, OMI Ozone Products, ATBD-OMI-02, Version 2.0, 2002.
Bourassa, A. E., Degenstein, D. A., Elash, B. J., and Llewellyn, E. J.: Evolution of the stratospheric aerosol enhancement following the eruptions of Okmok and Kasatochi: Odin-OSIRIS measurements, J. Geophys. Res.-Atmos., 115, D00L03, https://doi.org/10.1029/2009JD013274, 2010.
Bourassa, A. E., McLinden, C. A., Bathgate, A. F., Elash, B. J., and Degenstein, D. A.: Precision estimate for Odin-OSIRIS limb scatter retrievals, J. Geophys. Res.-Atmos., 117, D04303, https://doi.org/10.1029/2011JD016976, 2012.
Bréon, F. M., Vermeulen, A., and Descloitres, J.: An evaluation of satellite aerosol products against sunphotometer measurements, Remote Sens. Environ., 115, 3102–3111, 2011.
Carn, S., Clarisse, L., and Prata, A. J.: Multi-decadal satellite measurements of global volcanic degassing, J. Volcanol. Geoth. Res., 311, 99–134, 2016.
Chen, B., Stein, A. F., Castell, N., de la Rosa, J. D., Sanchez de la Campa, A. M., Gonzalez-Castanedo, Y., and Draxler, R. R.: Modeling and surface observations of arsenic dispersion from a large Cu-smelter in southwestern Europe, Atmos. Environ., 49, 114–122, https://doi.org/10.1016/j.atmosenv.2011.12.014, 2012.
Chu, D. A., Kaufman, Y. J., Ichoku, C., Remer, L. A., Tanré, D., and Holben, B. N.: Validation of MODIS aerosol optical depth retrieval over land, Geophys. Res. Lett., 29, 1617, https://doi.org/10.1029/2001GL013205, 2002.
Clarisse, L., Hurtmans, D., Clerbaux, C., Hadji-Lazaro, J., Ngadi, Y., and Coheur, P.-F.: Retrieval of sulphur dioxide from the infrared atmospheric sounding interferometer (IASI), Atmos. Meas. Tech., 5, 581–594, https://doi.org/10.5194/amt-5-581-2012, 2012.
D'Amico, G., Amodeo, A., Mattis, I., Freudenthaler, V., and Pappalardo, G.: EARLINET Single Calculus Chain – technical – Part 1: Pre-processing of raw lidar data, Atmos. Meas. Tech., 9, 491–507, https://doi.org/10.5194/amt-9-491-2016, 2016.
Das, S., Dey, S., Dash, S. K., Giuliani, G., and Solmon, F.: Dust aerosol feedback on the Indian summer monsoon: Sensitivity to absorption property, J. Geophys. Res.-Atmos., 120, 9642–9652, 2015.
Deshler, T., Adriani, A., Gobbi, G. P., Hofmann, D. J., Di Donfrancesco, G., and Johnson, B. J.: Volcanic aerosol and ozone depletion within the Antarctic polar vortex during the austral spring of 1991, Geophys. Res. Lett., 19, 1819–1822, 1992
Diaz, S. B., Paladini, A. A., Braile, H. G., Dieguez, M. D. C., Deferrari, G. A., Vernet, M., and Vrsalovic, J.: Global and direct UV irradiance variation in the Nahuel Huapi National Park (Patagonia, Argentina) after the eruption of Puyehue-Cordon Caulle (Chile), J. Atmos. Sol.-Terr. Phy., 112, 47–56, 2014.
Dubovik, O. and King, M. D.: A flexible inversion algorithm for retrieval of aerosol optical properties from Sun and sky radiance measurements, J. Geophys. Res.-Atmos., 105, 20673–20696, 2000.
Dubovik, O., Smirnov, A., Holben, B. N., King, M. D., Kaufman., Y. J., Eck, T. F., and Slutsker, I.: Accuracy assessments of aerosol optical properties retrieved from Aerosol Robotic Network (AERONET) sun and sky radiance measurements, J. Geophys. Res.-Atmos., 105, 9791–9806, 2000.
Dubovik, O., Sinyuk, A., Lapyonok, T., Holben, B. N., Mishchenko, M., Yang, P., Eck, T. F., Volten, H., Muñoz, O., Veihelman, B., Van der Zande, W. J., Leon, J. F., Sorokin, M., and Slutsker, I.: Application of spheroid models to account for aerosol particle nonsphericity in remote sensing of desert dust, J. Geophys. Res.-Atmos., 111, D11208, https://doi.org/10.1029/2005JD006619, 2006.
Draxler, R. R. and Rolph, G. D.: HYSPLIT (Hybrid Single Particle Lagragian Integrated Trajectory), Air Resources Laborator, National Oceanic and Atmospheric Administration, Silver Spring, available at: http://www.arl.noaa.gov/ready/hysplit4.html (last access: 5 January 2020), 2003.
Eck, T. F., Holben, B., Ward, D., Mukelabai, M., Dubovik, O., Smirnov, A., Schafer, J., Hsu, N., Piketh, S., and Queface, A.: Variability of biomass burning aerosol optical characteristics in southern Africa during the SAFARI 2000 dry season campaign and a comparison of single scattering albedo estimates from radiometric measurements, J. Geophys. Res.-Atmos., 108, https://doi.org/10.1029/2002JD002321, 2003.
Eck, T. F., Holben, B. N., Dubovik, O., Smirnov, A., Glob, P., Chen, H. B., Chatenet, B., Gomes, L., Zhang, X. Y., Tsay, S. C., Ji, Q., Giles, D., and Slutsker, I.: Columnar aerosol optical properties at AERONET sites in central eastern Asia and aerosol transport to the tropical mid-Pacific, J. Geophys. Res.-Atmos., 110, D06202, https://doi.org/10.1029/2004JD005274, 2005.
El-Metwally, M., Alfaro, S. C., Abdel Wahab, M. M., Zakey, A. S., and Chatenet, B.: Seasonal and inter-annual variability of the aerosol content in Cairo (Egypt) as deduced from the comparison of MODIS aerosol retrievals with direct AERONET measurements, Atmos. Res., 97, 14–25, https://doi.org/10.1016/j.atmosres.2010.03.003, 2010.
Fernald, F. G.: Analysis of atmospheric lidar observations: some comments, Appl. Opt., 23, 652–653, 1984.
Freitas, S. R., Longo, K. M., Silva Dias, M. A. F., Chatfield, R., Silva Dias, P., Artaxo, P., Andreae, M. O., Grell, G., Rodrigues, L. F., Fazenda, A., and Panetta, J.: The Coupled Aerosol and Tracer Transport model to the Brazilian developments on the Regional Atmospheric Modeling System (CATT-BRAMS) – Part 1: Model description and evaluation, Atmos. Chem. Phys., 9, 2843–2861, https://doi.org/10.5194/acp-9-2843-2009, 2009.
Fioletov, V. E., McLinden, C. A., Krotkov, N., Li, C., Joiner, J., Theys, N., Carn, S., and Moran, M. D.: A global catalogue of large SO2 sources and emissions derived from the Ozone Monitoring Instrument, Atmos. Chem. Phys., 16, 11497–11519, https://doi.org/10.5194/acp-16-11497-2016, 2016.
Fyfe, J. C., Salzen, K., Cole, J. N. S., Gillett, N. P., and Vernier, J. P.: Surface response to stratospheric aerosol changes in a coupled atmosphere–ocean model, Geophys. Res. Lett., 40, 584–588, https://doi.org/10.1002/grl.50156, 2013.
Garstang, M., Tyson, P. D., Swap, R., Edwards, M., Kållberg, P., and Lindesay, J. A.: Horizontal and vertical transport of air over southern Africa, J. Geophys. Res.-Atmos, 101, 23721–23736, 1996.
Gassmann, M. I. and Mazzeo, N. A.: Air pollution potential: Regional study in Argentina, Environ. Manage., 25, 375–382, 2000.
Gooding, J. L., Clanton, U. S., Gabel, E. M., and Warren, J. L.: El Chichón volcanic ash in the stratosphere: particle abundances and size distributions after the 1982 eruption, Geophys. Res. Lett., 10, 1033–1036, 1983.
Guermazi, H., Sellitto, P., Serbaji, M. M., Legras, B., and Rekhiss, F.: Assessment of the Combined Sensitivity of Nadir TIR Aerosols Satellite Observations after a Moderate to Volcanic Stratospheric SO2 and Eruption, Volcanic Plumes: Impacts on the Atmosphere and Insights into Volcanic Processes, 7, 84, https://doi.org/10.3390/geosciences7030084, 2019.
Hao, W. M., Ward, D. E., Susott, R. A., Babbitt, R. E., Nordgren, B. L., Kaufman, Y. J., Holben, B. N., and Giles, D. M.: Comparison of aerosol optical thickness measurements by MODIS, AERONET sun photometers, and Forest Service handheld sun photometers in southern Africa during the SAFARI 2000 campaign, Int. J. Remote Sens., 26, 4169–4183, 2005.
Hauser, A., Oesch, D., and Foppa, N.: Aerosol optical depth over land: Comparing AERONET, AVHRR and MODIS, Geophys. Res. Lett., 32, L17816, https://doi.org/10.1029/2005GL023579, 2005.
Haywood, J. M., Jones, A., and Jones, G. S.: The impact of volcanic eruptions in the period 2000–2013 on global mean temperature trends evaluated in the HadGEM2-ES climate model, Atmos. Sci. Lett., 15, 92–96, https://doi.org/10.1002/asl2.471, 2013.
Hobbs, P. V., Tuell, J. P., Hegg, D. A., Radke, L. F., and Elgroth, M. W.: Particles a nd gases from the 1980–1981 volcanic eruptions of Mr. St. Helens, J. Geophys. Res.-Atmos., 87, 11062–12086, 1982.
Hoelzemann, J. J., Longo, K. M., Fonseca, R. M., Do Rosá Rio, N. M., Elbern, H., Freitas, S. R., and Pires, C.: Regional representativity of AERONET observation sites during the biomass burning season in South America determined by correlation studies with MODIS Aerosol Optical Depth, J. Geophys. Res.-Atmos., 114, D13301, https://doi.org/10.1029/2008JD010369, 2009.
Ichoku, C., Remer, L. A., and Eck, T. F.: Quantitative evaluation and intercomparison of morning and afternoon Moderate Resolution Imaging Spectroradiometer (MODIS) aerosol measurements from Terra and Aqua, J. Geophys. Res.-Atmos., 110, https://doi.org/10.1029/2004JD004987, 2005.
Ivy, D. J., Solomon, S., Kinnison, D., Mills, M. J., Schmidt, A., and Neely III, R. R.: The influence of the Calbuco eruption on the 2015 Antarctic ozone hole in a fully coupled chemistry-climate model, Geophys. Res. Lett., 44, 2556–2561, https://doi.org/10.1002/2016GL071925, 2017.
Kharol, S. K., Badarinath, K. V. S., Sharma, A. R., Kaskaoutis, D. G., and Kambezidis, H. D.: Multiyear analysis of Terra/Aqua MODIS aerosol optical depth and ground observations over tropical urban region of Hyderabad, India, Atmos. Environ., 45, 1532–1542, https://doi.org/10.1016/j.atmosenv.2010.12.047, 2011.
Koffman, B. G., Dowd, E. G., Osterberg, E. C., Ferris, D. G., Hartman, L. H., Wheatley, S. D., Kurbatov, A. V., Wong, G. J., Markle, B. R., Dunbar, N. W., Kreutz, K. J., and Yates, M.: Rapid transport of ash and sulfate from the 2011 Puyehue-Cordón Caulle (Chile) eruption to West Antarctica, J. Geophys. Res.-Atmos., 122, 8908–8920, 2017.
Kravitz, B., Robock, A., and Bourassa, A.: Negligible climatic effects from the 2008 Okmok and Kasatochi volcanic eruptions, J. Geophys. Res.-Atmos., 115, D00L05, https://doi.org/10.1029/2009JD013525, 2010.
Kravitz, B., Robock, A., Bourassa, A., Deshler, T., Wu, D., Mattis, I., Finger, F., Hoffmann, A., Ritter, C., Bitar, L., Duck, T. J., and Barnes, J. E.: Simulation and observations of stratospheric aerosols from the 2009 Sarychev volcanic eruption, J. Geophys. Res.-Atmos., 116, D18211, https://doi.org/10.1029/2010JD015501, 2011.
Kristiansen, N. I., Prata, A. J., Stohl, A., and Carn, S. A.: Stratospheric volcanic ash emissions from the 13 February 2014 Kelut eruption, Geophys. Res. Lett., 42, 588–596, https://doi.org/10.1002/2014GL062307, 2015.
Krotkov, N. A., McLinden, C. A., Li, C., Lamsal, L. N., Celarier, E. A., Marchenko, S. V., Swartz, W. H., Bucsela, E. J., Joiner, J., Duncan, B. N., Boersma, K. F., Veefkind, J. P., Levelt, P. F., Fioletov, V. E., Dickerson, R. R., He, H., Lu, Z., and Streets, D. G.: Aura OMI observations of regional SO2 and NO2 pollution changes from 2005 to 2015, Atmos. Chem. Phys., 16, 4605–4629, https://doi.org/10.5194/acp-16-4605-2016, 2016.
Kumar, K. R., Kang, N., Sivakumar, V., and Griffith, D.: Temporal characteristics of columnar aerosol optical properties and radiative forcing (2011–2015) measured at AERONET's Pretoria_CSIR_DPSS site in South Africa, Atmos. Environ., 165, 274–289, 2017.
Labitzke, K. and McCormick, M.: Stratospheric temperature increases due to Pinatubo aerosols, Geophys. Res. Lett., 19, 207–210, 1992.
Lehahn, Y., Koren, I., Boss, E., Ben-Ami, Y., and Altaratz, O.: Estimating the maritime component of aerosol optical depth and its dependency on surface wind speed using satellite data, Atmos. Chem. Phys., 10, 6711–6720, https://doi.org/10.5194/acp-10-6711-2010, 2010.
Li, F., Ginoux, P., and Ramaswamy, V.: Transport of Patagonian dust to Antarctica, J. Geophys. Res.-Atmos., 115, D18217, https://doi.org/10.1029/2009JD012356, 2010.
Li, C., Joiner, J., Krotkov, N. A., and Bhartia, P. K.: A fast and sensitive new satellite SO2 retrieval algorithm based on principal component analysis: application to the ozone monitoring instrument, Geophys. Res. Lett., 32, 6314–6318, 2013.
Lopes, F. J. S, Mariano, G. L., Landulfo, E., and Mariano, E. V. C.: Impacts of Biomass Burning in the Atmosphere of the Southeastern Region of Brazil Using Remote Sensing Systems, Atmospheric Aerosols – Regional Characteristics – Chemistry and Physics, Hayder Abdul-Razzak, IntechOpen, https://doi.org/10.5772/50406, 2012.
Lopes, J. S., Silva, F., Antuña Marrero, J. J., Taha, J. C., and Landulfo, E.: Synergetic Aerosol Layer Observation after the 2015 Calbuco Volcanic Eruption Event, Remote Sens., 11, rs11020195, https://doi.org/10.3390/rs11020195, 2019.
Madry, W. L., Toon O. B., and O'Dowd, C. D.: Modeled optical thickness of sea-salt aerosol, J. Geophys. Res.-Atmos., 116, D08211, https://doi.org/10.1029/2010JD014691, 2011.
Mather, T. A., Tsanev, V. I., Pyle, D. M., McGonigle, A. J. S., Oppenheimer, C., and Allen, A. G.: Characterization and evolution of tropospheric plumes from Lascar and Villarrica volcanoes, Chile, J. Geophys. Res.-Atmos., 109, D21303, https://doi.org/10.1029/2004JD004934, 2004.
Martin, R. S., Mather, T. A., Pyle, D. M., Power, M., Tsanev, V. I., Oppenheimer, C., Allen, A. G., Horwell, C. J., and Ward, E. P. W.: Size distributions of fine silicate and other particles in Masaya's volcanic plume, J. Geophys. Res.-Atmos., 114, D09217, https://doi.org/10.1029/2008JD011211, 2009.
McCormick, M. P., Thomason, L. W., and Trepte, C. R.: Atmospheric effects of the Mt Pinatubo eruption, Nature, 373, 399–404, 1995.
More, S., Kumar, P. P., Gupta, P., Devara, P. C. S., and Aher, G.: Comparison of aerosol products retrieved from AERONET, MICROTOPS, and MODIS over a tropical urban city, Pune, India, Aerosol. Air. Qual. Res., 13, 107–121, 2013.
Mills, M. J., Schmidt, A., Easter, R., Solomon, S., Kinnison, D. E., Ghan, S. J., Neely III., R. R., Marsh., D. R., Conley, A., Bardeen, C. G., and Gettelman., A.: Global volcanic aerosol properties derived from emissions, 1990–2014, using CESM1 (WACCM), J. Geophys. Res.-Atmos., 121, 2332–2348, https://doi.org/10.1002/2015JD024290, 2016.
Neely III, R. R., Toon, O. B., Solomon, S., Vernier, J. P., Alvarez, C., English, E. M., Rosenlof, K. H., Mills, J. M., Bardeen, C. G., Daniel, J. S., and Thayer, J. P.: Recent anthropogenic increases in SO2 from Asia have minimal impact on stratospheric aerosol, Geophys. Res. Lett., 32, 999–1004, https://doi.org/10.1002/grl.50263, 2013.
Ningombam, S. S., Larson, E. J. L., Dumka, U. C., Estellés, V., Campanelli, M., and Steve, C.: Long-term (1995–2018) aerosol optical depth derived using ground based AERONET and SKYNET measurements from aerosol aged-background sites, Atmos. Pollut. Res., 10, 608–620, 2019.
Omar, M. A, Hu, A. H., Powell, Y., Liu, K. A., Hunt, Z., and Young, W. H.: Overview of the CALIPSO Mission and CALIOP Data Processing Algorithms, J. Atmos. Ocean. Tech., 26, 2310–2323, 2009.
Otero, L. A., Ristori, P. R., Papandrea, S. D., Pallotta, J. V., D'elia, R., L., and Quel, E. J.: Mediciones en la patagonia argentina de espesor óptico de aerosoles con fotómetros solares de la red AERONET, Asociación Física Argentina; Anales AFA, 26, 186–189, 2015.
Piketh, S. J., Annegarn, H. J., and Tyson, P. D.: Lower tropospheric aerosol loadings over South Africa: The relative contribution of aeolian dust, industrial emissions, and biomass burning, J. Geophys. Res.-Atmos., 104, 1597–1607, 1999.
Porter, J. N., Horton, K. A., Mouginis-Mark, P. J., Lienert, B., Sharma, S. K., Lau, E., Sutton, A. J., Elias, T., and Oppenheimer, C.: Sun photometer and lidar measurements of the plume from the Hawaii Kilauea Volcano Pu'u O'o vent: Aerosol flux and SO2 lifetime, Geophys. Res. Lett., 32, 301–304, 2002.
Prasad, A. K. and Singh, R. P.: Comparison of MISR-MODIS aerosol optical depth over the Indo-Gangetic basin during the winter and summer seasons (2000–2005), Remote Sens. Environ. 107, 109–119, 2007.
Reckziegel, F., Bustos, E., Mingari, L., Báez, W., Villarosa, G., Folch, A., Collini., E., Viramonte, J., Romero, J., and Osores, S.: Forecasting volcanic ash dispersal and coeval resuspension during the April–May 2015 Calbuco eruption, J. Volcanol. Geoth. Res., 321, 44–57, 2016.
Ridley, D. A., Solomon, S., Barnes, J. E., Burlakov, V. D., Deshler, T., Dolgii, S. I., Herber, A. B., Nagai, T., Neely III, R. R., Nevzorov, A. V., Ritter, C., Sakai, T., Santer, B. D., Sato, M., Schmidt, A., Uchino, O., and Vernier, J.-P.: Total volcanic stratospheric aerosol optical depths and implications for global climate change, Geophys. Res. Lett., 41, 7763–7769, https://doi.org/10.1002/2014GL061541, 2014.
Ristori, P., Otero, L., Jin, Y., Barja, B., Shimizu, A., Barbero, A., Salvador, J., Bali, J. L., Herrera, M., Etala, P., Acquesta, A., Quel, E., Sugimoto, N., and Mizuno, A.: SAVER.NET LiDAR network in Southern America, EPJ Web of Conferences, 176, 09011, https://doi.org/10.1051/epjconf/201817609011, 2018.
Rose, W. I., Chaun, R. L., and Woods, D. C.: Small particles in the plume of Mr. St. Helens, J. Geophys. Res.-Atmos., 87, 4956–4962, 1982.
Rose, W. I., Bluth, G. J. S., and Ernst, G. G.: Integrating retrievals of volcanic cloud characteristics from satellite remote sensors: a summary, Philos. T. Roy. Soc. A, 358, 1585–1606, 2000.
Sakai, T., Uchino, O., Nagai, T., Liley, B., Morino, I., and Fujimoto, T.: Long-term variation of stratospheric aerosols observed with lidars over Tsukuba, Japan, from 1982 and Lauder, New Zealand, from 1992 to 2015, J. Geophys. Res.-Atmos., 121, 10–283, 2016.
Sangeetha, S. K., Sivakumar, V., and Gebreslasie, M.: Long-range transport of SO2 over South Africa: A case study of the Calbuco volcanic eruption in April 2015, Atmos. Environ., 185, 78–90, 2018.
Sawamura, P., Vernier, J. P., Barnes, J. E., Berkoff, T. A., Welton, E. J., Alados-Arboledas, L., and Lange, D.: Stratospheric AOD after the 2011 eruption of Nabro volcano measured by lidars over the Northern Hemisphere, Environ. Res. Lett., 7, 034013, https://doi.org/10.1088/1748-9326/7/3/034013, 2012.
Sellitto, P., Salerno, G., La Spina, A., Caltabiano, T., Terray, L., Gauthier, P. J., and Briole, P.: A novel methodology to determine volcanic aerosols optical properties in the UV and NIR and Ångström parameters using Sun photometry, J. Geophys. Res.-Atmos., 122, 9803–9815, 2017.
Sellitto, P., Spampinato, L., Salerno, G., and La Spina, A.: Aerosol Optical Properties of Pacaya Volcano Plume Measured with a Portable Sun-Photometer, Geosci., 8, 36, https://doi.org/10.3390/geosciences8020036, 2018.
Shaw, G. E.: Sun photometry, B. Am. Meteorol. Soc., 64, 4–10, 1983.
Shikwambana, L. and Sivakumar, V.: Long-range transport of volcanic aerosols over South Africa: a case study of the Calbuco volcano eruption in Chile during April 2015, S. Afr. Goegr. J., 100, 349–363 https://doi.org/10.1080/03736245.2018.1498383, 2018.
Shi, Y., Zhang, J., Reid, J. S., Holben, B., Hyer, E. J., and Curtis, C.: An analysis of the collection 5 MODIS over-ocean aerosol optical depth product for its implication in aerosol assimilation, Atmos. Chem. Phys., 11, 557–565, https://doi.org/10.5194/acp-11-557-2011, 2011.
Solomon, S., Portmann, R. W., Garcia, R. R., Thomason, L. W., Poole, L. R., and McCormick, M. P.: The role of aerosol variations in anthropogenic ozone depletion at northern midlatitudes, J. Geophys. Res.-Atmos., 101, 6713–6727, 1996.
Solomon, S.: Stratospheric ozone depletion.: A review of concepts and history, Rev. Geophys., 37, 275–316, https://doi.org/10.1029/1999RG900008, 1999.
Solomon, S., Portmann, R. W., Sasaki, T., Hofmann, D. J., and Thompson, D. W. J.: Four decades of ozonesonde measurements over Antarctica, J. Geophys. Res.-Atmos., 110, D21311, https://doi.org/10.1029/2005JD005917, 2005.
Solomon, S., Daniel, J. S., Neely III, R. R., Vernier, J.-P., Dutton, E. G., and Thomason, L. W.: The persistently variable “Background” stratospheric aerosol layer and global climate change, Science, 333, 866–870, https://doi.org/10.1126/science.1206027, 2011.
Solomon, S., Ivy, D. J., Kinnison, D., Mills, M. J., Neely III, R. R., and Schmidt, A.: Emergence of healing in the Antarctic ozone layer, Science, 252, 269–274, https://doi.org/10.1126/science.aae0061, 2016.
Sparks, R. S. J., Bursik, M. I., Carey, S. N., Gilbert, J. S., Glaze, L. S., Sigurdsson, H., and Woods, A. W.: Volcanic Plumes, John Wiley, Chichester, UK, 117–140, 1997.
Stein, A. F., Draxler, R. R., Rolph, G. D., Stunder, B. J. B., Cohen, M. D. and Ngan, F.: NOAA's HYSPLIT atmospheric transport and dispersion modeling system, B. Am. Meteorol. Soc., 96, 2059–2077, 2015.
Stone, K. A., Solomon, S., Kinnison, D. E., Pitts, M. C., Poole, L. R., Mills, M. J., Schmidt, A., Neely III, R. R., Ivy, D., Schwartz, M. J., Vernier, J. P., Johnson, B. J., Tully, M. B., Klekocius, A. R., König-Langlo, G., and Hagiya, S.: Observing the impact of Calbuco volcanic aerosols on south polar ozone depletion in 2015, J. Geophys. Res.-Atmos., 122, 11862–11879, https://doi.org/10.1002/2017JD026987, 2017.
Stunder, B. J. B., Heffter, J. L., and Draxler, R. R.: Airborne volcanic ash forecast area reliability, Weather. Forecast., 22, 1132–1139, https://doi.org/10.1175/WAF1042.1, 2007.
Tie, X. and Brasseur, G.: The response of stratospheric ozone to volcanic eruptions: Sensitivity to atmospheric chlorine loading, Geophys. Res. Lett., 22, 3035–3038, https://doi.org/10.1029/95GL03057, 1995.
Theys, N., DeSmedt, I., VanRoozendael, M., Froidevaux, L., Clarisse, L., and Hendrick, F.: First satellite detection of volcanic OClO after the eruption of Puyehue-Cordón Caulle, Geophys. Res. Lett., 41, 667–672, https://doi.org/10.1002/2013GL058416, 2014.
Thomason, L. W., Pitts, M. C., and Winker, D. M.: CALIPSO observations of stratospheric aerosols: a preliminary assessment, Atmos. Chem. Phys., 7, 5283–5290, https://doi.org/10.5194/acp-7-5283-2007, 2007.
Toth, T. D., Zhang, J., Campbell, J. R., Reid, J. S., Shi, Y., Johnson, R. S., Sirmonv, A., Vaughan, M. A., and Winker, D. M.: Investigating enhanced Aqua MODIS aerosol optical depth retrievals over the mid-to-high latitude Southern Oceans through intercomparison with co-located CALIOP, MAN, and AERONET data sets, J. Geophys. Res.-Atmos., 118, 4700–4714, 2013.
Tomasi, C., Vitale, V., and Tarrozi, L.: Sun-photometric measurements of atmospheric turbidity variation a used by the Pinatubo aerosol cloud in the Himalayan region during the summer periods of 1991 and 1992, Nouvo Cimento, 20, 61–88, 1997.
Torres, O., Chen, Z., Jethva, H., Ahn, C., Freitas, S. R., and Bhartia, P. K.: OMI and MODIS observations of the anomalous 2008–2009 Southern Hemisphere biomass burning seasons, Atmos. Chem. Phys., 10, 3505–3513, https://doi.org/10.5194/acp-10-3505-2010, 2010.
Trickl, T., Giehl, H., Jäger, H., and Vogelmann, H.: 35 yr of stratospheric aerosol measurements at Garmisch-Partenkirchen: from Fuego to Eyjafjallajökull, and beyond, Atmos. Chem. Phys., 13, 5205–5225, https://doi.org/10.5194/acp-13-5205-2013, 2013.
Tripathi, S. N., Dey, S., Chandel, A., Srivastava, S., Singh, R. P., and Holben, B. N.: Comparison of MODIS and AERONET derived aerosol optical depth over the Ganga Basin, India, Ann. Geophys., 23, 1093–1101, 2005.
Vanhellemont, F., Fussen, D., Mateshvili, N., Tétard, C., Bingen, C., Dekemper, E., Loodts, N., Kyrölä, E., Sofieva, V., Tamminen, J., Hauchecorne, A., Bertaux, J.-L., Dalaudier, F., Blanot, L., Fanton d'Andon, O., Barrot, G., Guirlet, M., Fehr, T., and Saavedra, L.: Optical extinction by upper tropospheric/stratospheric aerosols and clouds: GOMOS observations for the period 2002–2008, Atmos. Chem. Phys., 10, 7997–8009, https://doi.org/10.5194/acp-10-7997-2010, 2010.
Vermote, E. F., El Saleous, N., Justice, C. O., Kaufman, Y. J., Privette, J. L., Remer, L., Roger., J. C., and Tanre, D.: Atmospheric correction of visible to middle-infrared EOS-MODIS data over land surfaces: Background, operational algorithm and validation, J. Geophys. Res.-Atmos., 102, 17131–17141, 1997.
Vernier, J.-P., Thomason, L. W., Pommereau, J.-P., Bourassa, A., Pelon, J., Garnier, A., Hauchecorne, A., Blanot, L., Trepte, C., Degenstein, D., and Vargas, F.: Major influence of tropical volcanic eruptions on the stratospheric aerosol layer during the last decade, Geophys. Res. Lett., 38, L12807, https://doi.org/10.1029/2011GL047563, 2011.
Vernier, J. P., Fairlie, T. D., Deshler, T., Natarajan, M., Knepp, T., Foster, K., Weinhold., F. G., Bedka, K. M., Thomason, L., and Trepte, C.: In situ and space-based observations of the Kelud volcanic plume: The persistence of ash in the lower stratosphere, J. Geophys. Res.-Atmos., 121, 11–104, 2016.
Watson, I. M., Oppenheimer, C., Voight, B., Francis, P. W., Clarke, A., Stix, J., Miller, A., Pyle, D. M., Burton, M. R., Young, S. R., Norton, G., Loughlin, S., Darroux, B., and Staff, M. V. O.: The relationship between degassing and ground deformation at Soufriere Hills Volcano, Montserrat, J. Volcanol. Geoth. Res., 98, 117–126, 2000.
Watson, I. M. and Oppenheimer, C.: Photometric observations of Mt. Etna's different aerosol plumes, Atmos. Environ., 35, 3561–3572, 2001.
Webster, H. N., Thomson, D. J., Johnson, B. T., Heard, I. P. C., Turnbull, K., Marenco, F., Kristiansen, N. I., Dorsey, J., Minikin, A., Weinzierl, B., Schumann, U., Sparks, R. S. J., Loughlin, S. C., Hort, M. C., Leadbetter, S. J., Devenish, B. J., Manning, A. J., Witham, C. S., Haywood, J. M., and Golding, B. W.: Operational prediction of ash concentrations in the distal volcanic cloud from the 2010 Eyjafjallajökull eruption, J. Geophys. Res.-Atmos., 117, D00U08, https://doi.org/10.1029/2011JD016790, 2012.
Winker, D. M., Pelon J., Coakley Jr., J. A., Ackerman, S. A., Charlson, R. J., Colarco, P. R., and Wielicki, B. A.: The CALIPSO Mission: A Global 3D View of Aerosols and Clouds, B. Am. Meteorol. Soc., 91, 1211–1230, https://doi.org/10.1175/2010BAMS3009.1, 2010.
Winker, D. M., Tackett, J. L., Getzewich, B. J., Liu, Z., Vaughan, M. A., and Rogers, R. R.: The global 3-D distribution of tropospheric aerosols as characterized by CALIOP, Atmos. Chem. Phys., 13, 3345–3361, https://doi.org/10.5194/acp-13-3345-2013, 2013.
Young, R., Houben, H., and Toon, O.: Radiatively forced dispersion of the Mt. Pinatubo volcanic cloud and induced temperature perturbation in the stratosphere during the first few months following the eruption, Geophys. Res. Lett., 21, 369–372, 1994.
Zhang, J. and Reid, J. S.: MODIS aerosol product analysis for data assimilation: Assessment of over-ocean level 2 aerosol optical thickness retrievals, J. Geophys. Res.-Atmos., 111, D22207, https://doi.org/10.1029/2005JD006898, 2006.
Zuev, V. V., Nevzorov, A. V., Pravdin, V. L., Savelieva, E. S., Gerasimov, V. V., and Burlakov, V. D.: 30-year lidar observations of the stratospheric aerosol layer state over Tomsk (Western Siberia, Russia), 2017.
Zhu, Y., Toon, O. B., Kinnison, D., Harvey, V. L., Mills, M. J., Bardeen, C. G., Pitts, M., Bègue, N., Renard, J. B., Berthet, G., and Jégou, F.: Stratospheric Aerosols, Polar Stratospheric Clouds, and Polar Ozone Depletion After the Mount Calbuco Eruption in 2015, J. Geophys. Res.-Atmos., 123, 12–308, 2018.
Zuev, V. V., Savelieva, E. S., and Parezheva, T. V.: Study of the Possible Impact of the Calbuco Volcano Eruption on the Abnormal Destruction of Stratospheric Ozone over the Antarctic in Spring 2015, Atmos. Ocean. Opt., 31, 665–669, 2018.
- Abstract
- Introduction
- Data and methodology
- Long-range transport of the volcanic plume
- Influence of the Calbuco plume on the total columnar aerosols
- Discussion on the optical characteristics of the volcanic plume
- Summary and conclusion
- Data availability
- Author contributions
- Competing interests
- Acknowledgements
- Review statement
- Financial support
- References