the Creative Commons Attribution 4.0 License.
the Creative Commons Attribution 4.0 License.
 | 18 Sep 2019
Excitation of chorus with small wave normal angles due to beam pulse amplifier (BPA) mechanism in density ducts
Peter A. Bespalov
Olga N. Savina
We examine specific features of the realisation of the beam pulse amplifier (BPA) mechanism of chorus excitation in the density ducts that have a width of the order of 100–300 km with refractive reflection. The dispersion characteristics of whistler emissions in a planar duct under conditions for the fulfilment of the Wentzel–Kramers–Brillouin (WKB) approximation and refractive reflection from the “walls” of the duct are analysed. It is shown that in the enhanced duct, discrete spectral elements of chorus with a narrow angular spectrum along the external magnetic field can be excited at frequencies somewhat lower than half of the electron cyclotron frequency. In the depleted duct at frequencies somewhat higher than half of the electron cyclotron frequency, chorus with a narrow angular spectrum along the magnetic field can be excited. The proposed model explains the possibility of excitation of chorus with small angles of the wave normal when the BPA mechanism is implemented. It is noted that the properties of chorus, such as the intensity and a typical angle of the wave normal, can be different for the lower- and upper-band chorus.


In accordance with the experimental data of the CLUSTER probes and Van Allen Probes, chorus emissions are excited in the “cigar-shaped” region with a length of the order of l = (1–2) 108 cm and average diameter cm (Bell et al., 2009; Agapitov et al., 2017) near the local magnetic field minimum. Usually, the chorus spectrogram is observed in two basic spectral bands somewhat lower and just above half of the minimum electron cyclotron frequency for the magnetic tube in question (see, e.g. a review by Sazhin and Hayakawa, 1992). The relationship of the chorus excitation regions in two spectral bands with background plasma density inhomogeneities across the magnetic field was discussed in Bell et al. (2009). The authors of that paper proposed that the source region for banded chorus consists of whistler-mode ducts of depleted electron density (np) for the upper-band chorus and ducts of enhanced electron density np for the lower-band chorus.
Theoretical aspects of the whistler wave propagation in the magnetospheric ducts have been studied for more than half a century using different approaches (see, e.g. Karpman and Kaufman, 1984; Laird, 1992; Pasmanik and Trakhtengerts, 2005; Sonwalkar, 2006; Woodroffe et al., 2013). Known experimental data make it possible to define concretely the important characteristics of the geophysical situation. For example, according to the data given in Haque et al. (2011), the difference in the plasma density inside and outside the duct is of the order of 10 %–15 %. The wave field of chorus rapidly decays with distance from the duct in the transverse direction. This indicates that the frequency of the working emission mode is not close to the critical frequency of the duct.
In the theoretical and experimental studies of chorus, much attention has been given to determination of the wave normal angles (θ) in the region of excitation of emissions (Muto et al., 1987; Hayakawa et al., 1990; Santolik et al., 2009). In accordance with the THEMIS probe data (Taubenschuss et al., 2014) for the rising and falling tones in the lower band of chorus, electromagnetic emissions were detected more frequently at angles of the order of 20∘, and the range of angles is smaller for the lower frequencies. For the upper-band chorus, the angles of the wave normal are also of the order of 20∘ and decrease at the higher frequencies. Let us note that the algorithm of the wave normal angle calculation (Taubenschuss et al., 2014) is based on the assumption that the experimental data offer a single, planar whistler-mode electromagnetic wave in a cold homogeneous plasma. In the duct, a standing wave structure occurs across the magnetic field. It corresponds to two counter-propagating waves. This should probably be taken into account within the framework of the concept of a wave distribution function (Muto et al., 1987; Hayakawa et al., 1990).
The growth rate (γ) of chorus emission modification is very high (Santolik and Gurnett, 2003) and can correspond to γ≈100 s−1. According to experimental data and the results of numerical calculations (Li et al., 2011), for the achievement of a cyclotron instability growth rate of this order, high anisotropy of the distribution function of energetic electrons in the excitation region is necessary. According to Fu et al. (2014), the mechanism required for producing high anisotropies is not clear. Moreover, it is noted in Zhou et al. (2015), on the basis of the analysis of a large volume of experimental data, that chorus is frequently excited in the regions of the daytime magnetosphere with a marginal stable plasma without significant anisotropy of the distribution function. For explaining these results, one can use the beam pulse amplifier (BPA) mechanism of chorus excitation in the magnetosphere (Bespalov and Savina, 2018). It has been shown that under suitable conditions a very effective amplification of short noise pulses can occur even in a stable plasma. Pulse amplification leads to the excitation of bursts of electromagnetic radiation having the same properties as would occur due to an instability resulting from a very high anisotropy in the distribution function of energetic electrons. In a homogeneous plasma, the BPA mechanism is most effective at wave normal angles close to θ≃39∘.
In this paper, we examine some specific features of the BPA mechanism realisation of electromagnetic chorus excitation in the duct. This will be done in the Wentzel–Kramers–Brillouin (WKB) approximation for a planar duct with refractive reflection. The study will make it possible to better understand the real conditions of the chorus excitation. In particular, we will explain the experimental data about typical wave normal angles in the chorus excitation region.
The motion of ions is not important for describing the whistler wave radiation in the chorus excitation region with frequency ω in the interval , where ωLHF is the lower-hybrid frequency, and are the absolute value of the electron cyclotron and plasma frequencies, e is the absolute value of electron charge, m is the electron mass, np is the plasma density, and c is the speed of light in free space. A theoretical analysis is simplified if the conditions for the applicability of the so-called quasi-longitudinal approximation of electromagnetic wave propagation in a cold, relatively dense plasma are fulfilled (Helliwell, 1965):
where kz and kx are the wave vector components along and across the magnetic field, respectively.
For typical magnetospheric conditions (Haque et al., 2011) in the region of chorus excitation, the length of the whistler wave λ≃15 km is less than the scale of the background plasma density distribution and the transverse size of the duct, d = 100–300 km. Therefore the inequality is fulfilled, and the well-known WKB approximation (Budden, 1985) is valid. When the plasma density is inhomogeneous in the direction perpendicular to the duct axis, refraction is an important factor for the wave propagation. It is known that under conditions for refractive reflection, waves with frequencies higher than half of the electron cyclotron frequency are directed by the depleted duct (Helliwell, 1965). Waves with frequencies lower than half of the electron cyclotron frequency are directed by the enhanced duct (Helliwell, 1965; Karpman and Kaufman, 1984).
We now consider in more detail the characteristic equation of a refractive planar duct. For this purpose, we analyse the dependence of the transverse component of the whistler wave vector on the frequency and the longitudinal component of the wave vector with different background plasma densities (Woodroffe et al., 2013). This dependence, in accordance with Fig. 1, has two branches, which, according to Eq. (1), can be written as follows:
where is the Gendrin velocity (Helliwell, 1995),
H(ς) is the Heaviside step function. Let us note that there is a range of values kz, ω, in which kx has not one but two values (see Fig. 1).
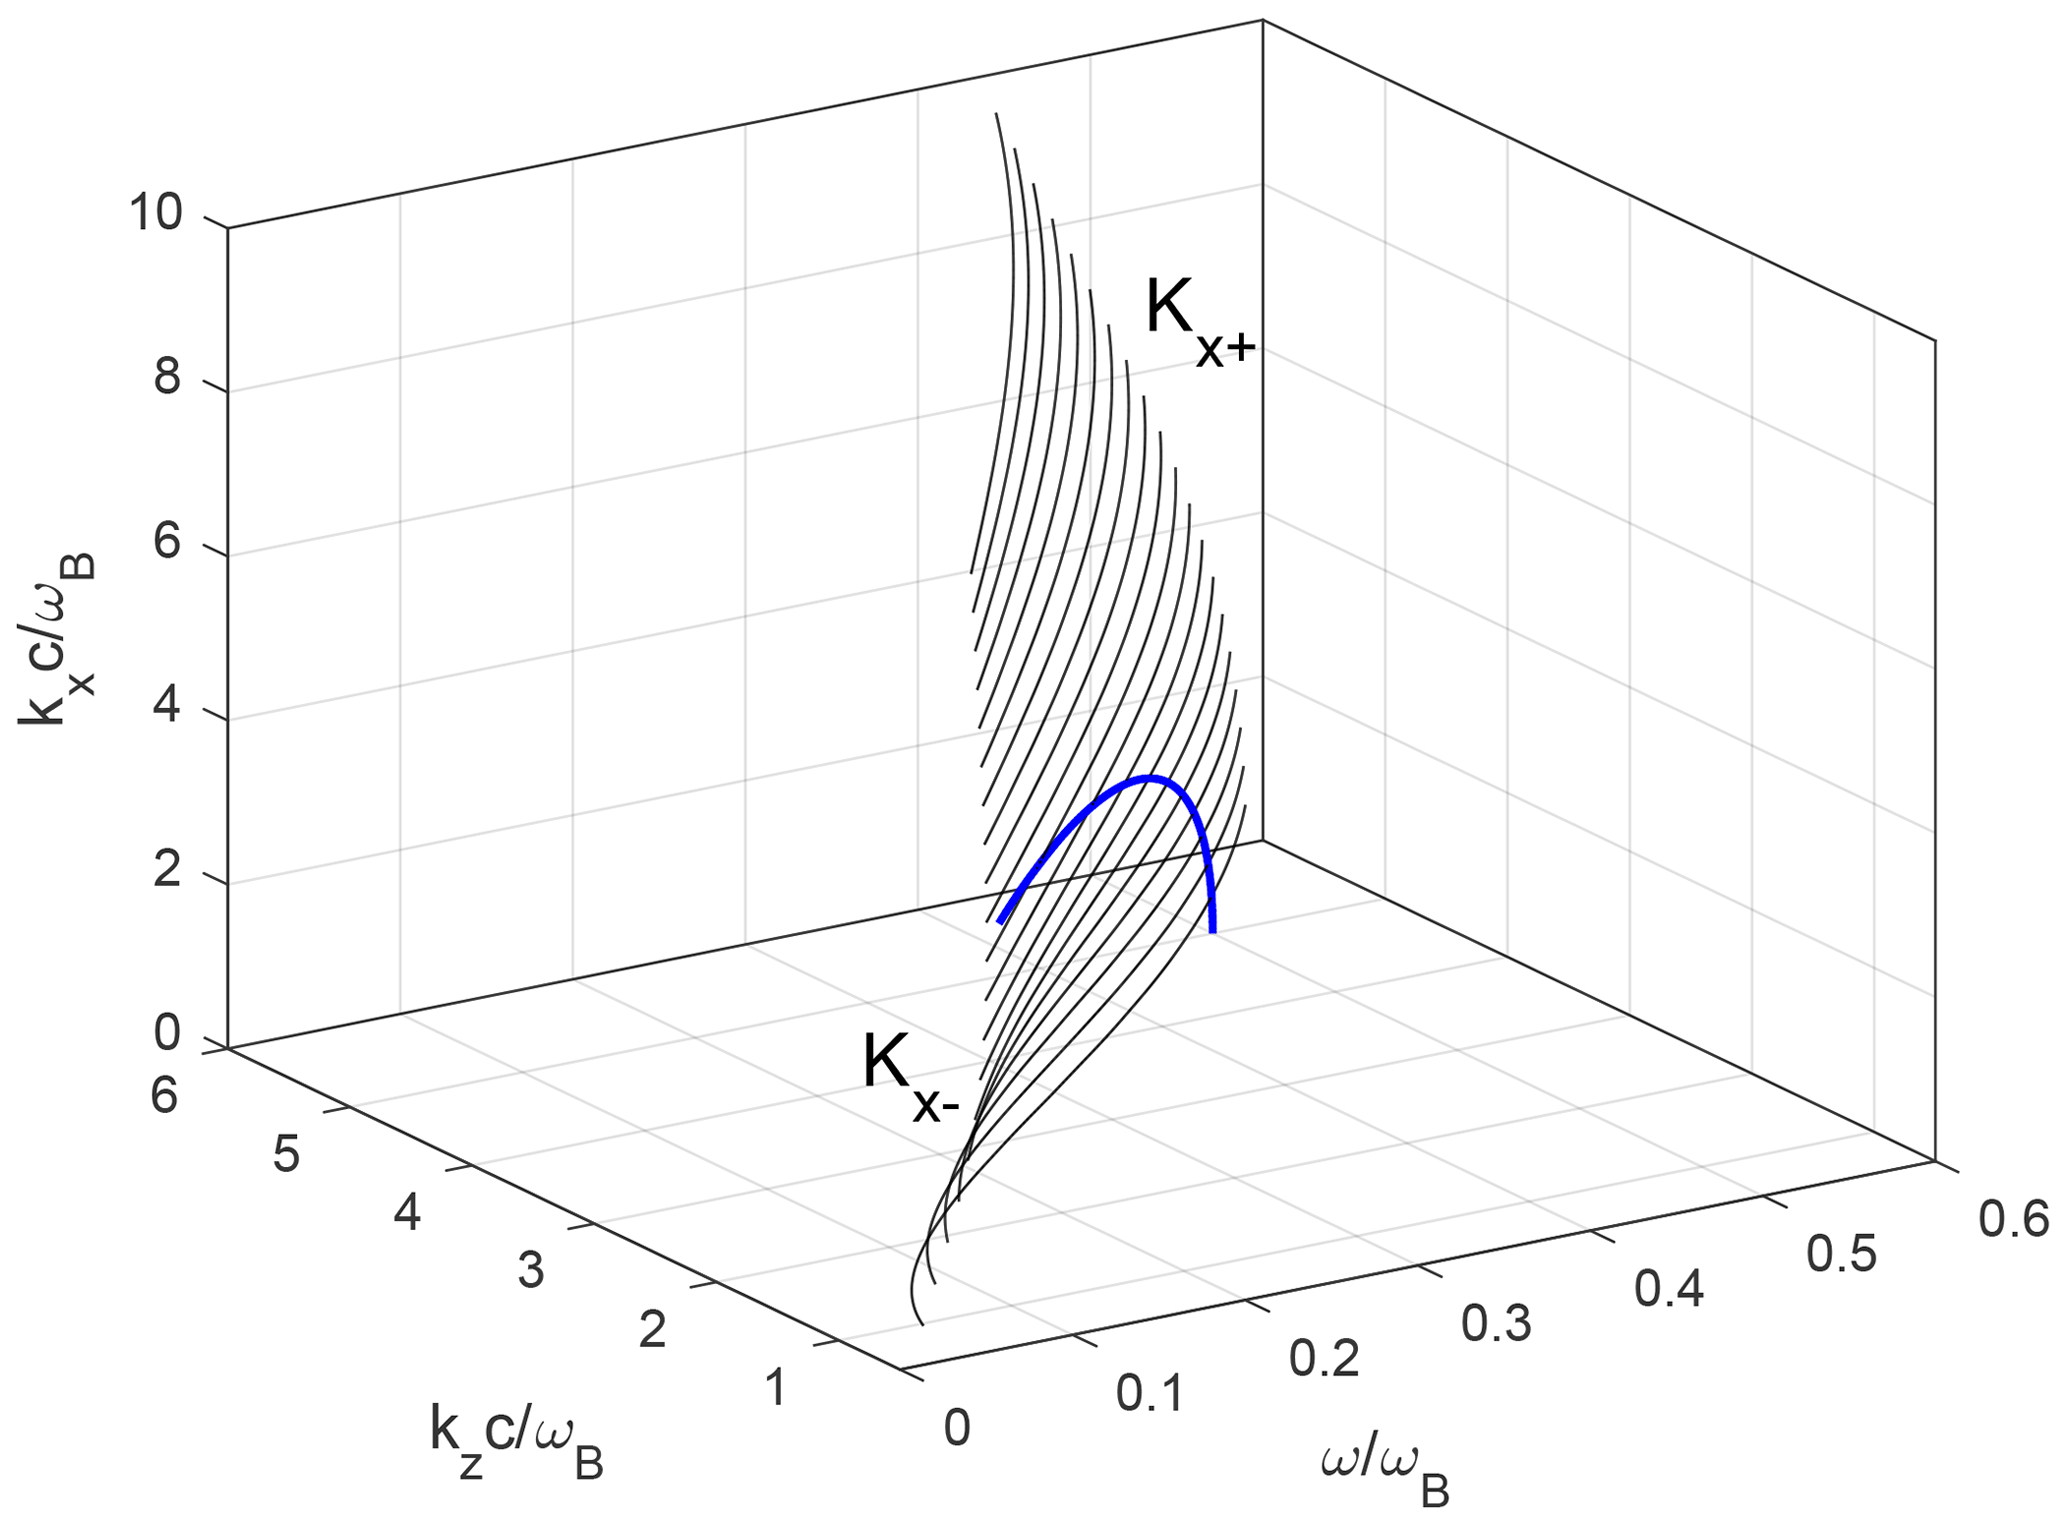
Figure 1Dependence of the transverse component of the wave vector on the frequency and the longitudinal component of the wave vector for are shown by contours with constant kx in the surface . Two branches Kx− and Kx+ (see Eq. 2) are separated by a blue line.
The property of the eigenmode wave solutions is determined by the characteristic equation, which expresses the dependence of the frequency on the longitudinal component of the wave vector. For determining the characteristic equation in the WKB approximation, it is necessary to calculate a complete transverse change in the phase during the ray propagation period. A change in the phase during one period should include phase displacements on the caustics and be a multiple of 2π. Therefore, the characteristic equation takes the well-known form (Laird, 1992)
where p is a positive integer, and in a symmetric duct values are the reflection levels, where kx=0.
Within the framework of the WKB approximation, the dependence kx(x) should be continuous, and in the regions of refraction reflection, kx=0 if the density np(x) and the Gendrin velocity uG(x) change continuously. The refraction-enhanced duct can occur for frequencies , and only branch Kx− (Eq. 2) satisfies the continuity condition of the dependence kx(x). The refraction-depleted duct can occur for frequencies , and only the branch Kx+ (Eq. 2) satisfies the continuity condition of the dependence kx(x).
Let us assume that there is a duct with enhanced or depleted cold plasma density and which is uniform along the magnetic field. While performing calculations, we will consider, according to the known experimental data (see, e.g. Hague et al., 2011; Taubenschuss et al., 2014; Agapitov et al., 2017), that the magnetic field is uniform and that the electron cyclotron frequency is s−1. The plasma density outside the duct corresponds to the condition . Inside the enhanced duct, we have , while inside the depleted duct, . For determining the solutions of the characteristic equation, we used a model transverse density distribution for the enhanced and depleted ducts in the form
where d = (1–3) 107 cm is the transverse size of the duct.
For the accepted density distributed across the duct (Eq. 4), it is possible to numerically calculate, based on Eq. (2), the phase change given by Eq. (3) and obtain dispersion formulas for the enhanced and depleted ducts. Some results of calculations are given in Fig. 2. In this figure, the red lines show solutions of the characteristic equations for the first and seventh modes in the enhanced (panel a) and depleted (panel b) ducts, the dashed–doted and the dotted curves correspond to the solution of dispersion Eq. (1) for kx(x)=0 at the maximum and minimum density, respectively, the solid line corresponds to the Gendrin velocity at the maximum density, and the dashed straight line corresponds to the Gendrin velocity at the minimum density.
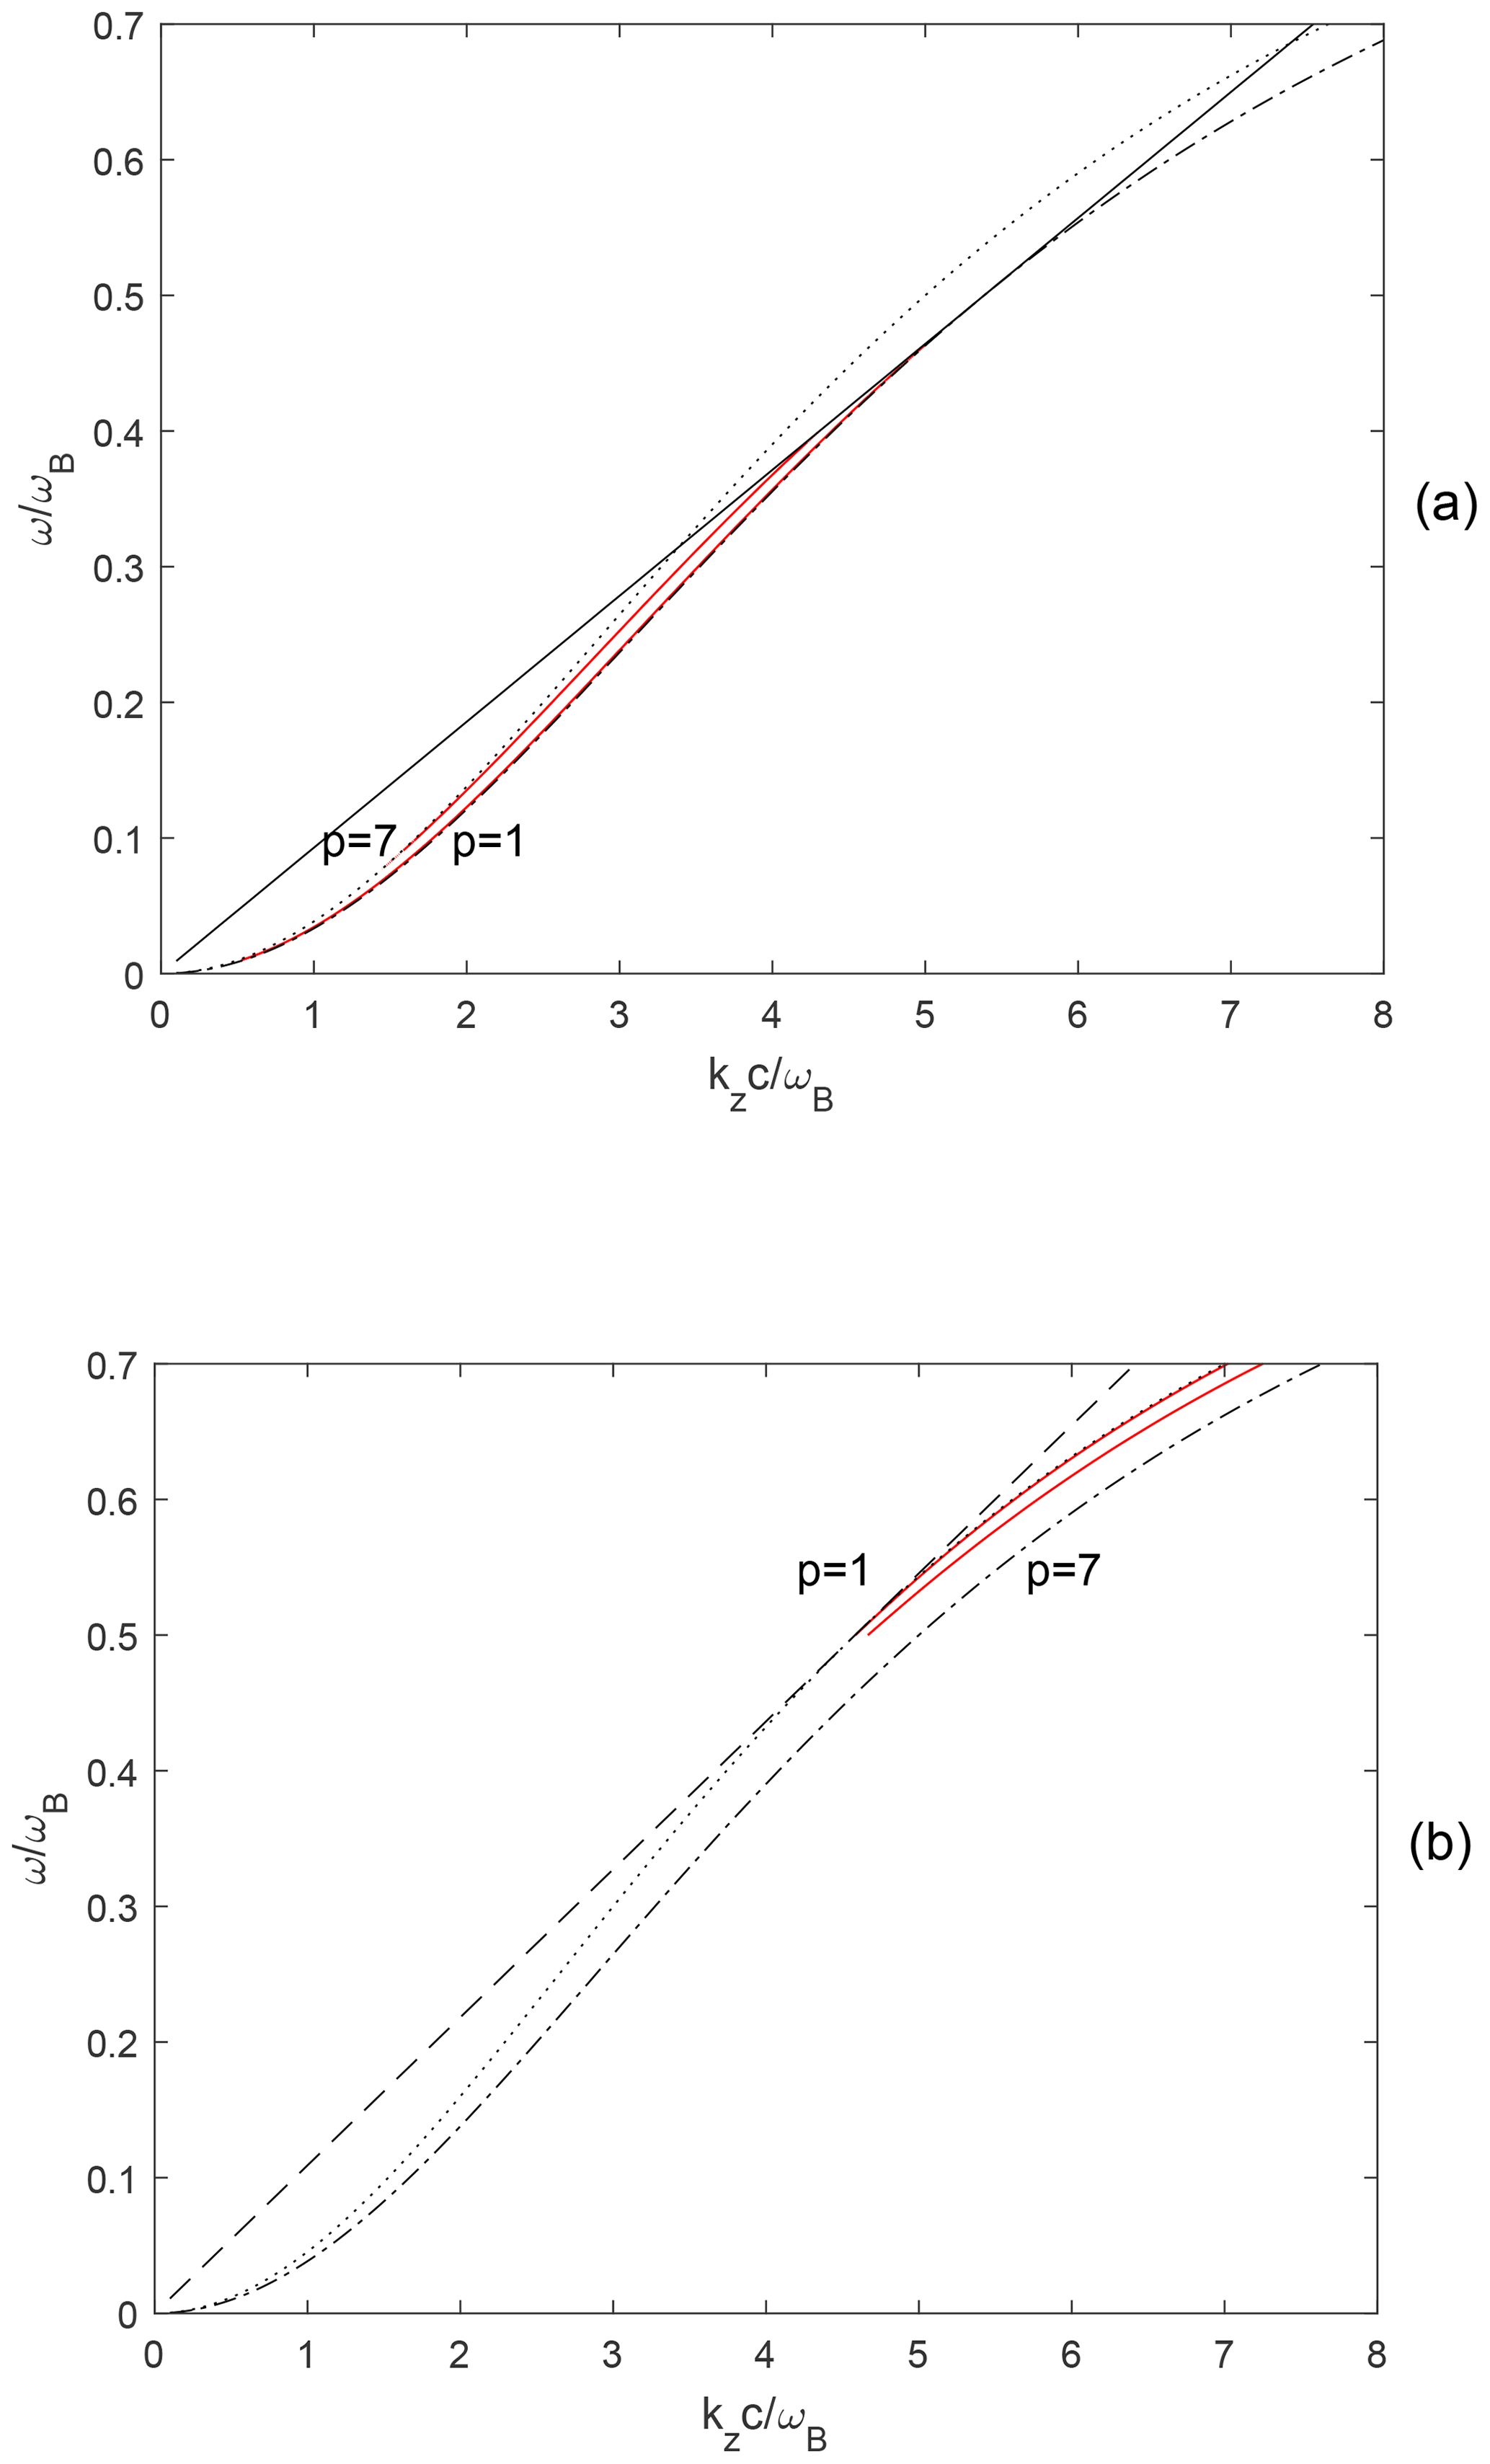
Figure 2Relationship between the frequency and the longitudinal component of the wave vector for the first (p=1) and seventh (p=7) ducted modes at are shown in red: (a) in the enhanced duct with and (b) in the depleted duct with .
For relatively gently sloping ray trajectories, it is not difficult to estimate the average of the normal angle. Then Eq. (3) can be written in the form . As it will be shown in the next section for actual modes, with an accuracy of up to 20 % we have tan (θ)≃θ , and therefore
Note that the distance between the modes in Fig. 2 decreases with increasing transverse size of the duct.
Now we briefly recall the process of chorus frequency–time spectrogram formation in the implementation of the BPA mechanism (Bespalov and Savina, 2018). At the input of the wave–particle interaction region (z=0), there is weak noisy emission with an electric field containing a random sequence of weak shot noise electromagnetic pulses. Noise that does not satisfy the conditions for interaction with particles is dumped in a nearly stable plasma. An appropriate shot pulse is a trigger for the chorus discrete element. In accordance with this, we assume that a short noise pulse flies in the duct on the z axis along the magnetic field B. Our interest is to classify the duct solutions which are close in structure to the expression
in which the longitudinal electric field Ez corresponds to the pth wave mode in the duct. The wave mode (Eq. 6) is localised well on the transverse coordinate x because of the fast decrease in the function Gp(x) with large |x|, but in the general case, it spreads along the longitudinal coordinate z because of the dispersion.
There is an important exception from this general regularity. A noisy electromagnetic pulse will not rapidly spread if it has frequencies for which
where and are the phase and group velocities of the wave mode in the duct. In this case, the population of epithermal electrons, which fly in together with the pulse into the region of wave–particle interaction, starts to play an important role. These electrons for the pulse are a single-velocity beam with a distribution function f proportional to
where δ(ς) is a delta function, nb is the density of the beam coordinated with the pulse, and Vz is the beam velocity.
In a homogeneous plasma with beam (Eq. 8), the electromagnetic pulse increases with the growth rate (Bespalov and Savina, 2018):
First of all, we verify the possibility of the fulfilment of conditions (7) for the duct modes. For the plasma parameters introduced in the foregoing section, this condition can be fulfilled (see Fig. 2a) in the enhanced duct if the frequency spectrum is concentrated near and the longitudinal component of the wave vector is close to . Conditions (7) also can be fulfilled (see Fig. 2b) in the depleted duct if the frequency spectrum is concentrated near and the longitudinal component of the wave vector is close to . The mentioned frequencies are typical for lower- and upper-band chorus (Lauben et al., 2002).
We can use a formula for growth rate (Eq. 9), since the wave modes in the duct conform to the WKB approximation, and therefore their polarisation corresponds to the whistler waves in which during the inclined propagation there is a longitudinal component of the wave electric field which is taken into account in the growth rate calculation (Bespalov and Savina, 2018). We will refine now the value of the average angle , which should be substituted into Eq. (9). We will do this using Eq. (5), according to which
where we expected that and d=300 km. The angle θ is less than 20∘ for the first 10 modes.
Actually, the number of operating modes (p) in a relatively small duct is limited by several factors. In particular, the quality of the mode should be sufficiently high, the mode should be electromagnetic, and the key conditions (7) should be fulfilled. Formally, the growth rate (Eq. 9) increases with an increasing mode number p. However, it should be taken into account that there is another limitation on the angle of excitation, which is caused by the Landau damping on the Cherenkov resonance of electromagnetic waves in a plasma. We note that for the angle θ=20∘, the growth rate (Eq. 9) decreases by 20 % only in comparison with the maximum value close to θ=39∘, and it is sufficient for explaining the experimental data.
The beam pulse amplifier (BPA) mechanism of chorus excitation was first studied for the homogeneous plasma (Bespalov and Savina, 2018). This mechanism explains many properties of the oblique electromagnetic chorus. The proposed model with waveguide propagation explains the possibility of excitation of chorus with small angles of the wave normal when the BPA mechanism is implemented.
We have examined specific features of the realisation of the BPA mechanism of chorus excitation in density ducts with a width of the order of 100–300 km with refractive reflection. It is shown that the BPA mechanism can be realised in magnetospheric density ducts. Waveguide propagation of the whistler waves excited by this mechanism in a refractive duct allows one to explain the experimentally observed small angles of the wave normal. For the modes with relatively low numbers (in the examined example in Eq. 10, p = 1–10), the angle of the wave normal θ≤20∘. The rate of change in spectral forms in this case is characterised by the growth rate (Eq. 9) with a value smaller than the maximum possible growth rate (up to 20 %). This rate of change is sufficient for explaining the experimental data within the framework of the approach presented in the paper by Bespalov and Savina (2019). The key conditions (7) of the BPA mechanism is satisfied in a frequency range lower than half of the electron cyclotron frequency in the enhanced duct and larger than half of the electron cyclotron frequency in the depleted duct (see Fig. 2). If there is no appropriate wave refraction, pulses can also be excited but no longer as the ducted mode. For these emissions, it is possible to expect the lower values of the intensity and larger angles θ.
The proposed model explains the possibility of the chorus emissions excitation with small angles of the wave normal due to the BPA mechanism. The properties of chorus, such as the intensity and a typical angle of the wave normal, can be different for the lower- and upper-band chorus.
The paper is theoretical and no new experimental data are used. All figures data are obtained from numerical calculation in MATLAB codes. Corresponding parameters are listed in the text.
PAB proposed and analysed the BPA mechanism in the density ducts and wrote the paper. ONS analysed the BPA mechanism in the density ducts and wrote the paper.
The authors declare that they have no conflict of interest.
The authors would like to thank the editor Wen Li and the two anonymous referees for comments and suggestions which helped in improving the quality of the article. This work was supported by RSF, project no. 16-12-10528 (Sect. 3); the fundamental research programme RAS, no. 19-270 (Sect. 2); and the IAP RAS government basic research programme, no. 0035-2019-0002 (numerical calculations).
This research has been supported by the RSF (grant no. 16-12-10528).
This paper was edited by Wen Li and reviewed by two anonymous referees.
Agapitov, O., Blum, L. W., Mozer, F. S., Bonnell, J. W., and Wygant, J.: Chorus whistler wave source scales as determined from multipoint Van Allen Probe measurements, Geophys. Res. Lett., 44, 2634–2642, https://doi.org/10.1002/2017GL072701, 2017.
Bell, T. F., Inan, U. S., Hague, N., and Pickett, J. S.: Source regions of banded chorus, Geophys. Res. Lett., 36, L11101, https://doi.org/10.1029/2009GL037629, 2009.
Bespalov, P. and Savina, O.: An excitation mechanism for discrete chorus elements in the magnetosphere, Ann. Geophys., 36, 1201–1206, https://doi.org/10.5194/angeo-36-1201-2018, 2018.
Bespalov, P. A. and Savina, O. N.: On the linear theory of oblique magnetospheric chorus excitation, J. Atmos. Sol.-Terr. Phy., 185, 58–67, https://doi.org/10.1016/j.jastp.2019.01.016, 2019.
Budden, K. G.: The propagation of radio waves: The theory of radio waves of low power in the ionosphere and magnetosphere, Cambridge University Press, Cambridge, 669 pp., https://doi.org/10.1017/CBO9780511564321, 1985.
Fu, X., Cowee, M. M., Friedel, R. H., Funsten, H. O., Gary, S. P., Hospodarsky, G. B., Kletzing, C., Kurth, W., Larsen, B. A., Liu, K., MacDonald, E. A., Min, K., Reeves, G. D., Skoug, R. M., and Winske, D.: Whistler anisotropy instabilities as the source of banded chorus: Van Allen Probes observations and particle-in-cell simulations, J. Geophys. Res., 119, 8288–8298, https://doi.org/10.1002/2014JA020364, 2014.
Haque, N., Inan, U. S., Bell, T. F., Pickett, J. S., Trotignon, J. G., and Facsko, G.: Cluster observations of whistler mode ducts and banded chorus, Geophys. Res. Lett., 38, L18107, https://doi.org/10.1029/2011GL049112, 2011.
Hayakawa, M., Shimakura, S., Parrot, M., Lefeuvre, F., and Hattori, K.: Direction finding of chorus emissions in the outer magnetosphere and their generation and propagation, Planet. Space Sci., 38, 135–143, https://doi.org/10.1016/0032-0633(90)90012-F, 1990.
Helliwell, R. A.: Whistlers and related ionospheric phenomena, Stanford University Press, Stanford, CA, 349 pp., 1965.
Helliwell, R. A.: The role of the Gendrin mode of VLF propagation in the generation of magnetospheric emissions, Geophys. Res. Lett., 22, 2095–2098, https://doi.org/10.1029/95GL02003, 1995.
Karpman, V. I. and Kaufman, R. N.: Whistler wave propagation in magnetospheric ducts (in the equatorial region), Planet. Space Sci., 32, 1505–1511, https://doi.org/10.1016/0032-0633(84)90017-5, 1984.
Laird, M. J.: Mode theory of whistler ducts – Integrated group delay times, J. Atmos. Terr. Phys., 54, 1599–1607, https://doi.org/10.1016/0021-9169(92)90166-I, 1992.
Lauben, D. S., Inan, U. S., Bell, T. F., and Gurnett, D. A.: Source characteristics of ELF/VLF chorus, J. Geophys. Res., 107, SMP 10-1–SMP 10-17, https://doi.org/10.1029/2000JA003019, 2002.
Li, W., Thorne, R. M., Bortnik, J., Nishimura, Y., and Angelopoulos, V.: Modulation of whistler mode chorus waves: 1. Role of compressional Pc4-5 pulsations, J. Geophys. Res., 116, A06205, https://doi.org/10.1029/2010JA016312, 2011.
Muto, H., Hayakawa, M., Parrot, M., and Lefeuvre, F.: Direction finding of half-gyrofrequency VLF emissions in the off-equatorial region of the magnetosphere and their generation and propagation, J. Geophys. Res., 92, 7538–7550, https://doi.org/10.1029/JA092iA07p07538, 1987.
Pasmanik, D. L. and Trakhtengerts, V. Y.: Dispersion properties of ducted whistlers, generated by lightning discharge, Ann. Geophys., 23, 1433–1439, https://doi.org/10.5194/angeo-23-1433-2005, 2005.
Santolik, O. and Gurnett, D. A.: Transverse dimension of chorus in the source region, Geophys. Res. Lett., 30, 1031, https://doi.org/10.1029/2002GL016178, 2003.
Santolik, O., Garnet, D. A., Piekett, J. S., Chum, J., and Cornilleau-Wehrlin, N.: Oblique propagation of whistler mode waves in the chorus source region, J. Geophys. Res., 114, 5819–5832, https://doi.org/10.1029/2002JA009764, 2009.
Sazhin, S. and Hayakawa, M.: Magnetospheric chorus emissions, A review, Planet. Space Sci., 40, 681–697, https://doi.org/10.1016/0032-0633(92)90009-D, 1992.
Sonwalkar, V. S.: The infuence of plasma density irregularities on whistler-mode wave propagation, Lect. Notes Phys., 687, 141–191, 2006.
Taubenschuss, U., Khotyaintsev, Y. V., Santolik, O., Vaivads, A., Cully, C. M., Le Contel, O., and Angelopoulos, V.: Wave normal angles of whistler mode chorus rising and falling tones, J. Geophys. Res.-Space, 119, 9567–9578, https://doi.org/10.1002/2014JA020575, 2014.
Woodroffe, J. R., Streltsov, A. V., Vartanyan, A., and Milikh, G. M.: Whistler propagation in ionospheric density ducts: Simulations and Demeter observations, J. Geophys. Res.-Space, 118, 7011–7018, https://doi.org/10.1002/2013JA019445, 2013.
Zhou, C., Li, W., Thorne, R. M., Bortnik, J., Ma, Q., An, X., Zhang, X., Angelopoulos, V., Ni, B., Gu, X., Fu, S., and Zhao, Z.: Excitation of dayside chorus waves due to magnetic field line compression in response to interplanetary shocks, J. Geophys. Res.-Space, 120, 8327–8338, https://doi.org/10.1002/2015JA021530, 2015.
- Abstract
- Introduction
- Characteristic equation for the modes of a planar duct with refractive reflection
- Special features of implementation of the BPA mechanism of the chorus excitation in a duct with refractive reflection
- Conclusions
- Data availability
- Author contributions
- Competing interests
- Acknowledgements
- Financial support
- Review statement
- References