the Creative Commons Attribution 4.0 License.
the Creative Commons Attribution 4.0 License.
 | 05 Sep 2019
Diurnal, seasonal and solar cycle variation in total electron content and comparison with IRI-2016 model at Birnin Kebbi
Aghogho Ogwala
Emmanuel Olufemi Somoye
Olugbenga Ogunmodimu
Rasaq Adewemimo Adeniji-Adele
Eugene Oghenakpobor Onori
Oluwole Oyedokun
The ionosphere is the major error source for the signals of global positioning system (GPS) satellites. In the analysis of GPS measurements, ionospheric error is assumed to be somewhat of a nuisance. The error induced by the ionosphere is proportional to the number of electrons along the line of sight (LOS) from the satellite to receiver and can be determined in order to study the diurnal, seasonal, solar cycle and spatial variations in the ionosphere during quiet and disturbed conditions. In this study, we characterize the diurnal, seasonal and solar cycle variation in observed total electron content (OBS-TEC) and compare the results with the International Reference Ionosphere (IRI-2016) model. We obtained TEC from a dual-frequency GPS receiver located at Birnin Kebbi Federal Polytechnic (BKFP) in northern Nigeria (geographic location: 12.64∘ N, 4.22∘ E; 2.68∘ N dip) for the period 2011–2014. We observed differences between the diurnal variation in OBS-TEC and the IRI-2016 model for all hours of the day except during the post-midnight hours. Slight post-noon peaks in the daytime maximum and post-sunset decrease and enhancement are observed in the diurnal variation in OBS-TEC during the equinoxes. On a seasonal scale, we observed that OBS-TEC values were higher in the equinoxes than the solstices only in 2012. However, in 2011, the September equinox and December solstice recorded a higher magnitude, followed by the March equinox, and the magnitude was lowest in the June solstice. In 2013, the December solstice magnitude was highest, followed by the equinoxes, and it was lowest in the June solstice. In 2014, the March equinox and December solstice magnitudes were higher than the September equinox and June solstice magnitude. The June solstice consistently recorded the lowest values for all the years. OBS-TEC is found to increase from 2011 to 2014, thus revealing solar cycle dependence.


Ionospheric irregularities as a result of inhomogeneity in electron density lead to variations in the intensity of radio signals (Somoye, 2010; Ogwala et al., 2018; Ogunmodimu et al., 2018). Akala et al. (2011) reported that the variable nature of the equatorial and low-latitude ionosphere adversely affects communication and navigation and satellite systems in the region. The equatorial and low-latitude ionosphere exhibits unique features such as the seasonal anomaly, semi-annual anomaly, equinoctial anomaly, noon bite-out, spread F, equatorial electrojet (EEJ) and equatorial plasma bubbles (EPBs; Stankov, 2009; Maruyama et al., 2004; Jee et al., 2004; Codrescu et al., 1999).
For many decades, scientists have been studying these peculiar ionospheric features and their roles in trans-ionospheric electromagnetic radio wave propagation using different techniques and instruments. One of the instruments often used is the global positioning system (GPS) receiver. The GPS receiver provides direct measurements from satellites. Their sounding capacity extends to the topside of the ionosphere and is affected by time and space constraints (Ciraolo and Spalla, 2002). Recently, the dual-frequency GPS receiver has been the most efficient method used to eliminate the effect of the ionosphere on radio signals. This method combines signals in different L-band frequencies, L1 (1575 MHz) and L2 (1228 MHz; Bolaji et al., 2012; Alizadeh et al., 2013).
Almost all space geodetic techniques transmit signals in at least two different frequencies for better accuracy (Alizadeh et al., 2013). The signals are then combined linearly in order to eliminate the effect of the ionosphere on radio signals. The ionospheric effect on the radio signal is proportional to the total electron content (TEC), which is defined as the number of electrons per square metre from satellites in space to the receiver on the ground, as shown in Eq. (1):
It is measured in multiples of TEC units (1 TECU = 1016 electrons m−2). Due to the dispersive nature of the ionosphere, there is a time delay between the two frequencies of a GNSS signal as it propagates through the ionosphere, as shown in Eq. (2) as . Thus,
where c is speed of light and f is frequency. Hence, Δt measured between the L1 and L2 frequencies is used to evaluate TEC along the ray path.
When global navigation satellite system (GNSS) signals propagate through the ionosphere, the carrier experiences phase advance, and the code experiences a group delay due to the electron density along the line of sight (LOS) from the satellite to the receiver (Bagiya et al., 2009; Tariku, 2015). Thus, the carrier-phase pseudo-ranges are underestimated, and the code pseudo-ranges are overestimated compared to the geometric range between the satellite and the receiver. This results in a range error of the positioning accuracy provided by a GPS receiver. The range error due to TEC in the ionosphere varies from hundreds of metres at midday during high solar activity, when the satellite is near the horizon of the observer, to a few metres at night during low solar activity, with the satellite positioned at zenith angle (Bagiya et al., 2009). By measuring this delay using dual-frequency GPS receivers, properties of the ionosphere can be inferred and used to monitor space weather events, such as when using GNSS, high-frequency (HF) communications, the space-based observation radar, the situational awareness radar, etc. Ionospheric delay (proportional to TEC) is the highest contributor to GPS positioning error (Alizadeh et al., 2013; Bolaji et al., 2012).
TEC in the ionosphere can also be studied using an empirical ionospheric model such as the International Reference Ionosphere (IRI). IRI is a joint undertaking by the Committee on Space Research (COSPAR) and International Union of Radio Science (URSI) with the goal of developing and improving an international standard for the parameters in Earth's ionosphere (Bilitza et al., 2014). An updated version has been recently developed to cater to lapses of previous models. IRI provides the vertical TEC (VTEC) from the lower boundary (60–80 km) to a user-specific upper boundary (Bilitza et al., 2017).
In the past few decades, studies on the temporal and spatial variations in TEC have gained popularity in the scientific community (Wu et al., 2008). However, understanding the variability in TEC will also go a long way in obtaining the positioning accuracy of GNSS under disturbed and quiet conditions. As such, previous studies (e.g. Ayorinde et al., 2016; Bhuyan and Borah, 2007; Maruyama et al., 2004; Jee et al., 2004; Balan et al., 1994; Rama Rao et al., 2006a, b, c; Bolaji et al. 2012; Wanninger, 1993; Akala et al., 2013; Komjathy et al., 1998; Langley et al., 2002; Sunda and Vyas, 2013; Torr and Torr, 1973; Tsai et al., 2001, and references therein) investigated the global distribution of TEC variations and TEC characteristics at all latitudes during different solar cycle phases under disturbed and quiet conditions.
Studies of Rama Rao et al. (2006a, b) in the Indian sector and Wanninger (1993) in the Asian sector reported maximum day-to-day variability in TEC at the equatorial ionization anomaly (EIA) crest regions, increasing the peak value of TEC with an increase in integrated equatorial electrojet (IEEJ) strength and with maximum monthly average diurnal variations during equinox months being followed by those in the winter months and variations that were lowest during summer months. They also reported a positive correlation of TEC and EEJ and the spatial variation in TEC in the equatorial region. Titheridge (1974) and Langley et al. (2002) attributed the lowest TEC values during the summer seasons to low ionization density resulting from a reduced O∕N2 ratio (production rates) as a result of increased scale height. Bhuyan and Borah (2007), working in the Indian sector, and Komjathy et al. (1998) and Lee and Reinisch (2006), studying in the American sector, compared TEC derived from GPS receivers with the IRI model in the equatorial and low-latitude sector and inferred that the diurnal amplitude of TEC is higher during the equinoxes, followed by the December solstices, and lowest in the June solstice, i.e. observing winter anomaly in seasonal variation. They further reported discrepancies between IRI model and their measured values during most hours of the day at the various locations of the studies. Malik et al. (2016), in their studies over the Malaysian peninsula, reported higher IRI values than observed maximum useable frequency (MUF) values but similar behaviour diurnally and seasonally, with no clear trend. Akala et al. (2013), in the comparison of equatorial GPS TEC observations over an African station and an American station during the minimum and ascending phases of solar cycle 24, reported that seasonal VTEC values were maximum and minimum during the March equinox and June solstice respectively during the minimum solar cycle phase at both stations. They also reported that during the ascending phase of solar cycle 24, minimum and maximum seasonal VTEC values were recorded during the December solstice and June solstice respectively. They further showed that the IRI-2007 model predicted better in the American sector than in the African sector.
The aim of this paper is (i) to characterize TEC on diurnal, seasonal and solar cycle scales in the Nigerian equatorial ionosphere and (ii) to compare observed TEC (OBS-TEC) with the IRI-2016 model in order to find out if the model underestimates or overestimates TEC values at the African longitudinal sectors. In Sect. 2, we describe the data and methodology. Section 3 shows the result and discussion while concluding remarks are in Sect. 4.
2.1 Data
The Receiver Independence Exchange (RINEX) observation GPS data files were downloaded daily from the NIGNET website (https://www.nignet.net, last access: 26 January 2018) and processed using Bernese software and GPS TEC analysis software. The RINEX file contains 60 iteration data (i.e. in 1 min time resolution). The GPS TEC analysis software was designed by Gopi Seemala of the Indian Institute of Geomagnetism. This application reads raw data, processes cycle slips in phase data, reads satellite biases from the International GNSS Service (IGS) code files (and calculates them if unavailable), calculates receiver bias and inter-channel biases for different satellites in the constellation, and finally plots the VTEC values on the screen and writes the ASCII output files (*CMN) for slant TEC (STEC) and (*STD) for vertical TEC (VTEC) in the same directory of the data files. The effect due to multiple paths is eliminated by using a minimum elevation angle of 50∘.
Observation GPS TEC obtained from the TEC analysis software is the STEC and VTEC. STEC is polluted with several biases that must be eliminated to get VTEC. VTEC is calculated from the daily values of STEC using Eq. (3):
where bR, bS and bRX are receiver bias, satellite bias and receiver inter-channel bias respectively. S(E), which is the oblique factor with the zenith angle, z, at the IPP (ionospheric pierce point), is expressed in Eq. (4) (Bolaji et al., 2012):
RE is the mean radius of the Earth in kilometres, and hS is ionospheric height from the surface of the Earth. According to Rama Rao et al. (2006c), the ionospheric shell height of approximately 350 km is appropriate for the equatorial and low-latitude region of the ionosphere for an elevation cut-off angle of >50∘. This is valid in this study.
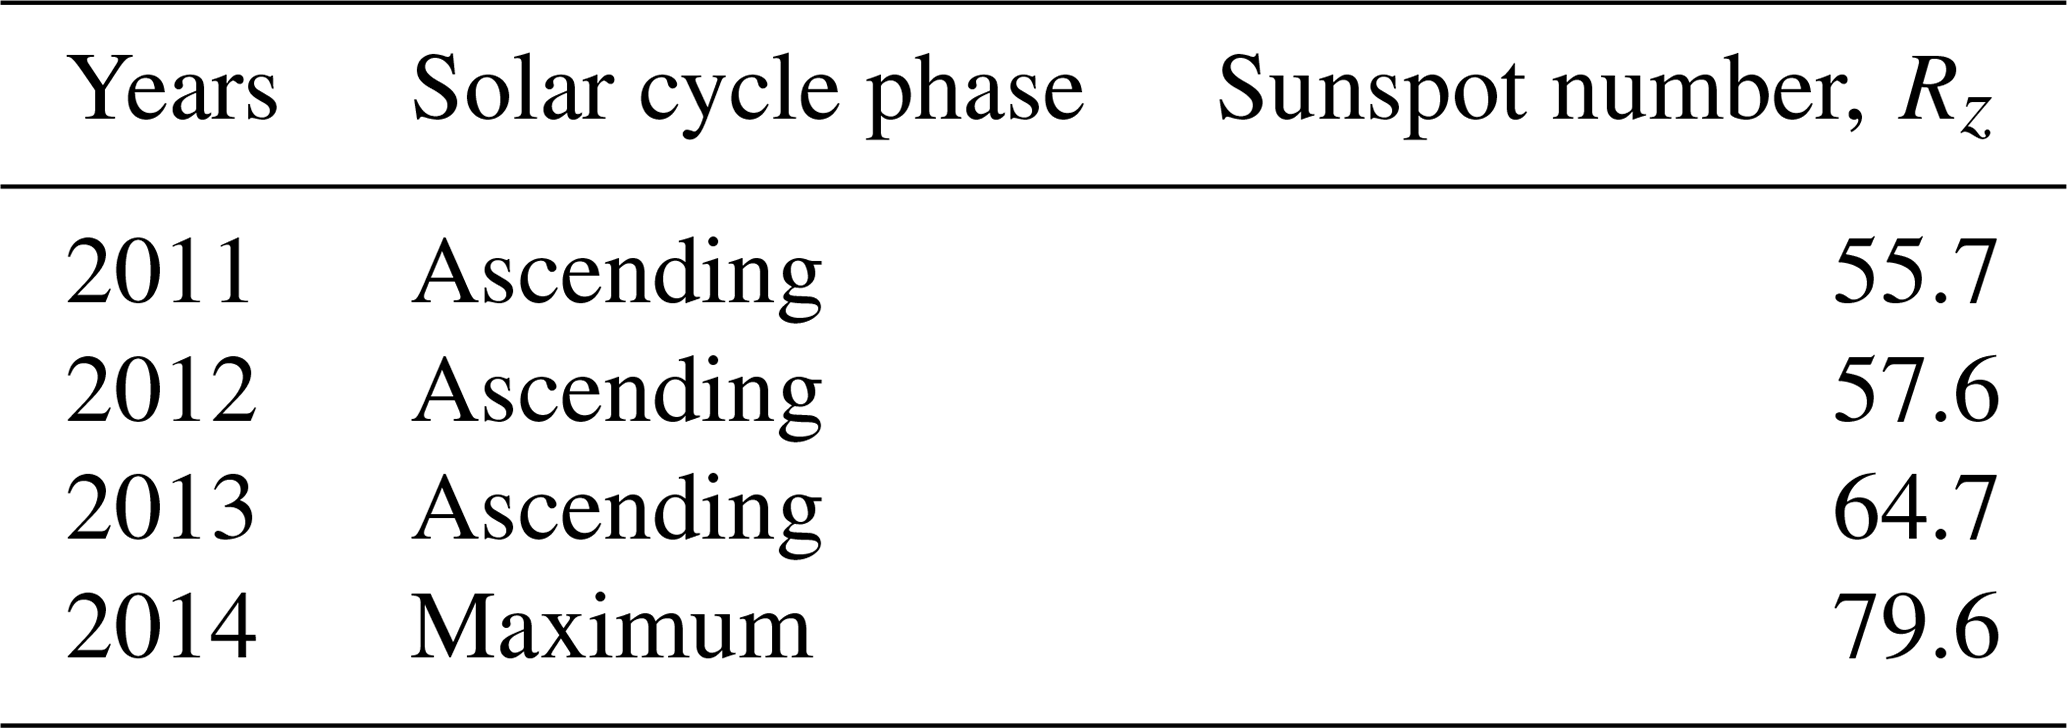
Hourly VTEC data obtained from these processing software are averaged to daily TEC values in TEC units (1 TECU = 1016 electrons m−2). OBS-TEC values from Birnin Kebbi, which has the geographic latitude 12.47∘ N and geographic longitude 4.23∘ E and is located in northern Nigeria, were obtained during the period 2011–2014, which corresponds to the ascending (2011–2013) and maximum (2014) phases of solar cycle 24. They were compared with the derived TEC obtained from the IRI-2016 model website (https://ccmc.gsfc.nasa.gov/modelweb/models/iri2016_vitmo.php, last access: 4 November 2018). The 2016 version of IRI provides important changes and improvements on previous IRI versions (Bilitza et al., 2017). Solar cycle 24 is regarded as a quiet solar cycle which peaked in 2014, with the maximum sunspot number (103) occurring in February. Values of the sunspot number, Rz, in text format were obtained from Space Physics Interactive Data Resource (SPIDR) website (https://www.ionosonde.spidr.com, last access: 14 March 2017) shortly before it became unavailable. Table 1 shows the years used in this study and their corresponding sunspot number, Rz.
Table 1Table of years, solar cycle phase and sunspot number, Rz (source: author).
2.2 Methodology
Diurnal variations in hourly OBS-TEC and the hourly IRI-2016 model (NeQuick topside option) were plotted using the monthly mean values of OBS-TEC and monthly mean of the IRI-2016 model against LT in the same figure. The corresponding percentage deviation (% DEV) of IRI-2016 from OBS-TEC was also analysed using the monthly mean values of OBS-TEC and monthly mean values of IRI-2016 against LT. Percentage deviation is obtained using Eq. (5) below:
where OBS represents observation TEC values and IRI represents the TEC derived by the IRI-2016 model.
The OBS-TEC data were grouped following Somoye and Akala (2010) into four seasons, namely the March equinox (February, March and April), June solstice (May, June and July), September equinox (August, September and October) and December solstice (November, December and January), in order to investigate seasonal variation. Finally, annual variation in OBS-TEC and the sunspot number, Rz, were also analysed by plotting mean OBS-TEC and mean Rz against each month of the year.
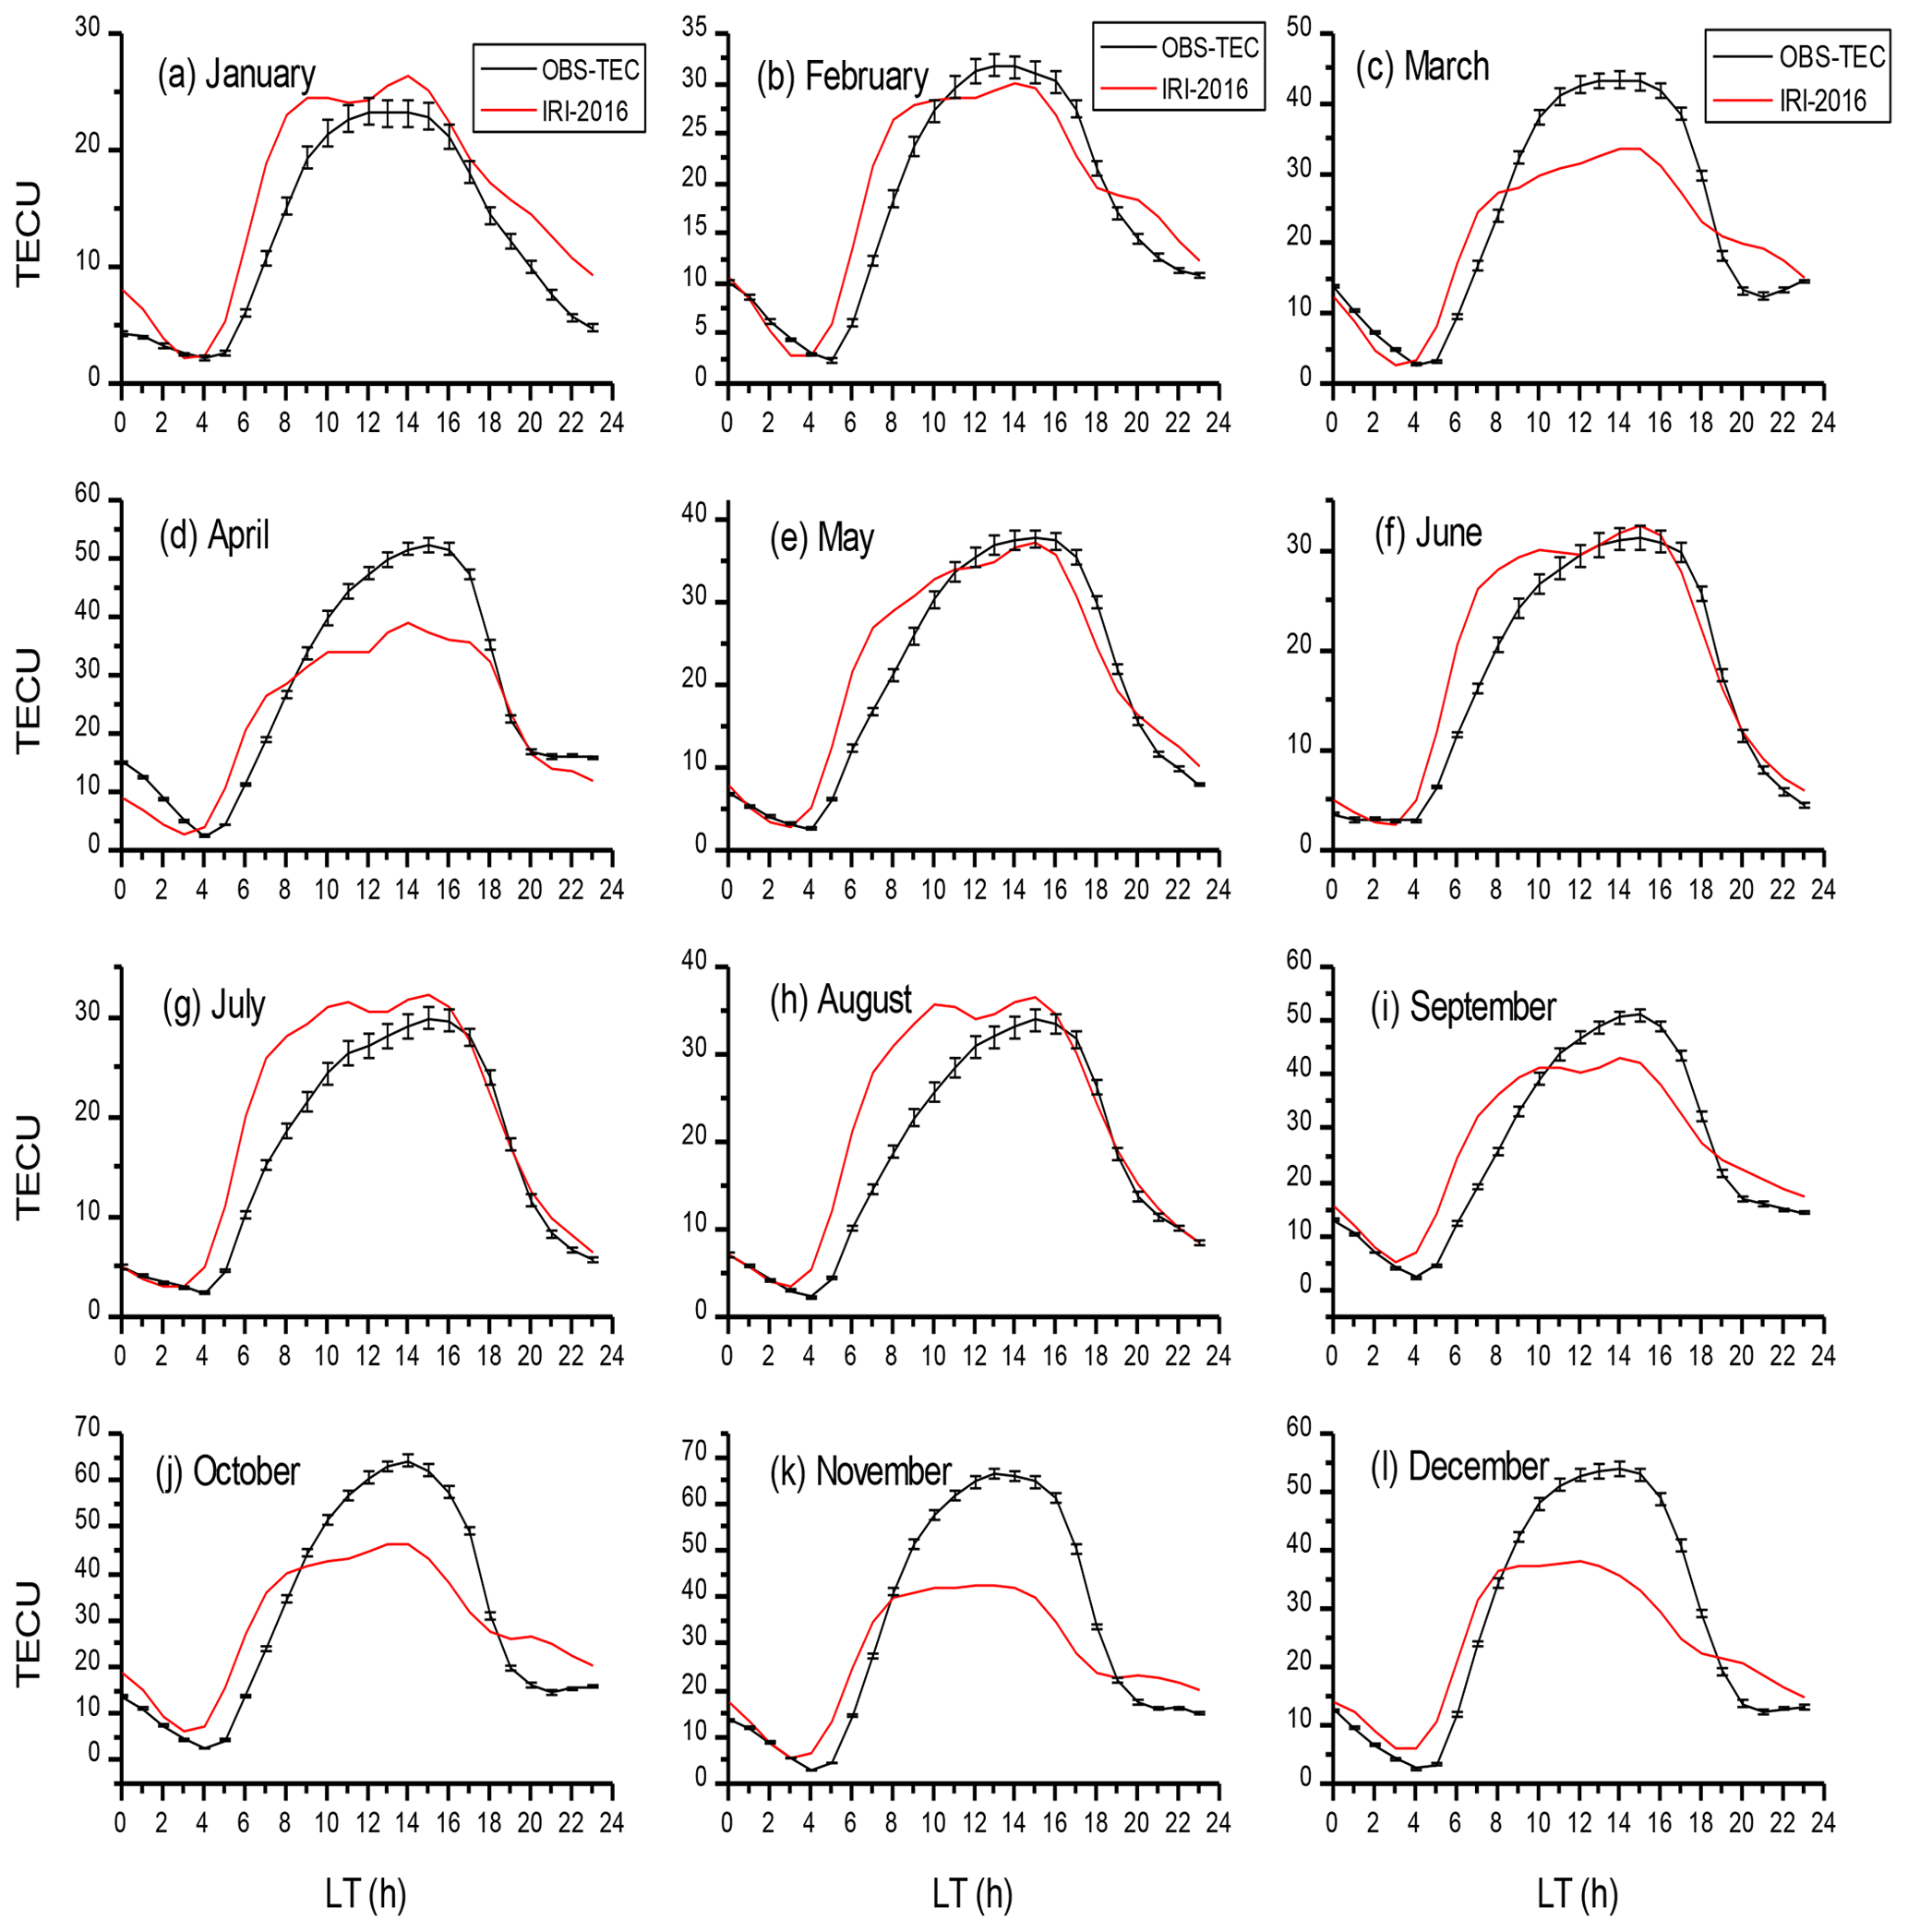
Figure 1Diurnal variation in OBS-TEC, showing error bar and IRI-2016 model of each month during January–December 2011 at Birnin Kebbi.
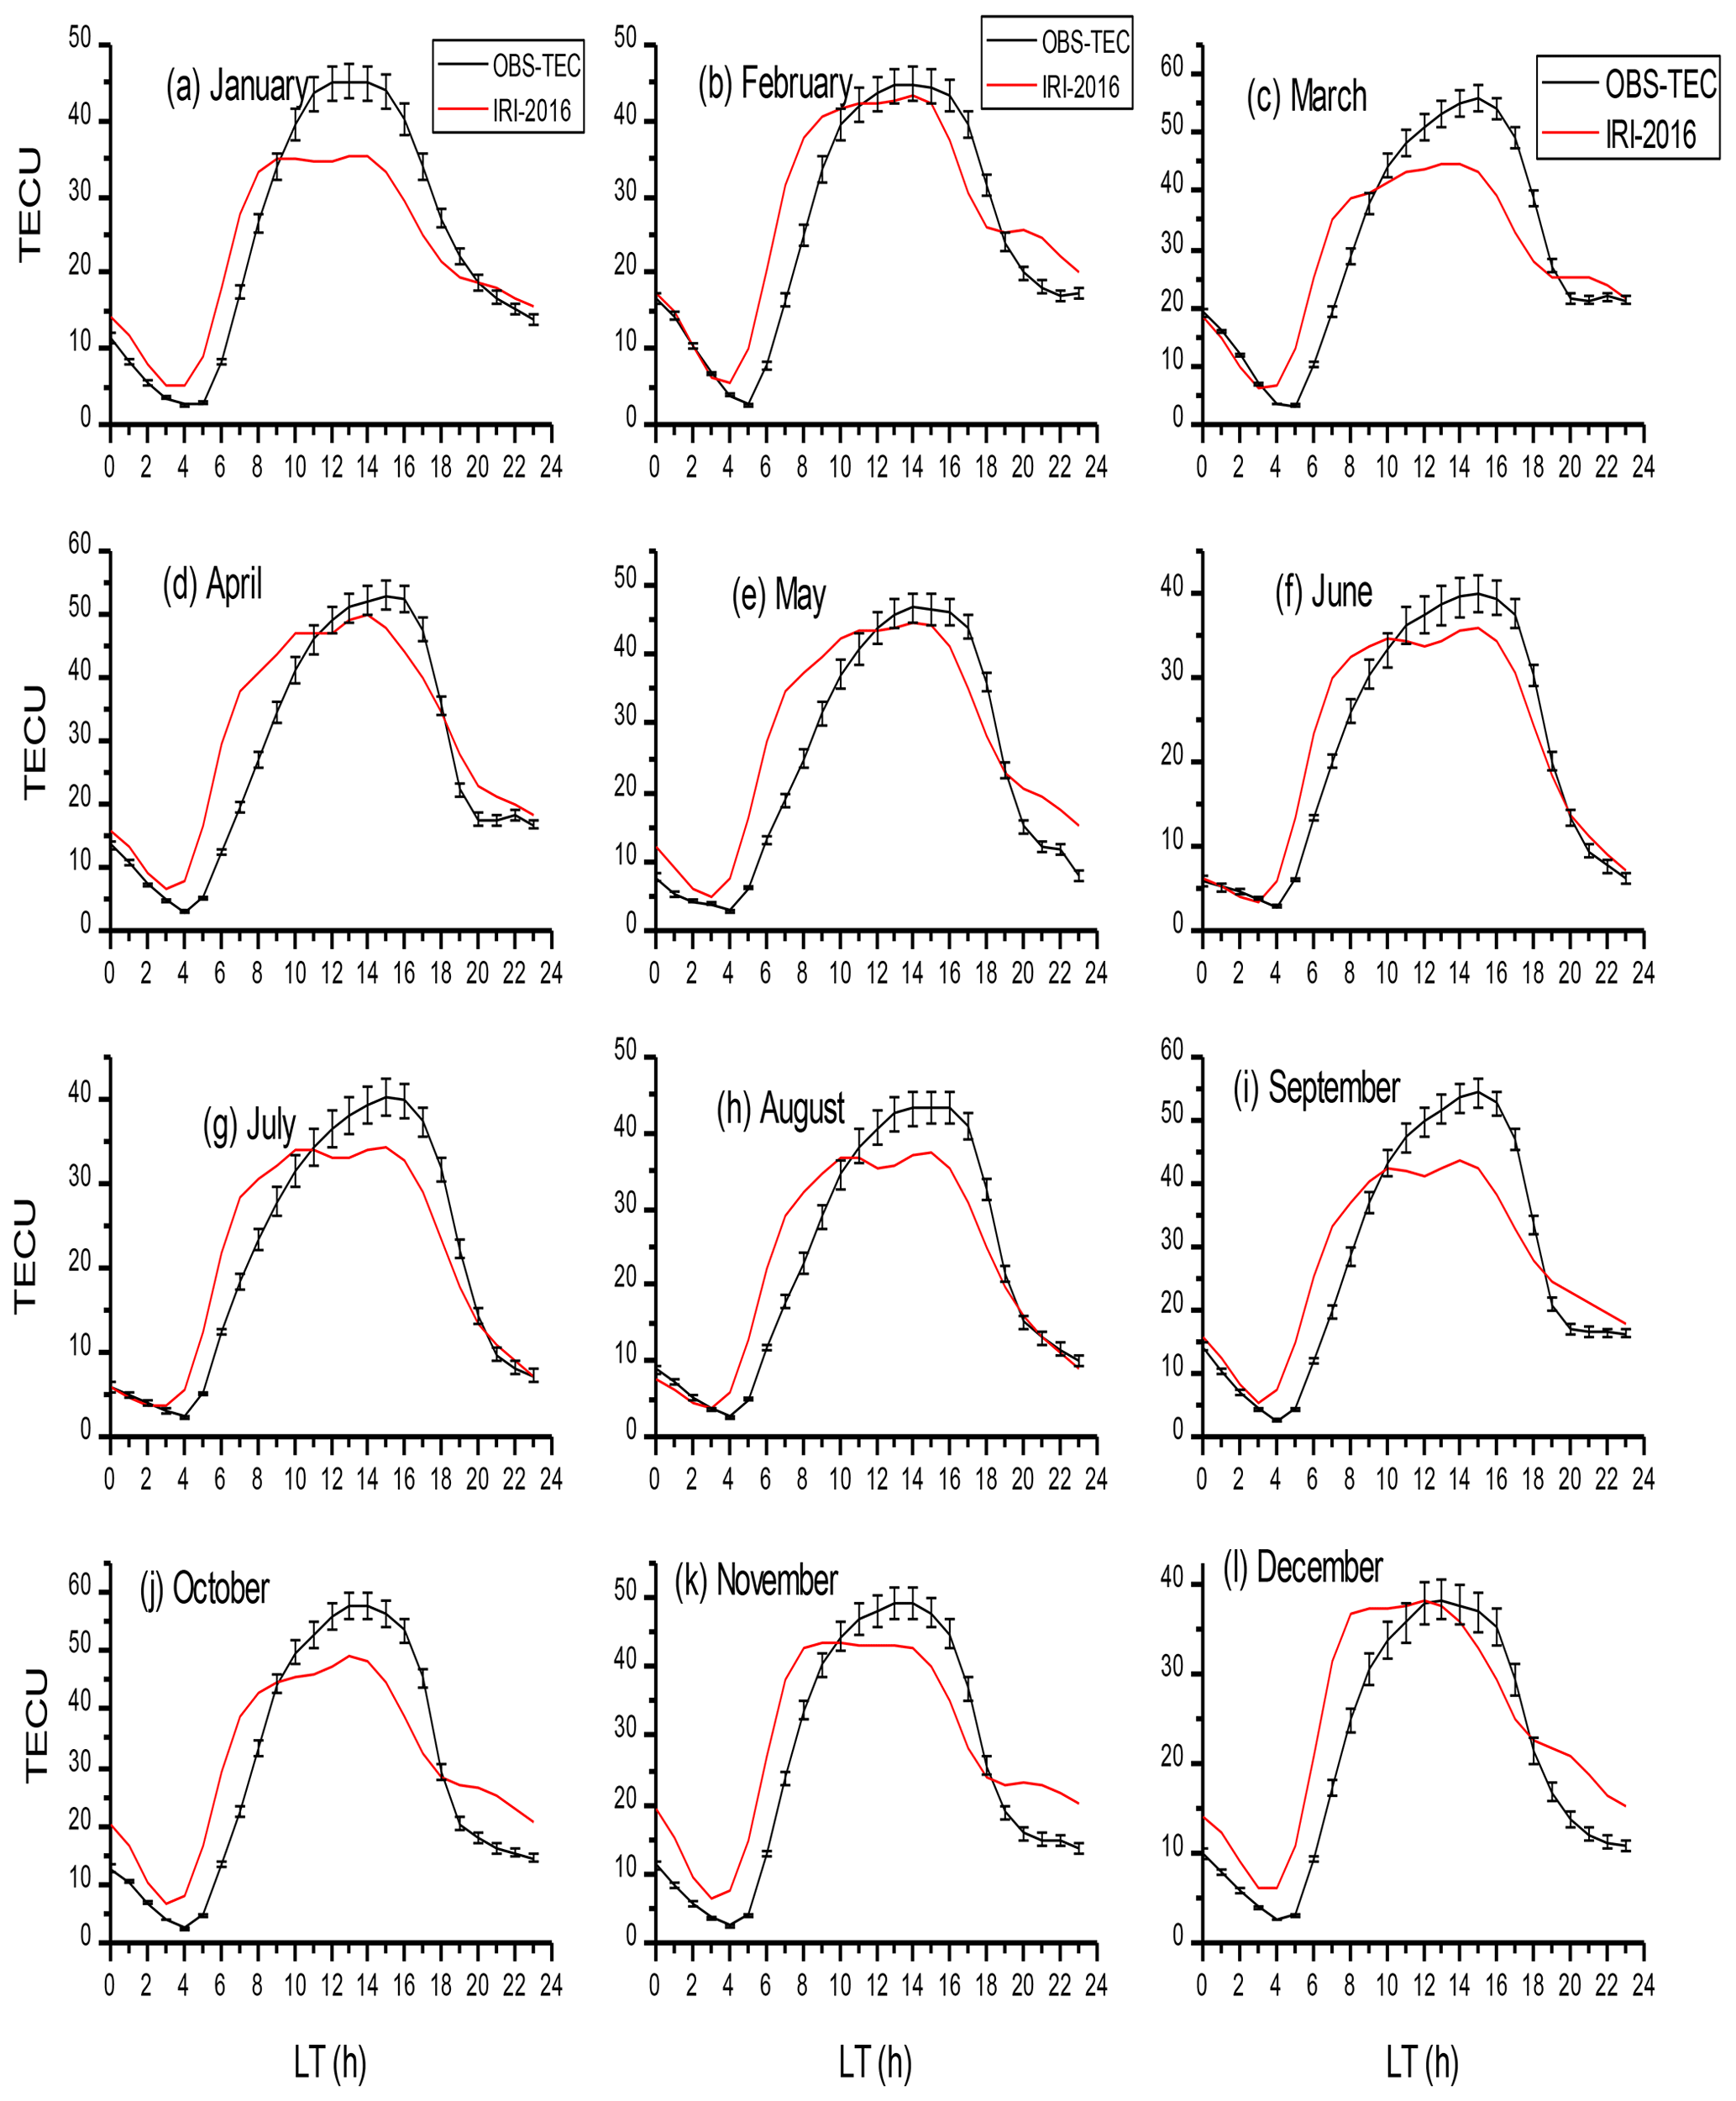
Figures 1 to 4 show the diurnal variation in OBS-TEC and the IRI-2016 model in the Nigerian equatorial ionosphere (NEI) for the years 2011 to 2014 respectively. OBS-TEC values were obtained from the GPS receiver installed at the Birnin Kebbi station. The diurnal variation in OBS-TEC and IRI-2016 model TEC reveals the typical characteristics of an equatorial and low-latitude ionosphere. We show the day-to-day variation in OBS-TEC, with an error bar showing the standard deviation from mean values. The study reveals that day-to-day variation in OBS-TEC is higher during the daytime than nighttime for all the years. It is a known fact that during the day, the sun causes variations in temperature, neutral wind, electron density and the electric field, thereby modulating the structure and evolution of the ionosphere and thermosphere (Gorney, 1990; Forbes et al., 2006). These figures show a steep rise in OBS-TEC from a minimum of ∼2 TECU between 03:00 and 05:00 LT in 2011, ∼3 TECU (04:00–05:00 LT) in 2012, and ∼3 TECU (03:00–05:00 LT) in 2013 and 2014. OBS-TEC increased to a broad daytime maximum between 12:00 and 14:00 LT for all years before falling to a minimum after sunset. The diurnal variation in the IRI-2016 model shows TEC increasing from a minimum of ∼2 TECU in 2011, ∼4 TECU in 2012 and 2013, and ∼5 TECU in 2014 between 03:00 and 04:00 LT for all years to a broad daytime peak between 08:00 and 14:00 LT before falling steeply to a minimum before sunset. Hence the IRI-2016 model attained its peak before OBS-TEC. Dabas et al. (2003), Somoye et al. (2011), Hajra et al. (2016) and D'ujanga et al. (2017) attributed the steep increase in TEC to the upward E×B vertical plasma drift and the rapid filling up of the magnetic field tube at sunrise due to solar extreme ultraviolet (EUV) ionization. During daytime, an eastward electric field at the Equator causes plasma to be lifted to greater heights. This dynamo-generated eastward electric field combined with the northward geomagnetic field lifts the equatorial ionosphere from 700 to 1000 km, resulting in additional ionization (D'ujanga et al., 2017; Somoye et al., 2011). Suranya et al. (2015) further mentioned that upward vertical E×B drift could lead to an equatorial ionization anomaly (EIA) and meridional winds. The magnetic field tubes then collapse after sunset due to low thermospheric temperature and Rayleigh–Taylor instability (RTI; Berkner and Wells, 1934), giving rise to the minimum TEC values after sunset. These results are similar to findings of Bolaji et al. (2012), Fayose et al. (2012), Okoh et al. (2014) and Eyelade et al. (2017), who have explored the NEI.
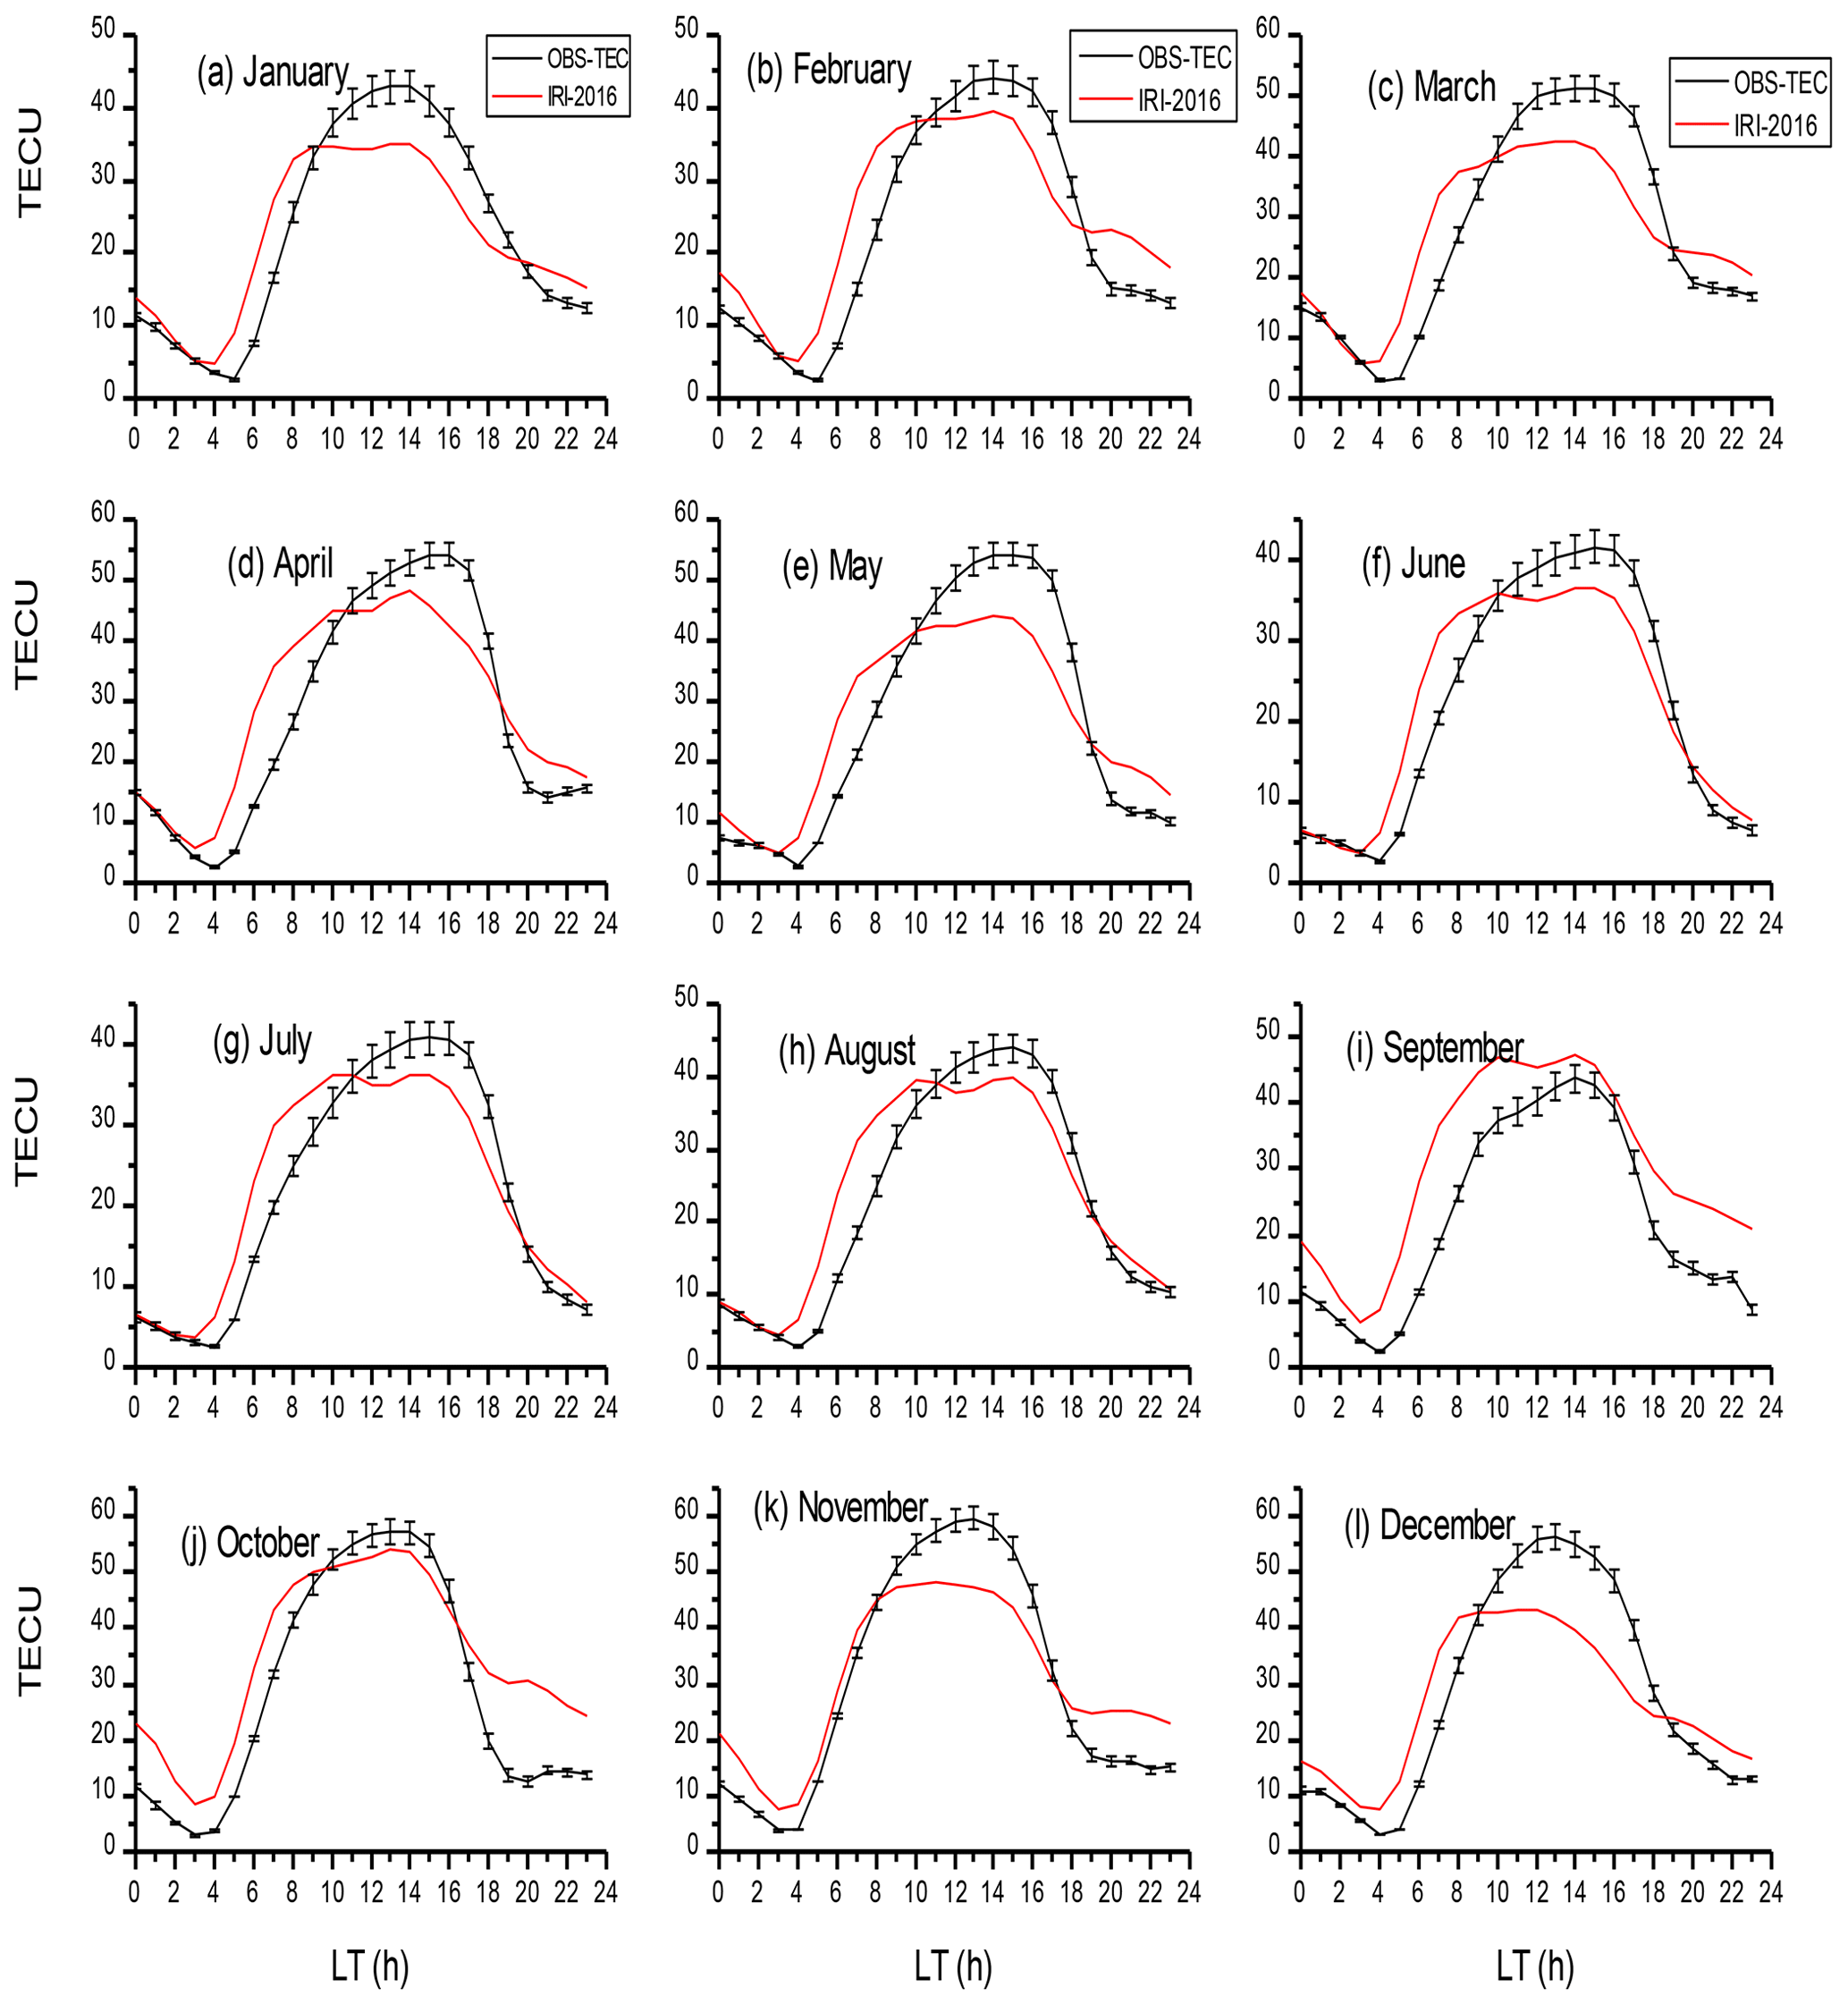
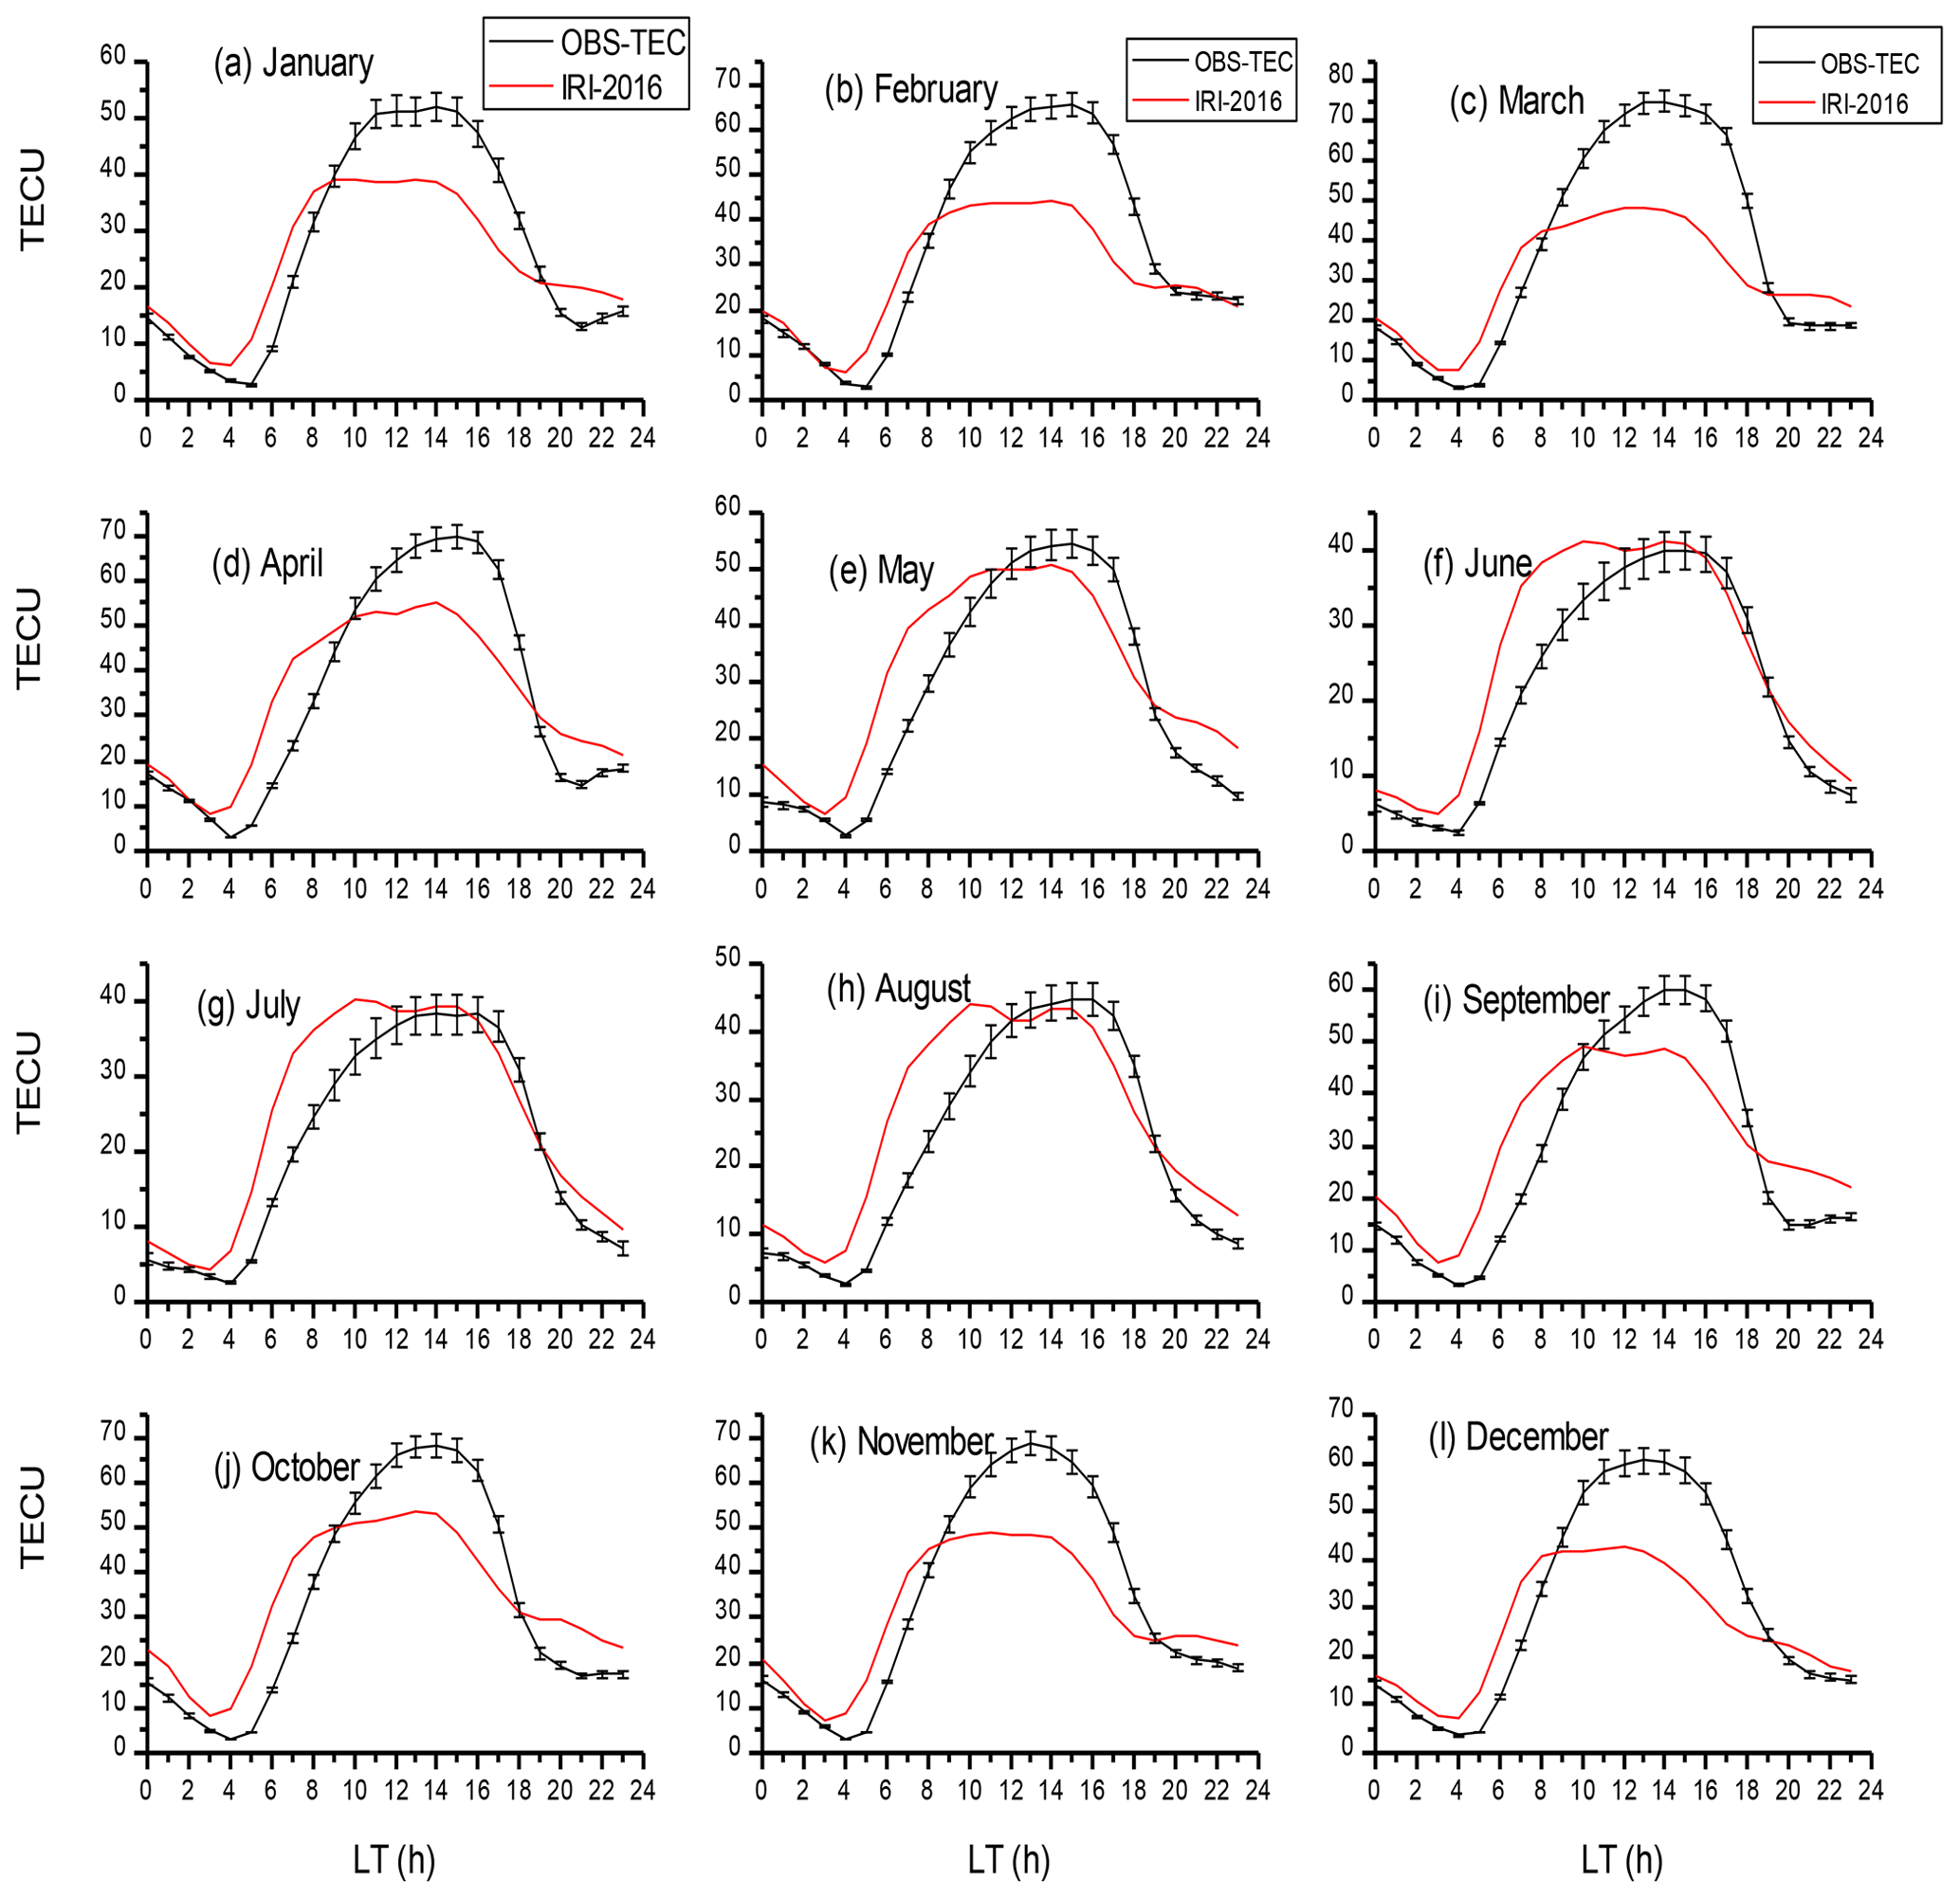
It can be seen that OBS-TEC is much higher in 2014, with a maximum value of up to 70 TECU in March compared with the IRI-2016 maximum of 54 TECU in the month of October 2014. The diurnal variation reveals that the peak of OBS-TEC for the majority of the months for all years shifted to slightly post-noon hours (13:00–14:00 LT). This type of peak shifting is peculiar to equatorial and low-latitude regions and the polar regions of the ionosphere, and it is found to depend on the equatorial ionization anomaly and solar zenith angle respectively (Rama Rao et al., 2009; D'ujanga et al., 2017). Another key observation seen in the diurnal variation in OBS-TEC is the post-sunset decrease and slight enhancement in some months. The nighttime enhancement of TEC, for example, in March, April and October of the year 2011; March and April of the year 2012; March, April, September and October of the year 2013; and January, April and September of the year 2014, was documented by previous researchers, like Rama Rao et al. (2009), D'ujanga et al. (2017) and Ayorinde et al. (2016). They attributed it to the product of an eastward- and westward-directed electric field, which produces an upward and downward motion of ionospheric plasma during the day and night respectively.
Figures 5 to 8 show the diurnal variation in percentage deviation of the IRI-2016 model from OBS-TEC in the NEI for all years respectively. On a general note, the IRI-2016 model only presented suitable predictions for the post-midnight hours between 00:00 and 03:00 LT of the day for all years. All other hours from 04:00 to 23:00 LT show some discrepancies. In fact, for some of the months, namely October, November and December 2012; October and December 2013; and September and October 2014, these discrepancies lasted throughout the day. However, in some other months, namely June, July and August 2011; June, July and August 2012; June and August 2013; and February, June and July 2014, these discrepancies collapsed during the pre-midnight hours (18:00–23:00 LT). It is also important to mention that the IRI-2016 model either overestimated or underestimated TEC in the NEI, especially during daytime hours, as shown in the plots.
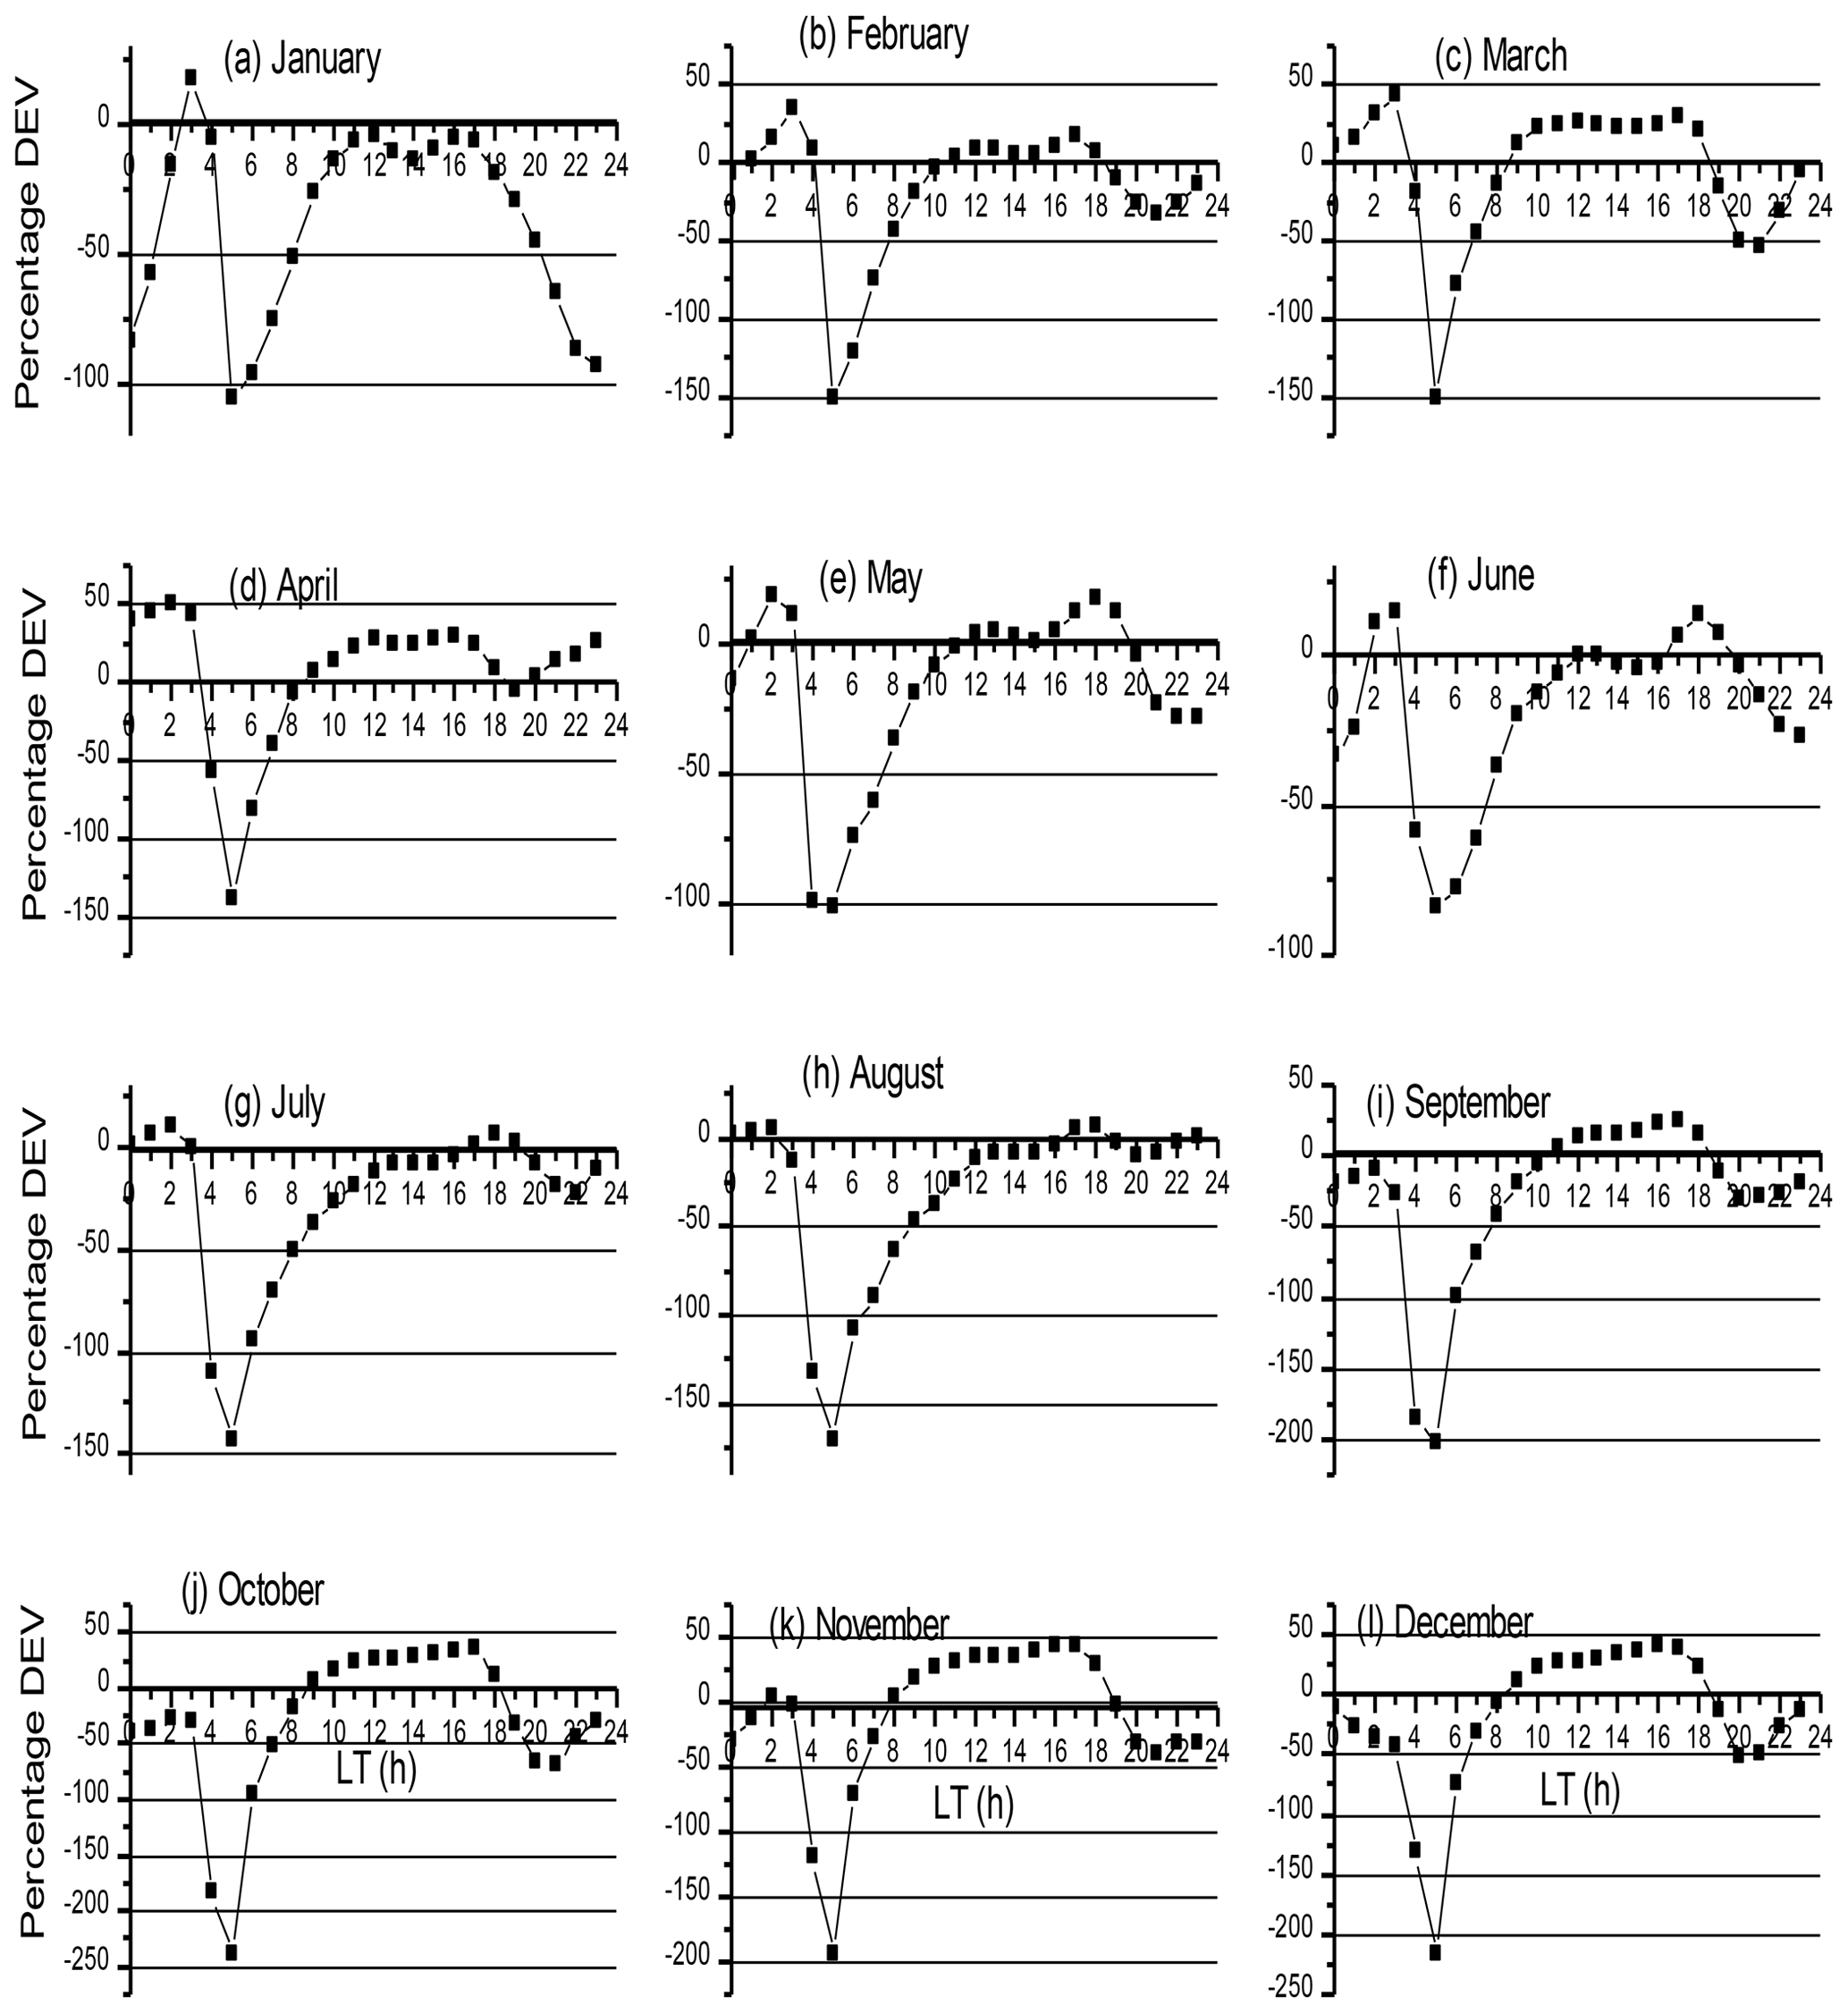

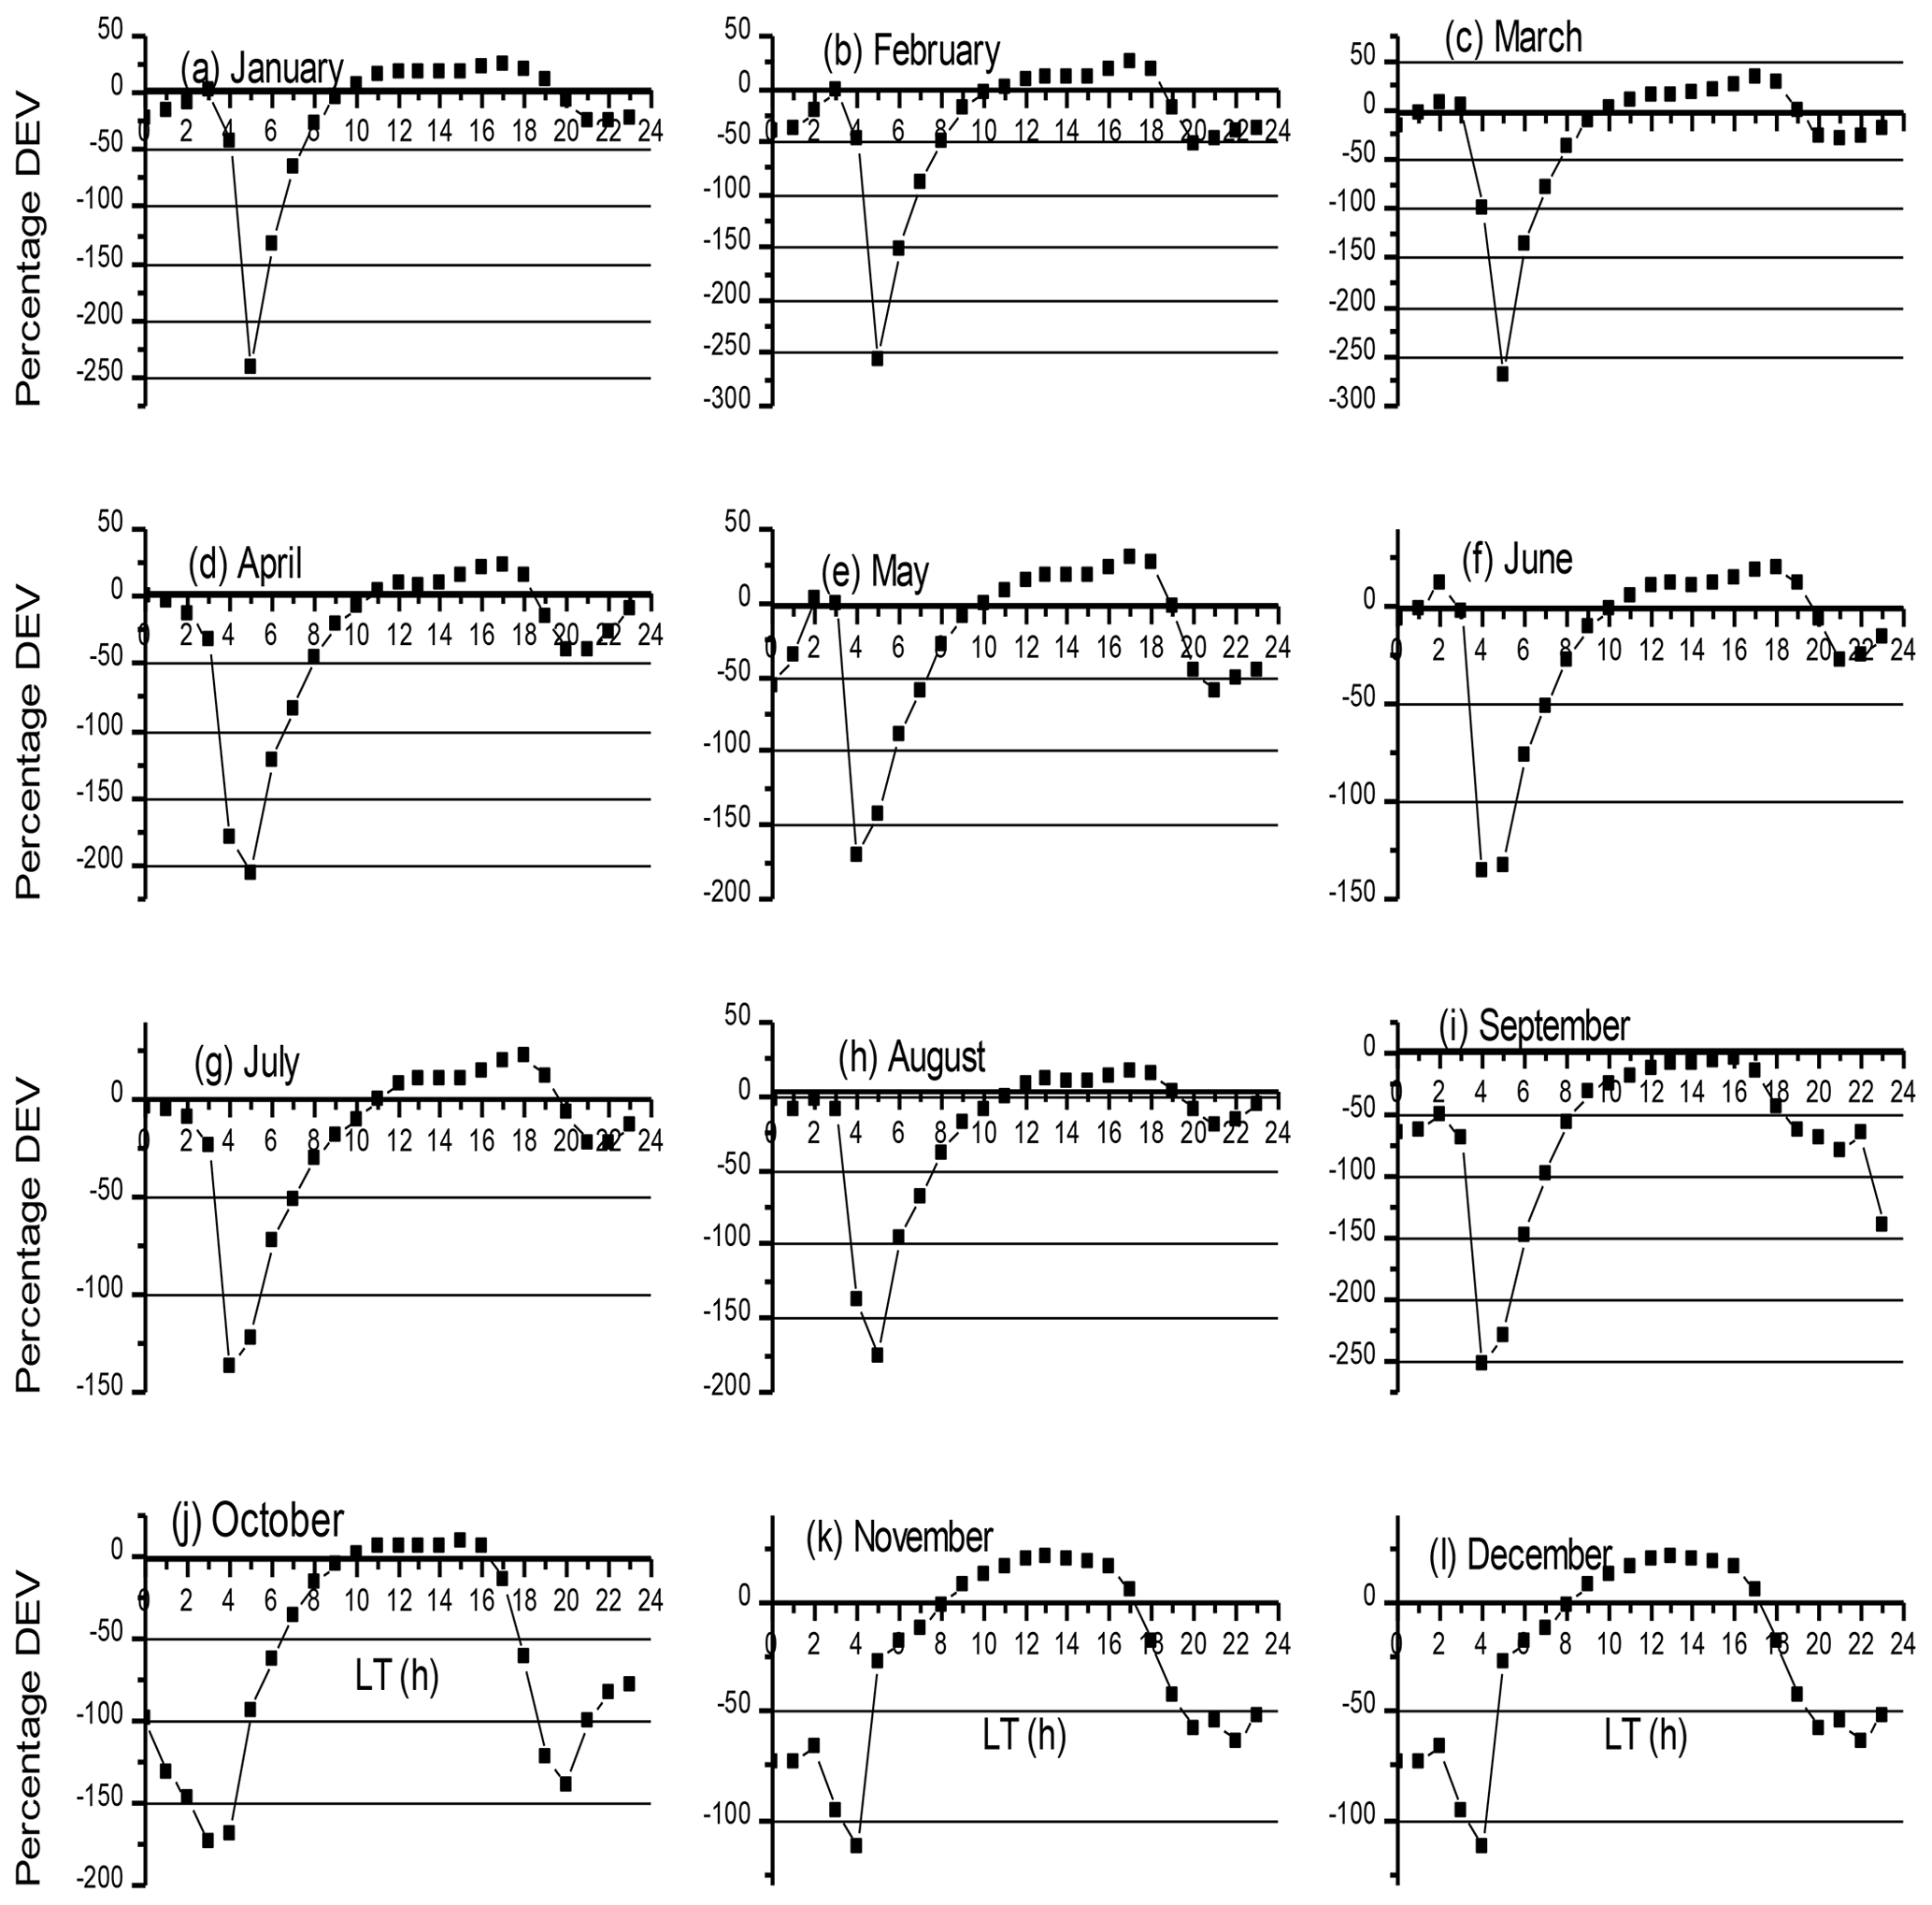
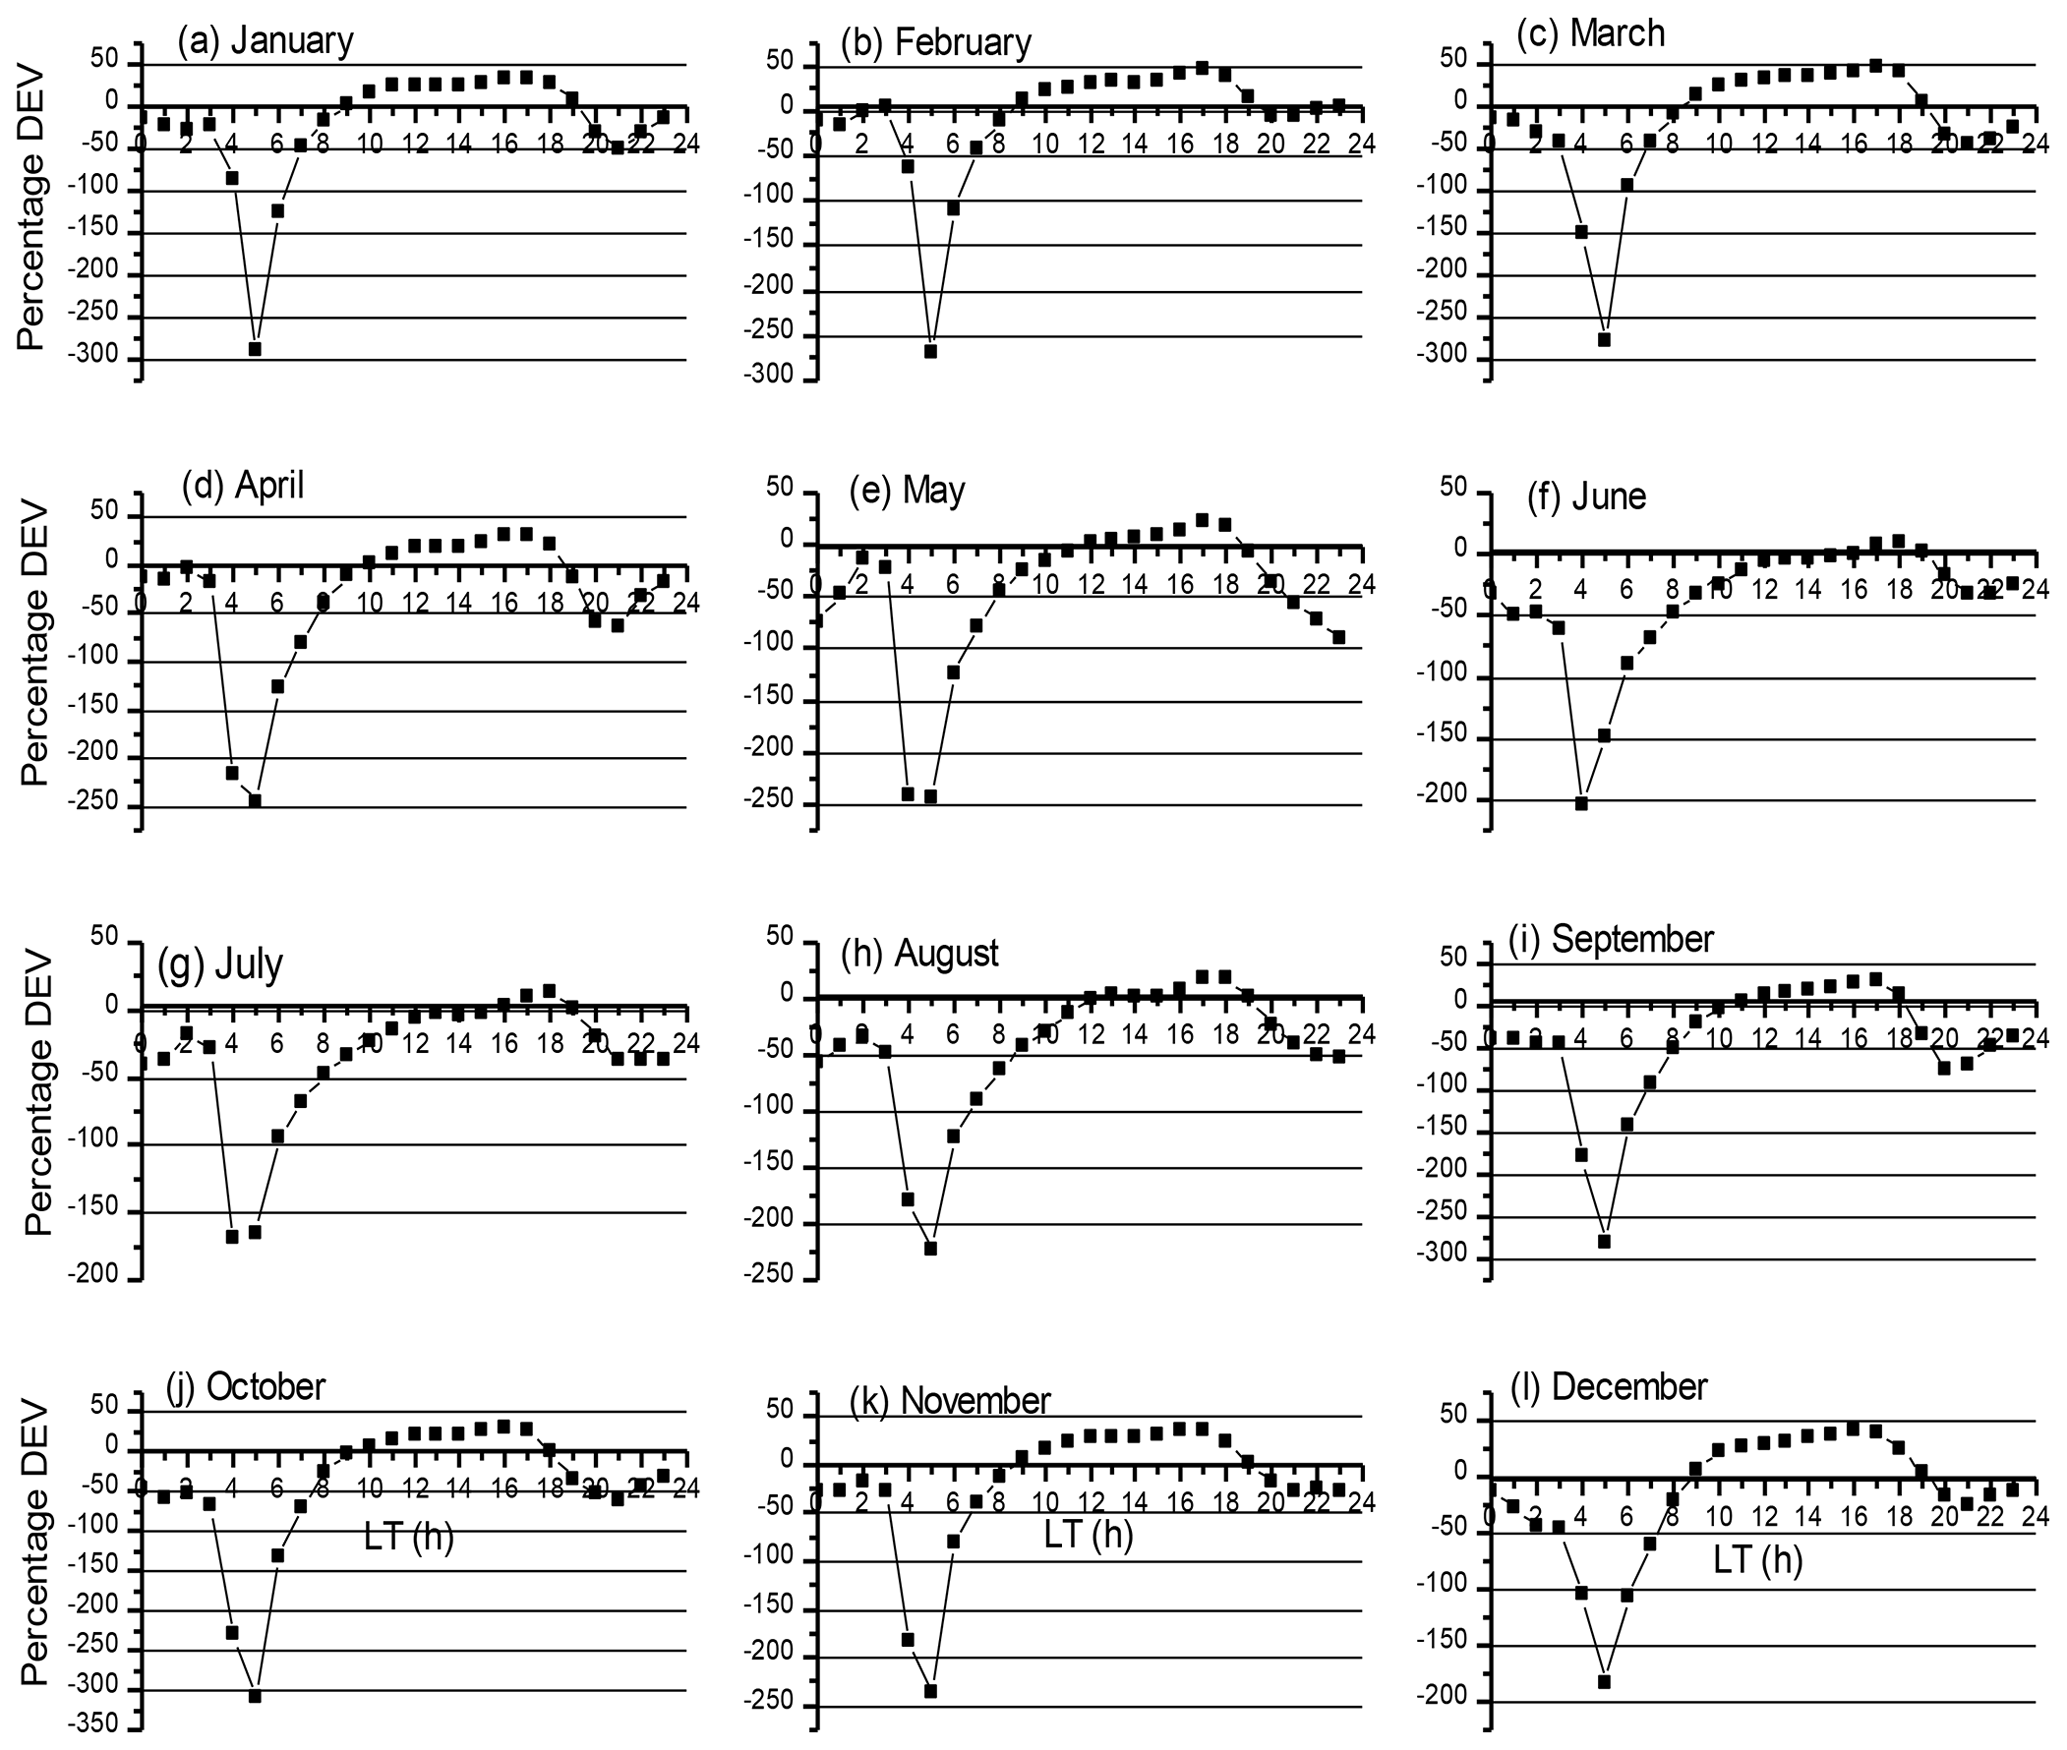
The mass plots in Figs. 5–8 further reveal that negative percentage deviation shows higher values of IRI-2016 than OBS-TEC values. The reverse is the case for positive percentage deviation. The highest negative percentage deviations are seen between 04:00 and 05:00 LT for all months throughout the years in this study. The highest negative percentage deviation of ∼300 % was recorded in the month of October 2014 at 05:00 LT. Table 2 shows the summary of months with daytime over- or underestimates of IRI-2016 in the NEI.
Table 2Months of daytime estimate of IRI-2016 model in NEI (source: author).
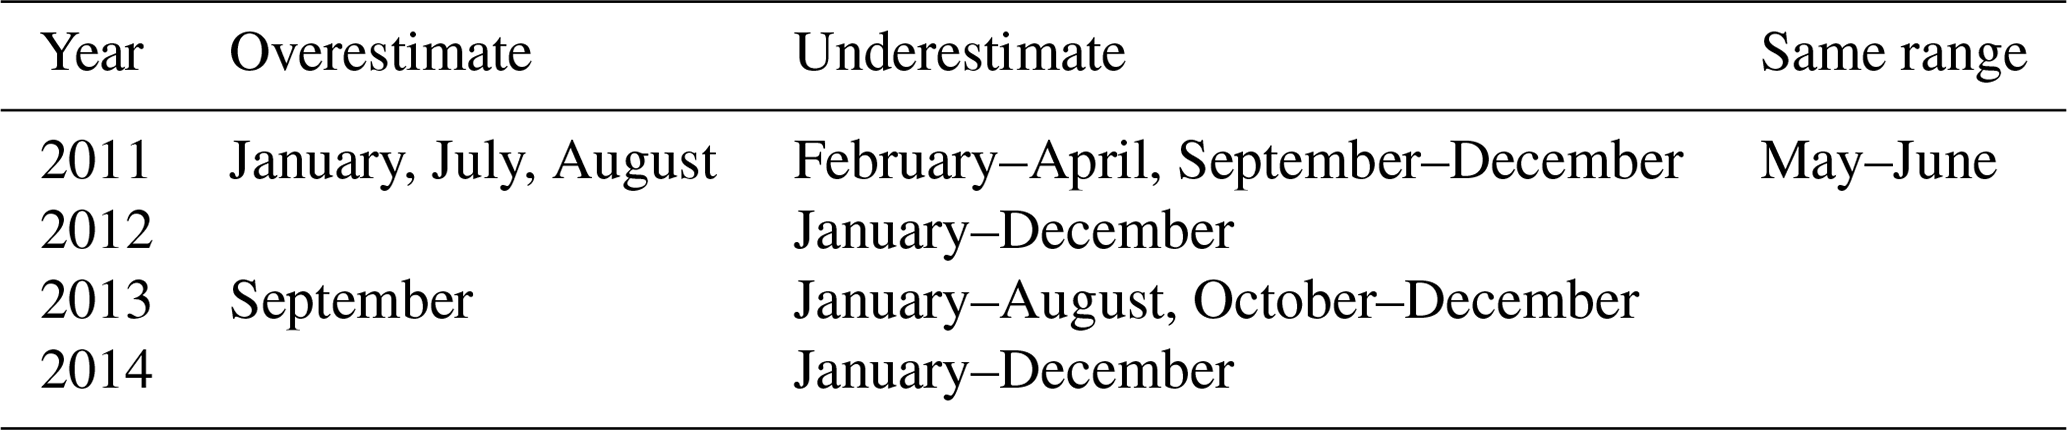
Therefore, it is clear from Figs. 1–8 and Table 2 that the IRI-2016 model did not predict well in the NEI. This may be attributed to insufficient data, which are a result of the sparse distribution of GPS infrastructure in this region. Our results agree with those of Komjathy et al. (1998), Lee and Reinisch (2006), and Malik et al. (2016). Bhuyan and Borah (2007) reported higher IRI TEC than their measured values at almost all times (in local time) in their location. Mosert et al. (2007) and Sethi et al. (2010) also reported discrepancies between of IRI TEC predictions and GPS TEC during high solar activity (HSA) and low solar activity (LSA) respectively at equatorial and low latitudes.
Figure 9 shows the seasonal variations in OBS-TEC for the 4 years investigated. The change in concentration of oxygen and molecular nitrogen has been reported to be the main cause of seasonal variation in ionospheric parameters. Seasonal variation in OBS-TEC in this study depicts semi-annual variation, with an equinoctial maximum (∼52 TECU) and solstitial minimum (∼44 TECU) in 2012. D'ujanga et al. (2017) reported that since the sun passes through the Equator during the equinox, both the March and September equinoxes experience the same solar radiation. It is also a well-established fact that 20 March and 23 September are the only times in the year when the solar terminator is perpendicular to the Equator, giving rise to the equinoctial maximum. The semi-annual variation resulting from the effect of equatorial ionization anomaly (EIA) in the ionosphere has been attributed to the effect of the solar zenith angle and magnetic field geometry (Wu et al., 2008; Rama Rao et al., 2006a). Another important feature of ionospheric parameters (known as equinoctial asymmetry), which is reported in the work of Bolaji et al. (2012), Akala et al. (2013), Eyelade et al. (2017), D'ujanga et al. (2017) and Aggarwal et al. (2017), is clearly seen for all years used in this work. Akala et al. (2013) also reported minimum and maximum seasonal VTEC values during the June solstice and December solstice respectively during the ascending phase of solar cycle 24. Equinoctial asymmetry is a strong phenomenon that occurs at low latitudes (Aggarwal et al., 2017), which has been explained in terms of the differences in the meridional winds leading to changes in the neutral gas composition during the equinoxes.
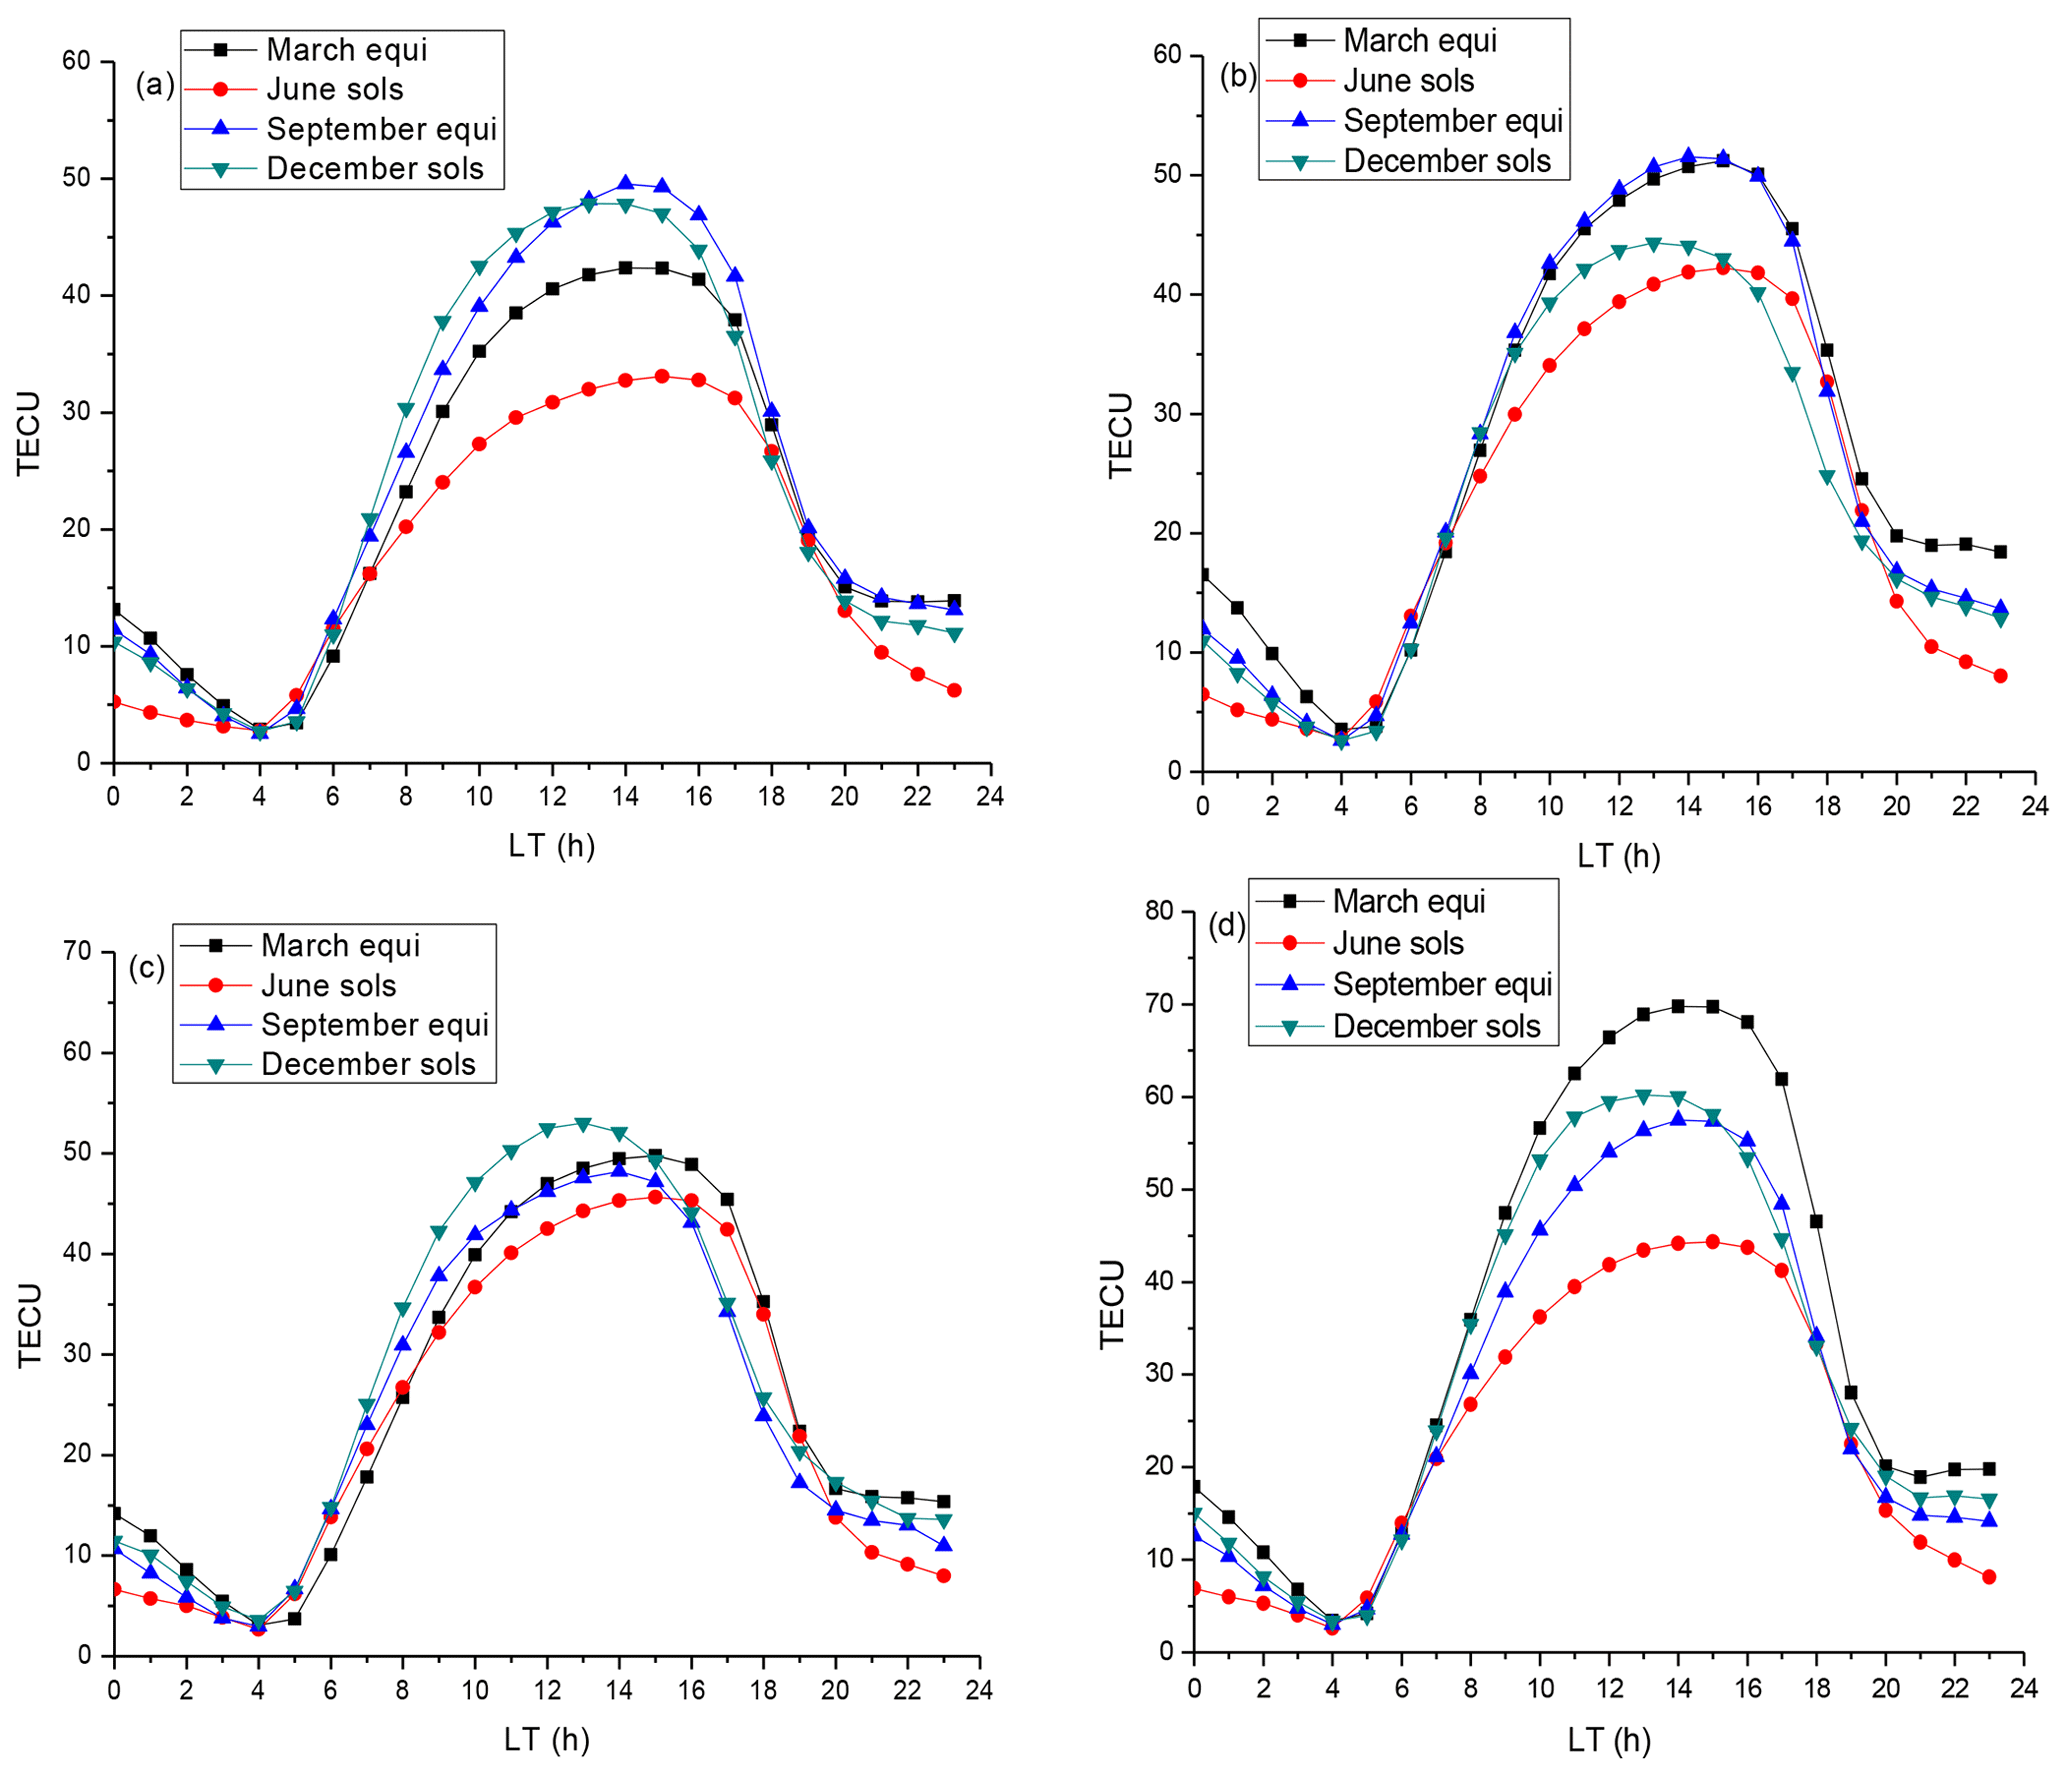
Figure 9Seasonal variation in observed OBS-TEC during (a) 2011, (b) 2012, (c) 2013 and (d) 2014; equi stands for equinox and sols stands for solstice.
In 2011, the September equinox and December solstice recorded a higher magnitude, followed by the March equinox; the lowest was in the June solstice. In 2013, the December solstice magnitude was highest, followed by the equinoxes in March and September, and it was lowest in the June solstice. This corresponds to results obtained by Akala et al. (2013) which they attributed to an increase in the ion production rate in the winter season and an anti-correlation between the December and June solstice pre-reversal velocity enhancement. In 2014, the March equinox magnitude was highest, and the December solstice and September equinox magnitudes were in about the same range, while the June solstice magnitudes were least. The December solstice magnitude is found to occur between the magnitudes of the equinoxes in 2011 and 2014. The September equinox magnitude and March equinox magnitude are observed to interchange in 2011 and 2014. Overall, the June solstice magnitudes were lowest during all the years. Titheridge (1974) attributed the smallest magnitudes from the June solstice to low ionization resulting from reduced production rates, i.e. the O∕N2 ratio.
Also, for all seasons, pre-midnight (18:00–23:00 LT) values of TEC are higher than post-midnight (00:00–05:00 LT) TEC values for all years. In 2011, pre-midnight TEC values are in the range of 8–30 TECU, while post-midnight TEC values range from 3 to 13 TECU. In 2012, pre-midnight TEC values are in the range of 9–35 TECU, while post-midnight TEC values are between 3 and 17 TECU. In 2013, the pre-midnight TEC values are between 9 and 35 TECU, while post-midnight TEC values range from 3 to 15 TECU. Finally in 2014, pre-midnight TEC values are between 9 and 47 TECU, while the post-midnight TEC ranges from 3 to 18 TECU. Furthermore, the maximum OBS-TEC values in 2011 (49 TECU) and 2012 (52 TECU) were recorded in the September equinox season. In 2013, OBS-TEC reached a maximum of 53 TECU in the December solstice, while in 2014, the maximum OBS-TEC (70 TECU) was recorded in the March equinox season in the NEI (western African sector). These results agree in general with those of D'ujanga et al. (2017), who obtained higher TEC values during the equinoxes than during the solstices in Ethiopia (eastern African sector). This same result was observed by Bagiya et al. (2009), who reported higher TEC values in equinoctial months than solstitial months in the Indian sector. While the former authors reported maximum TEC of ∼58 TECU during the equinox months, the latter authors reported maximum TEC of ∼50 TECU during the equinoxes. Seasonal variation in TEC is dependent on thermospheric neutral compositions, since during the day the Equator is hotter than the pole. Meridional winds therefore flow from the Equator towards the pole. This flow causes a change in the neutral composition, resulting in the decrease in the ratio of O∕N2 at the Equator. The decrease in the O∕N2 ratio increases the electron density, thus resulting in a TEC increase during the equinoxes (Bagiya et al., 2009). The corresponding annual range error (metres) of the season with maximum OBS-TEC, using a 1 TECU variation to represent an error of 0.16 m in the position, is summarized in Table 3.
Table 3Seasons of maximum OBS-TEC and their corresponding range error.
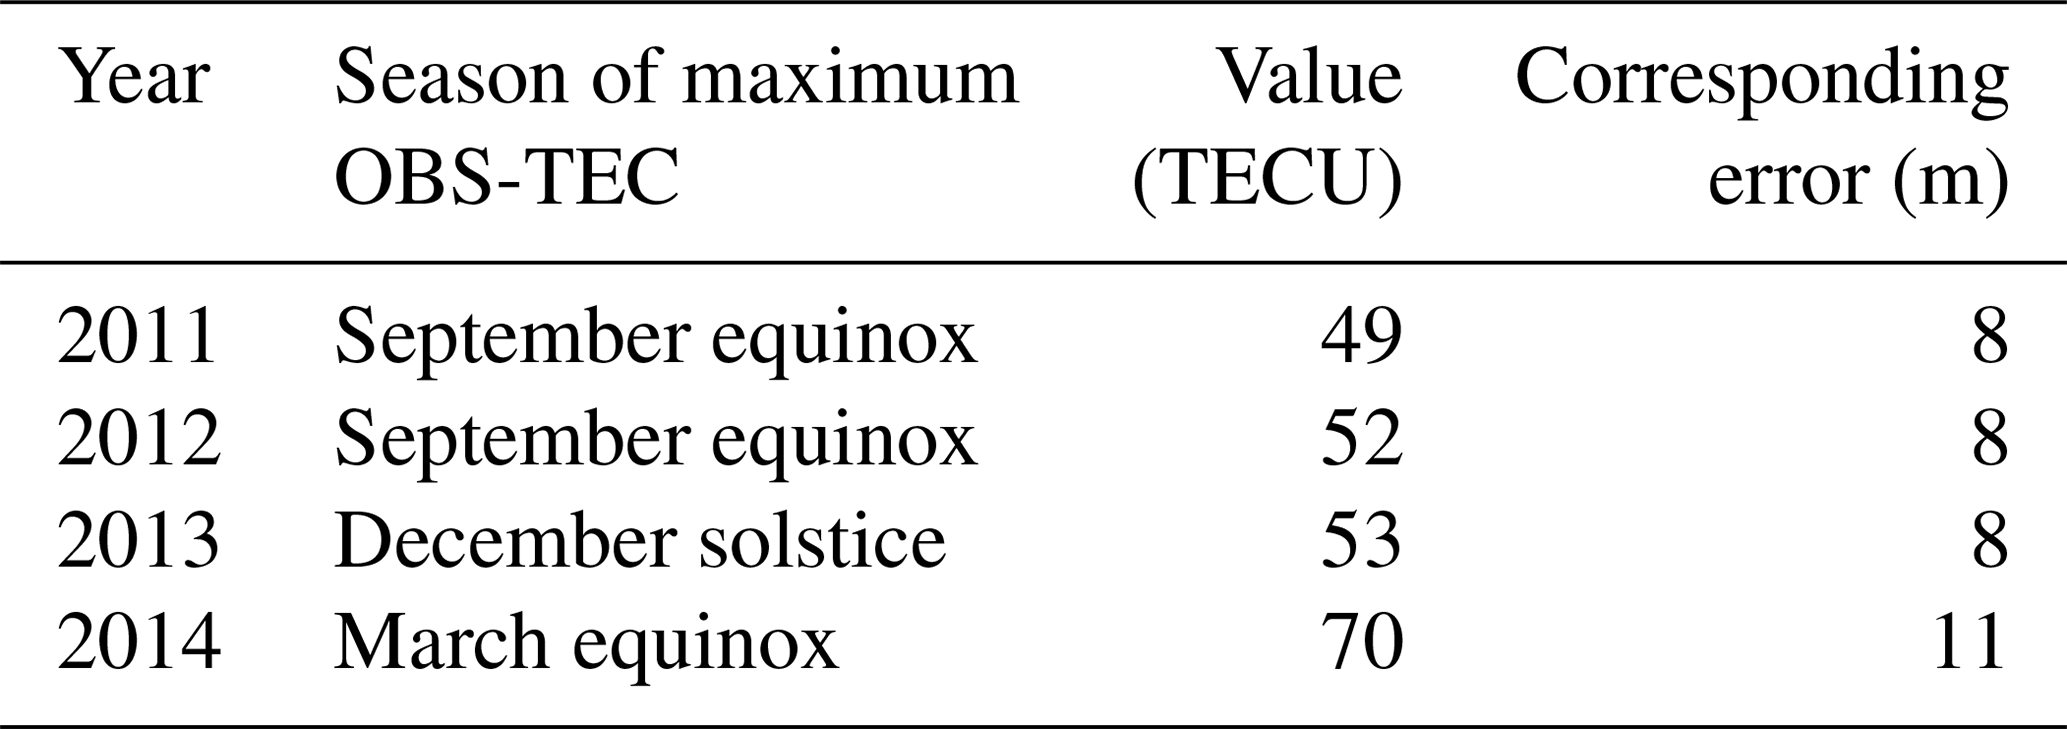
Figure 10 shows the comparison of the monthly mean OBS-TEC and monthly mean sunspot number, Rz, from 2011 to 2014, showing an increase and decrease in TEC following the solar cycle variations. Our results are in good agreement with those of Chakrabarty et al. (2012) and D'ujanga et al. (2017), who reported a direct solar cycle effect on TEC measurements. Solar cycle dependency of ionospheric parameters such as TEC provides useful information for studying the behaviour and variations in the physical and photochemical processes in the ionosphere (Liu et al., 2006). It is well documented that the variability in solar activity results in huge variations in the temperature, neutral wind, neutral density, ion and electron densities, and electric fields in the ionosphere (Forbes et al., 2006).
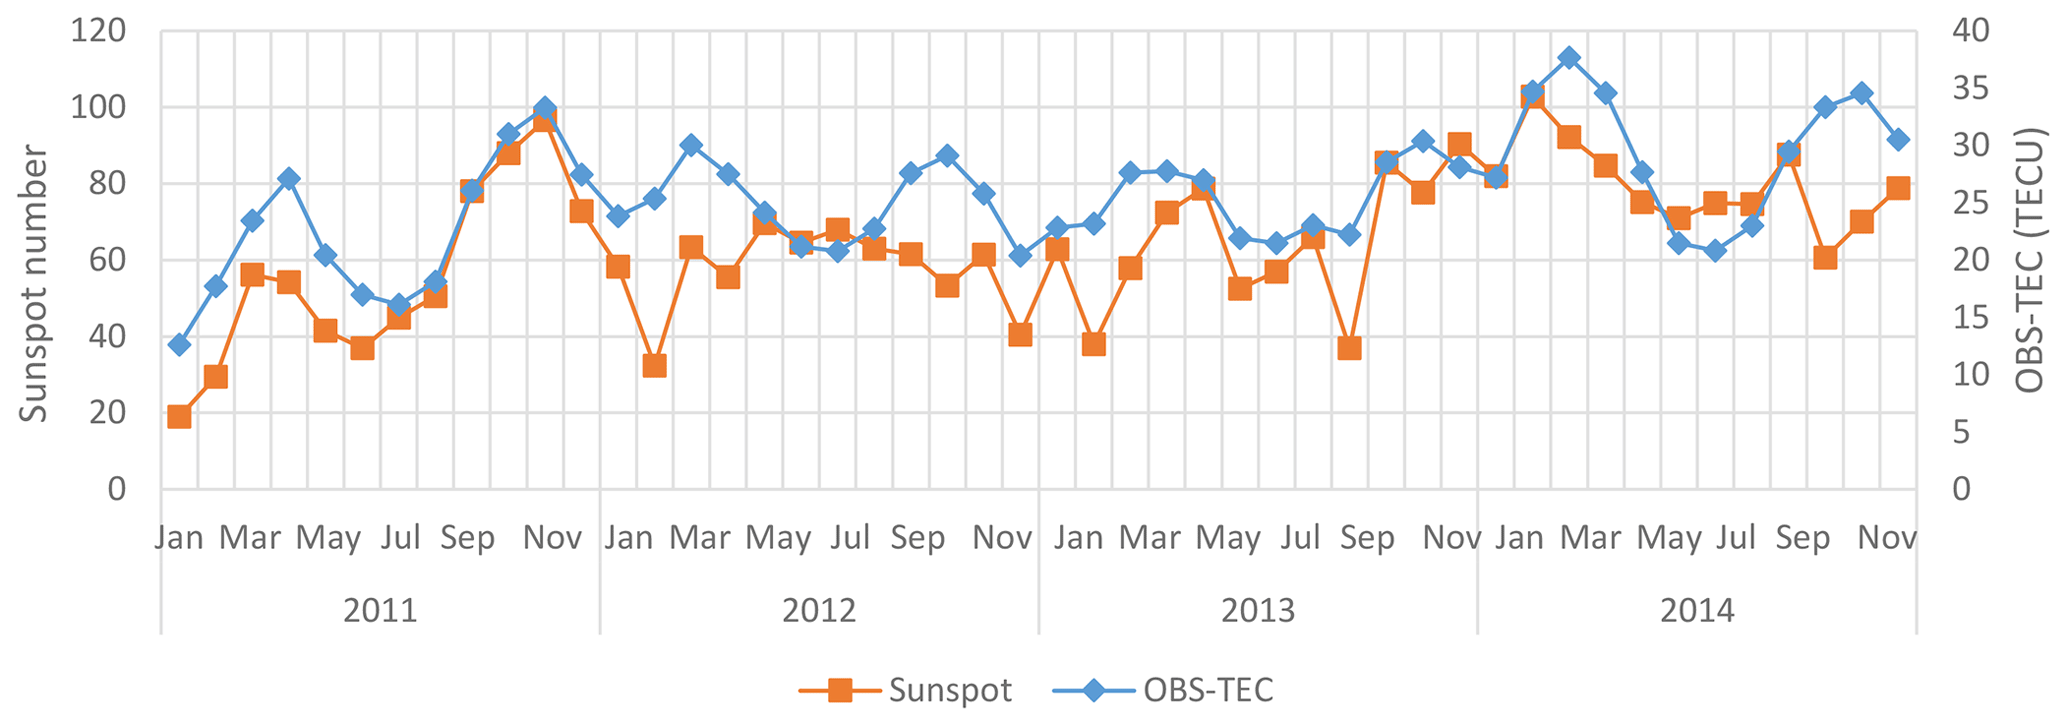
The present results also agree with those of Chauhan et al. (2011), who reported a direct solar control on TEC. Balan et al. (1994), Liu et al. (2011, 2006) and many others reported the same results during low and moderate solar activity; TEC and NmF2 increase linearly with solar proxies, but the linearity collapses during high solar activity. This agrees with our results, except for July 2012 and 2014, which show a saturation effect on TEC, i.e. a decrease in TEC with an increase in solar activity. The saturation effect on TEC was reported in the work of Balan et al. (1994, 1996), which concluded that the saturation effect has not been clarified and hence might be due to other factors near the Earth's environment and not to the influence of solar activity. We could not establish the cause of the saturation effect on TEC in this study; however, the saturation effect will be further investigated in future studies.
Studies on OBS-TEC and the IRI-2016 model at Birnin Kebbi in northern Nigeria during the ascending and maximum phases of solar cycle 24 were carried out. Our results show OBS-TEC and the IRI-2016 model rising from a minimum in the early hours of the day to a broad daytime maximum before falling steeply to a minimum after sunset for all years, which is due to photoionization increase produced by solar extreme ultraviolet (EUV) radiation (Anderson et al., 2004; D'ujanga et al., 2017). The diurnal variation reveals that the peak of OBS-TEC is often delayed when compared with the IRI-2016 model, with the maximum occurring in the afternoon and showing a dome-like shape, while noon bite-out, a special feature observed in equatorial and low latitudes, is seen in the peak of the majority of the plots of the IRI-2016 model. On a general note, we concluded that the IRI-2016 model cannot be used as a proxy for TEC measurements for most hours of the day for the years investigated. Our result agree with those of Komjathy et al. (1998), Lee and Reinisch (2006), Malik et al. (2016), Bhuyan and Borah (2007), Mosert et al. (2007), and Sethi et al. (2010) at their respective locations. For all seasons, pre-midnight (18:00–23:00 LT) values of TEC are higher than post-midnight (00:00–05:00 LT) TEC values during all years. Seasonal variation shows an asymmetry in the equinoxes and solstices in the NEI as also reported by Fayose et al. (2012) and Eyelade et al. (2017). Maximum OBS-TEC values in 2011 and 2012 were recorded in the September equinox. In 2013, OBS-TEC reached its maximum during the December solstice, while in 2014, the maximum OBS-TEC was recorded in the March equinox. This result agrees in general with those of D'ujanga et al. (2017) in the eastern African sector and Bagiya et al. (2009) in the Indian sector, which obtained higher TEC values during the equinoxes than during the solstices. Thermospheric neutral compositions are a major cause of seasonal variation in ionospheric parameters such as TEC, since during the day the Equator is hotter than the poles. Finally, monthly OBS-TEC varies linearly with an annual sunspot number, Rz, thus revealing strong dependence of TEC on solar activity (sunspot number). This linearity collapsed in the month of July of 2012 and 2014. OBS-TEC and the sunspot number were found to increase gradually from 2011 to 2014, in agreement with Chauhan et al. (2011), showing that there is a direct solar control on TEC.
The raw GPS observation data in RINEX format for Birnin Kebbi were obtained from the GNSS Continuously Operating Reference Stations (CORS) of the Nigerian GNSS Reference Network (NIGNET) operated by the Office of the Surveyor General of the Federation (OSGoF) of Nigeria. The NIGNET GPS data are available to the public at http://www.nignet.net (last access: 26 January 2018). Also TEC derived from IRI model can be accessed at https://ccmc.gsfc.nasa.gov/modelweb/models/iri2016_vitmo.php (last access: 4 November 2018). Values for the sunspot number were obtained from the Space Physics Interactive Data Resource website (https://www.ionosonde.spidr.com, last access: 14 March 2017). SPIDR is no longer functional. Values for the sunspot number can be obtained from other sources.
AO designed the study, obtained the data and wrote the first draft of the paper. OOy assisted in data processing. EOS and OOg analysed the data and wrote the protocol. RAAA and EOO managed the literature searches and read through the paper. All authors approved the final paper.
The authors declare that they have no conflict of interest.
We thank the Office of the Surveyor General of the Federation (OSGoF-Nigeria) for making TEC data available through the website https://www.nignet.net (last access: 26 January 2018). We also thank Yuki Hatanaka and Gopi Krishna for providing TEC processing software online. Finally, we appreciate Bilitza et al. (2017) for making the latest version of the IRI model available online.
This paper was edited by Ana G. Elias and reviewed by two anonymous referees.
Aggarwal, M., Bardhan, A., and Sharma, D. K.: Equinoctial asymmetry in ionosphere over Indian region during 2006–2013 using COSMIC measurements, Adv. Space Res., 60, 999–1014, 2017.
Akala, A. O., Somoye, E. O., Adeloye, A. B., and Rabiu, A. B.: Ionospheric foF2 variability at equatorial and low latitudes during high, moderate and low solar activity, Indian Journal of Radio and Space Physics, 40, 124–129, 2011.
Akala, A. O., Seemala, G. K., Doherty, P. H., Valladares, C. E., Carrano, C. S., Espinoza, J., and Oluyo, S.: Comparison of equatorial GPS-TEC observations over an African station and an American station during the minimum and ascending phases of solar cycle 24, Ann. Geophys., 31, 2085–2096, https://doi.org/10.5194/angeo-31-2085-2013, 2013.
Alizadeh, M. M., Wijaya, D. D., Hobiger, T., Weber, R., and Schuh, H.: Ionospheric effects on microwave signals, in: Atmospheric Effect in Space Geodesy, edited by: Bohm, J. and Schuh, H., Atmospheric Sciences, https://doi.org/10.1007/978-3-642-36932-2_2, Springer-Verlag Berlin Heidelberg, 2013.
Anderson, D., Anghel, A., Chau, J., and Veliz, O.: Daytime vertical E×B drift velocities inferred from ground-based magnetometer observations at low latitudes, Space Weather, 2, S11001, https://doi.org/10.1029/2004SW000095, 2004.
Ayorinde, T. T., Rabiu, A. B., and Amory-Mazaudier, C.: Inter-hourly variability of Total Electron Content during the quiet condition over Nigeria within the Equatorial Ionization Anomaly region, J. Atmos. Sol.-Terr. Phy., 145, 21–33, 2016.
Bagiya, M. S., Joshi, H. P., Iyer, K. N., Aggarwal, M., Ravindran, S., and Pathan, B. M.: TEC variations during low solar activity period (2005–2007) near the Equatorial Ionospheric Anomaly Crest region in India, Ann. Geophys., 27, 1047–1057, https://doi.org/10.5194/angeo-27-1047-2009, 2009.
Balan, N., Bailey, G. J., and Moffett, R. J.: Modelling studies of ionospheric variations during an intense solar cycle, J. Geophys. Res., 99, 17467–17475, 1994.
Balan, N., Bailey, G. J., and Su, Y. Z.: Variations of the ionosphere and related solar fluxes during solar cycle 21 and 22, Adv. Space Res., 18, 11–14, 1996.
Berkner, L. V. and Wells, H. W.: F-region ionosphere – investigation at low latitude, Terres. Magn., 39, 215–230, 1934.
Bhuyan, P. K. and Borah, R. R.: TEC derived from GPS network in India and comparison with the IRI, Adv. Space Res., 39, 830–840, 2007.
Bilitza, D., Altadill, D., Zhang, Y., Mertens, C., Truhlik, V., Richards, P., McKinnell, L. A., and Reinisch, B.: International reference ionosphere 2012 – A model of international collaboration, J. Space Weather Spac., 4, 1–12, https://doi.org/10.1051/swsc/2014004, 2014.
Bilitza, D., Altadill, D., Truhlik, V., Shubin, V., Galkin, I., Reinisch, B., and Huang, X.: International reference ionosphere 2016: from ionospheric climate to real-time weather predictions, Space Weather, 15, 418–429, https://doi.org/10.1002/2016SW001593, 2017.
Bolaji, O. S., Adeniyi, J. O., Radicella, S. M., and Doherty, P. H.: Variability of total electron content over an equatorial West African station during low solar activity, Radio Sci., 47, RS1001, https://doi.org/10.1029/2011RS004812, 2012.
Chakrabarty, D., Bagiya, M. S., Thampi, S. V., and Iyer, K. N.: Solar EUV flux (0.1–50 nm), F10.7 cm flux, sunspot number and total electron content in the crest region of the ionization anomaly during the deep minimum between solar cycle 23 and 24, Indian Radio and Space Phys., 41, 110–120, 2012.
Chauhan, V., Singh, O. P., and Singh, B.: Diurnal and seasonal variation of GPS-TEC during a low solar activity period as observed at a low latitude station Agra, Indian J. Radio Space Phys., 40, 26–36, 2011.
Ciraolo, L. and Spalla, P.: TEC analysis of IRI simulated data, Adv. Space Res., 29, 959–966, 2002.
Codrescu, M. V., Palo, S. E., Zhang, X., Fuller-Rowell, T. J., and Poppe, C.: TEC climatology derived from TOPEX/POSEIDON measurements, Journal of Atmospheric Solution, 61, 281–298, 1999.
Dabas, R. S., Singh, L., Lakshmi, D. R., Subramanyam, P., Chopra, P., and Garg, S. C.: Evolution and dynamics of equatorial plasma bubbles: relationships to E×B drifts, post-sunset total electron content enhancements, and equatorial electrojet strength, Radio Sci., 38, 1075, https://doi.org/10.1029/2001RS002586, 2003.
D'ujanga, F. M., Opio, P., and Twinomugisha, F.: Variation of total electron content with solar activity during the ascending phase of solar cycle 24 observed at Makerere University, Kampala, in: Space Weather: Longitude and Hemispheric Dependences and Lower Atmosphere Forcing, edited by: Fuller-Rowell, T., Yizengaw, E., Doherty, P. H., and Basu, S., Geophysical Monograph 220, 1st Edn., American Geophysical Union, John Wiley & Sons, Inc., New Jersey, USA, 2017.
Eyelade, V. A., Adewale, A. O., Akala, A. O., Bolaji, O. S., and Rabiu, A. B.: Studying the variability in the diurnal and seasonal variations in GPS total electron content over Nigeria, Ann. Geophys., 35, 701–710, https://doi.org/10.5194/angeo-35-701-2017, 2017.
Fayose, R. S., Rabiu, B., Oladosu, O., and Groves, K.: Variation of total electron content (TEC) and their effect on GNSS over Akure. Nigeria, Applied Physics Research, 4, 105–109, 2012.
Forbes, J. M., Bruinsma, S., and Lemoine, F. G.: Solar rotation effects in the thermospheres of Mars and Earth, Science, 312, 1366–1368, 2006.
Gorney, D. J.: Solar cycle effects on the near-earth space environment, Rev. Geophys., 28, 315–336, 1990.
Hajra, R., Chakraborty, S. K., Tsurutani, B. T., DasGupta, A., Echer, E., Brum, C. G. M., Gonzalez, W. D., and Sobral, H. A.: An empirical model of ionospheric total electron content (TEC) near the crest of the equatorial ionization anomaly (EIA), J. Space Weather Space Clim., 6, A29, https://doi.org/10.1051/swsc/2016023, 2016.
Jee, G., Schunk, R. W., and Scherliess, L.: Analysis of TEC data from the TOPEX/Poseidon mission, J. Geophys. Res., 109, A01301, https://doi.org/10.1029/2003JA010058, 2004.
Komjathy, A., Langley, R., and Bilitza, D.: ingesting GPS-derived data into the IRI for single frequency radar altimeter ionospheric delay corrections, Adv. Space Res., 22, 793–802, 1998.
Langley, R., Fedrizzi, M., Paula, E., Santos, M., and Komjathy, A.: Mapping the low latitude ionosphere with GPS, GPS World, 13, 41–46, 2002.
Lee, C. C. and Reinisch, B. W.: Quiet condition hmF2, NmF2 and Bo variations at Jicamarca and comparison with IRI-2001 during solar maximum, J. Atmos. Sol.-Terr. Phy., 68, 2138–2146, 2006.
Liu, L., Wang, W., Ning, B., Pirog, O. M., and Kurkin, V. I.: Solar activity variations of the ionospheric peak electron density, J. Geophys. Res., 111, A08304, https://doi.org/10.1029/2006JA011598, 2006.
Liu, L., Wang, W., Chen, Y., and Le, H.: Solar activity effects on the ionosphere: A brief review, Space Physics and Space Weather Geophysics, Chinese Sci. Bull., 56, 1202–1211, 2011.
Malik, R. A., Abdullah, M., Abdullah, S., and Homam, M. J.: Comparison of Maximum Useable Frequency (MUF) variability over Peninsular Malaysian with IRI Model during the rise of solar cycle 24, J. Atmos. Sol.-Terr. Phy., 138–139, 87–92, 2016.
Maruyama, T., Ma, G., and Nakamura, M.: Signature of TEC storm on 6 November 2001 derived from dense GPS receiver network and ionosonde chain over Japan, J. Geophys. Res., 109, A10302, https://doi.org/10.1029/2004JA010451, 2004.
Mosert, M., Gende, M., Brunini, C., Ezquer, R., and Altadill, D.: Comparisons of IRI TEC with GPS and Digisonde measurements at Ebro, Adv. Space Res., 39, 841–847, 2007.
Okoh, D., Lee-Anne McKinnell, L., Cilliers, P., Okere, B., Okonkwo, C., and Rabiu, A. B.: IRI-VTEC versus GPS-vTEC for Nigerian SCINDA GPS stations, Adv. Space Res., 55, 1941–1947, https://doi.org/10.1016/j.asr.2014.06.037, 2014.
Ogunmodimu, O., Rogers, N. C., Falayi, E., and Bolaji, S.: Solar Flare induced cosmic noise absorption, NRIAG Journal of Astronomy and Geophysics, 7, 31–39, 2018.
Ogwala, A., Somoye, E. O., Oyedokun, O., Adeniji-Adele, R. A., Onori, E. O., Ogungbe, A. S., Ogabi, C. O., Adejo, O., Oluyo, K. S., and Sode, A. T.: Analyses of Total Electron Content over Northern and Southern Nigeria, J. Res. Rev. Sci., 4, 21–27, 2018.
Rama Rao, P. V. S., Gopi Krishna, S., Niranjan, K., and Prasad, D. S. V. V. D.: Study of spatial and temporal characteristics of L-band scintillations over the Indian low-latitude region and their possible effects on GPS navigation, Ann. Geophys., 24, 1567–1580, https://doi.org/10.5194/angeo-24-1567-2006, 2006a.
Rama Rao, P. V. S., Gopi Krishna, S., Niranjan, K., and Prasad, D. S. V. V. D.: Temporal and spatial variations in TEC using simultaneous measurements from the Indian GPS network of receivers during the low solar activity period of 2004–2005, Ann. Geophys., 24, 3279–3292, https://doi.org/10.5194/angeo-24-3279-2006, 2006b.
Rama Rao, P. V. S., Niranjan, K., Prasad, D. S. V. V. D., Gopi Krishna, S., and Uma, G.: On the validity of the ionospheric pierce point (IPP) altitude of 350 km in the Indian equatorial and low-latitude sector, Ann. Geophys., 24, 2159–2168, https://doi.org/10.5194/angeo-24-2159-2006, 2006c.
Rama Rao, P. V. S., Gopi Krishna, S., Vara Prasad, J., Prasad, S. N. V. S., Prasad, D. S. V. V. D., and Niranjan, K.: Geomagnetic storm effects on GPS based navigation, Ann. Geophys., 27, 2101–2110, https://doi.org/10.5194/angeo-27-2101-2009, 2009.
Sethi, N. K., Pandey, V. K., and Mahajan, K. K.: Comparative study of TEC with IRI model for solar minimum period at low latitude, Adv. Space Res., 27, 45–48, 2010.
Somoye, E. O.: Diurnal and seasonal variation of fading rates of E- and F-region echoes during IGY and IQSY at the equatorial station of Ibadan, Indian Journal of Radio and Space Physics, 38, 194–202, 2010.
Somoye, E. O. and Akala, A. O.: Comparison Of Diurnal, Seasonal And Latitudinal Effect Of Muf Vr And NmF2 Vr During Some Solar Cycle Epochs, Adv. Space Res., 47, 2182–2187, 2010.
Somoye, E. O., Akala, A. O., and Ogwala, A.: Day-to-day variability of h′F and foF2 during some solar cycle epochs, J. Atmos. Sol.-Terr. Phy., 73, 1915–1922, 2011.
Stankov, S. M.: Trans-ionospheric GPS signal delay gradients observed over mid-latitude Europe, Adv. Space Res., 43, 1314–1324, 2009.
Suranya, P. L., Prasad, D. S. V. V. D., Niranjan, K., and Rama Rao, P. S. V.: Short term variability in foF2 and TEC over low latitude stations in the Indian sector, Indian Journal of Radio and Space Physics, 44, 14–27, 2015.
Sunda, S. and Vyas, B. M.: Local time, seasonal and solar cycle dependency of longitudinal variations of TEC along the crest of EIA over India, J. Geophys. Res., 118, 6777–6785, 2013.
Tariku, Y. A.: Pattern of GPS-TEC variability over low-latitude regions (African sector) during the deep solar minimum (2008 to 2009) and solar maximum (2012 to 2013) phases, Earth Planets Space, 67, 35, https://doi.org/10.1186/s40623-015-0206-2, 2015.
Titheridge, J. E.: Changes in atmospheric composition inferred from ionospheric production rates, J. Atmos. Terr. Phys., 36, 1249–1257, 1974.
Torr, M. R. and Torr, D. G.: The seasonal behavior of the F2 layer of the ionosphere, J. Atmos. Terr. Phys., 35, 22–37, 1973.
Tsai, H.-F., Liu, J.-Y., Tsai, W.-H., and Liu, C.-H., Tseng, C.-L., and Wu, C.-C.: Seasonal variations of the ionospheric TEC in Asian equatorial anomaly regions, J. Geophys. Res., 106, 363–369, 2001.
Wanninger, L.: Effects of the equatorial ionosphere on GPS, GPS World, 2, 48–54, 1993.
Wu, C. C., Liou, K., Shan, S. J., and Tseng, C. L.: Variation of ionospheric total electron content in Taiwan region of the equatorial anomaly from 1994–2003, Adv. Space Res., 41, 611–616, 2008.