the Creative Commons Attribution 4.0 License.
the Creative Commons Attribution 4.0 License.
 | 04 Jul 2019
Assessing the role of planetary and gravity waves in the vertical structure of ozone over midlatitudinal Europe
Peter Križan
Planetary and gravity waves play an important role in the dynamics of the atmosphere. They are present in the atmospheric distribution of temperature, wind, and ozone content. These waves are detectable also in the vertical profile of ozone and they cause its undulation. One of the structures occurring in the vertical ozone profile is laminae, which are narrow layers of enhanced or depleted ozone concentrations in the vertical ozone profile. They are connected with the total amount of ozone in the atmosphere and with the activity of the planetary and gravity waves. The aim of this paper is to quantify these processes in midlatitudinal Europe. We compare the occurrence of laminae induced by planetary waves (PL) with the occurrence of these induced by gravity waves (GL). We show that the PL are 10–20 times more frequent than that of GL. There is a strong annual variation of PL, while GL exhibit only a very weak variation. With the increasing lamina size the share of GL decreases and the share of PL increases. The vertical profile of lamina occurrence is different for PL and GL smaller than 2 mPa. For laminae greater than 2 mPa this difference is smaller.


There are various structures in the vertical profile of ozone affected by the activity of the planetary and gravity waves. Some of them are narrow layers of the enhanced or depleted ozone concentration in the ozone vertical profile, which are called ozone laminae. The first investigation of these structures was made by Dobson (1973), who found that they occur predominantly in the cold half of the year. The existence of laminae was confirmed by lidar and satellite measurements (Bird et al., 1997; Orsolini et al., 1997; Kar et al., 2002). They were found also in water vapour in the stratosphere (Teitelbaum et al., 2000). The dynamics of the stratosphere plays a crucial role in lamina formation. This finding was confirmed by the ability of dynamical models to capture these narrow layers (Manney et al., 2000; Orsolini et al., 2001). The number of large laminae is strongly correlated with the total ozone content and it is the reason why we have been interested in laminae (Krizan and Lastovicka, 2005).
The laminae are not only the indicator of the atmospheric ozone content, but they are also connected with the gravity and planetary wave activity. Teitelbaum et al. (1995) developed a identification procedure which enables us to detect the planetary and gravity wave activity in the ozone vertical profile. In this paper we apply this method to ozone laminae and each lamina we sort to the one of the following groups: laminae induced by gravity wave activity (GL) or by planetary wave activity (PL), and laminae which are induced neither by the gravity waves nor by the planetary waves. A similar method was used by Grant et al. (1998) and Pierce and Grant (1998), but only for the Wallops Island station. The aim of this paper is to find the characteristics of GL and PL in midlatitudinal Europe in the period 1970–2016. At first we test whether the Teitelbaum method is suitable for such research. Next the annual variation of GL and PL is examined. Then we explore the dependence of lamina composition on their size. We also compare the vertical distribution of GL and PL. We deal with their trends. The content of this paper is as follows: Sect. 2 describes the methods and data, Sect. 3 gives results, in Sect. 4 the results are discussed, and the last section is conclusions.
Now we shortly describe the lamina-searching procedure. Each positive lamina consists of the three main points: the lower minimum, the main maximum, and the upper minimum. The depth of lamina must be between 500 and 3500 m due to the vertical resolution of the ozonosondes (lower limit) and due to the fact that the ozone lamina is a narrow layer of the enhanced ozone concentration (upper limit). The size of the laminae is given as a difference between the ozone concentration in the main maximum and the average concentration from both minima. More about the lamina-searching procedure can be found in Križan and Laštovička (2004) and Laštovička and Križan (2005).
The method used in this paper for searching the activity of gravity and planetary waves in the ozone profile is a modification of the methods given by Teitelbaum et al. (1995). Figure 1a shows the real ozone profile at Hohenpeissenberg on 2 February 1970. We use the linear interpolation with the step 50 m for approximating the ozone profile with the high vertical resolution. Then the 50-point moving average (2500 m in the vertical) is applied to this real profile to obtain the smooth profile. This smooth profile is also displayed in Fig. 1a. The same procedure is applied to the potential temperature and the results are given in Fig. 1b. In the next step we compute the differences between the high-resolution profile and the smooth profile for the ozone partial pressure (Fig. 2a) and the potential temperature (Fig. 2b). The differences are much higher for the ozone profile than for the potential temperature profile. The differences in the vertical gradients of the ozone partial pressure and the potential temperature must be taken into account. So we must apply the following correction factor to the potential temperature perturbations:
where O3avg(θavg) is the average ozone partial pressure (potential temperature) in the layer with the width dz. The vertical distribution of this correction is given in Fig. 3a. The correction is the highest in the lower stratosphere, where the vertical gradient of ozone is strong. Above 20 km we observe the negative values of this factor, which is predominantly given by the negative gradient of the ozone partial pressure and the strong positive gradient of the potential temperature. When we multiply the potential temperature perturbations by this correction, we obtain the perturbations, which are shown in Fig. 3b. These new perturbations are not similar to those given in Fig. 2b.
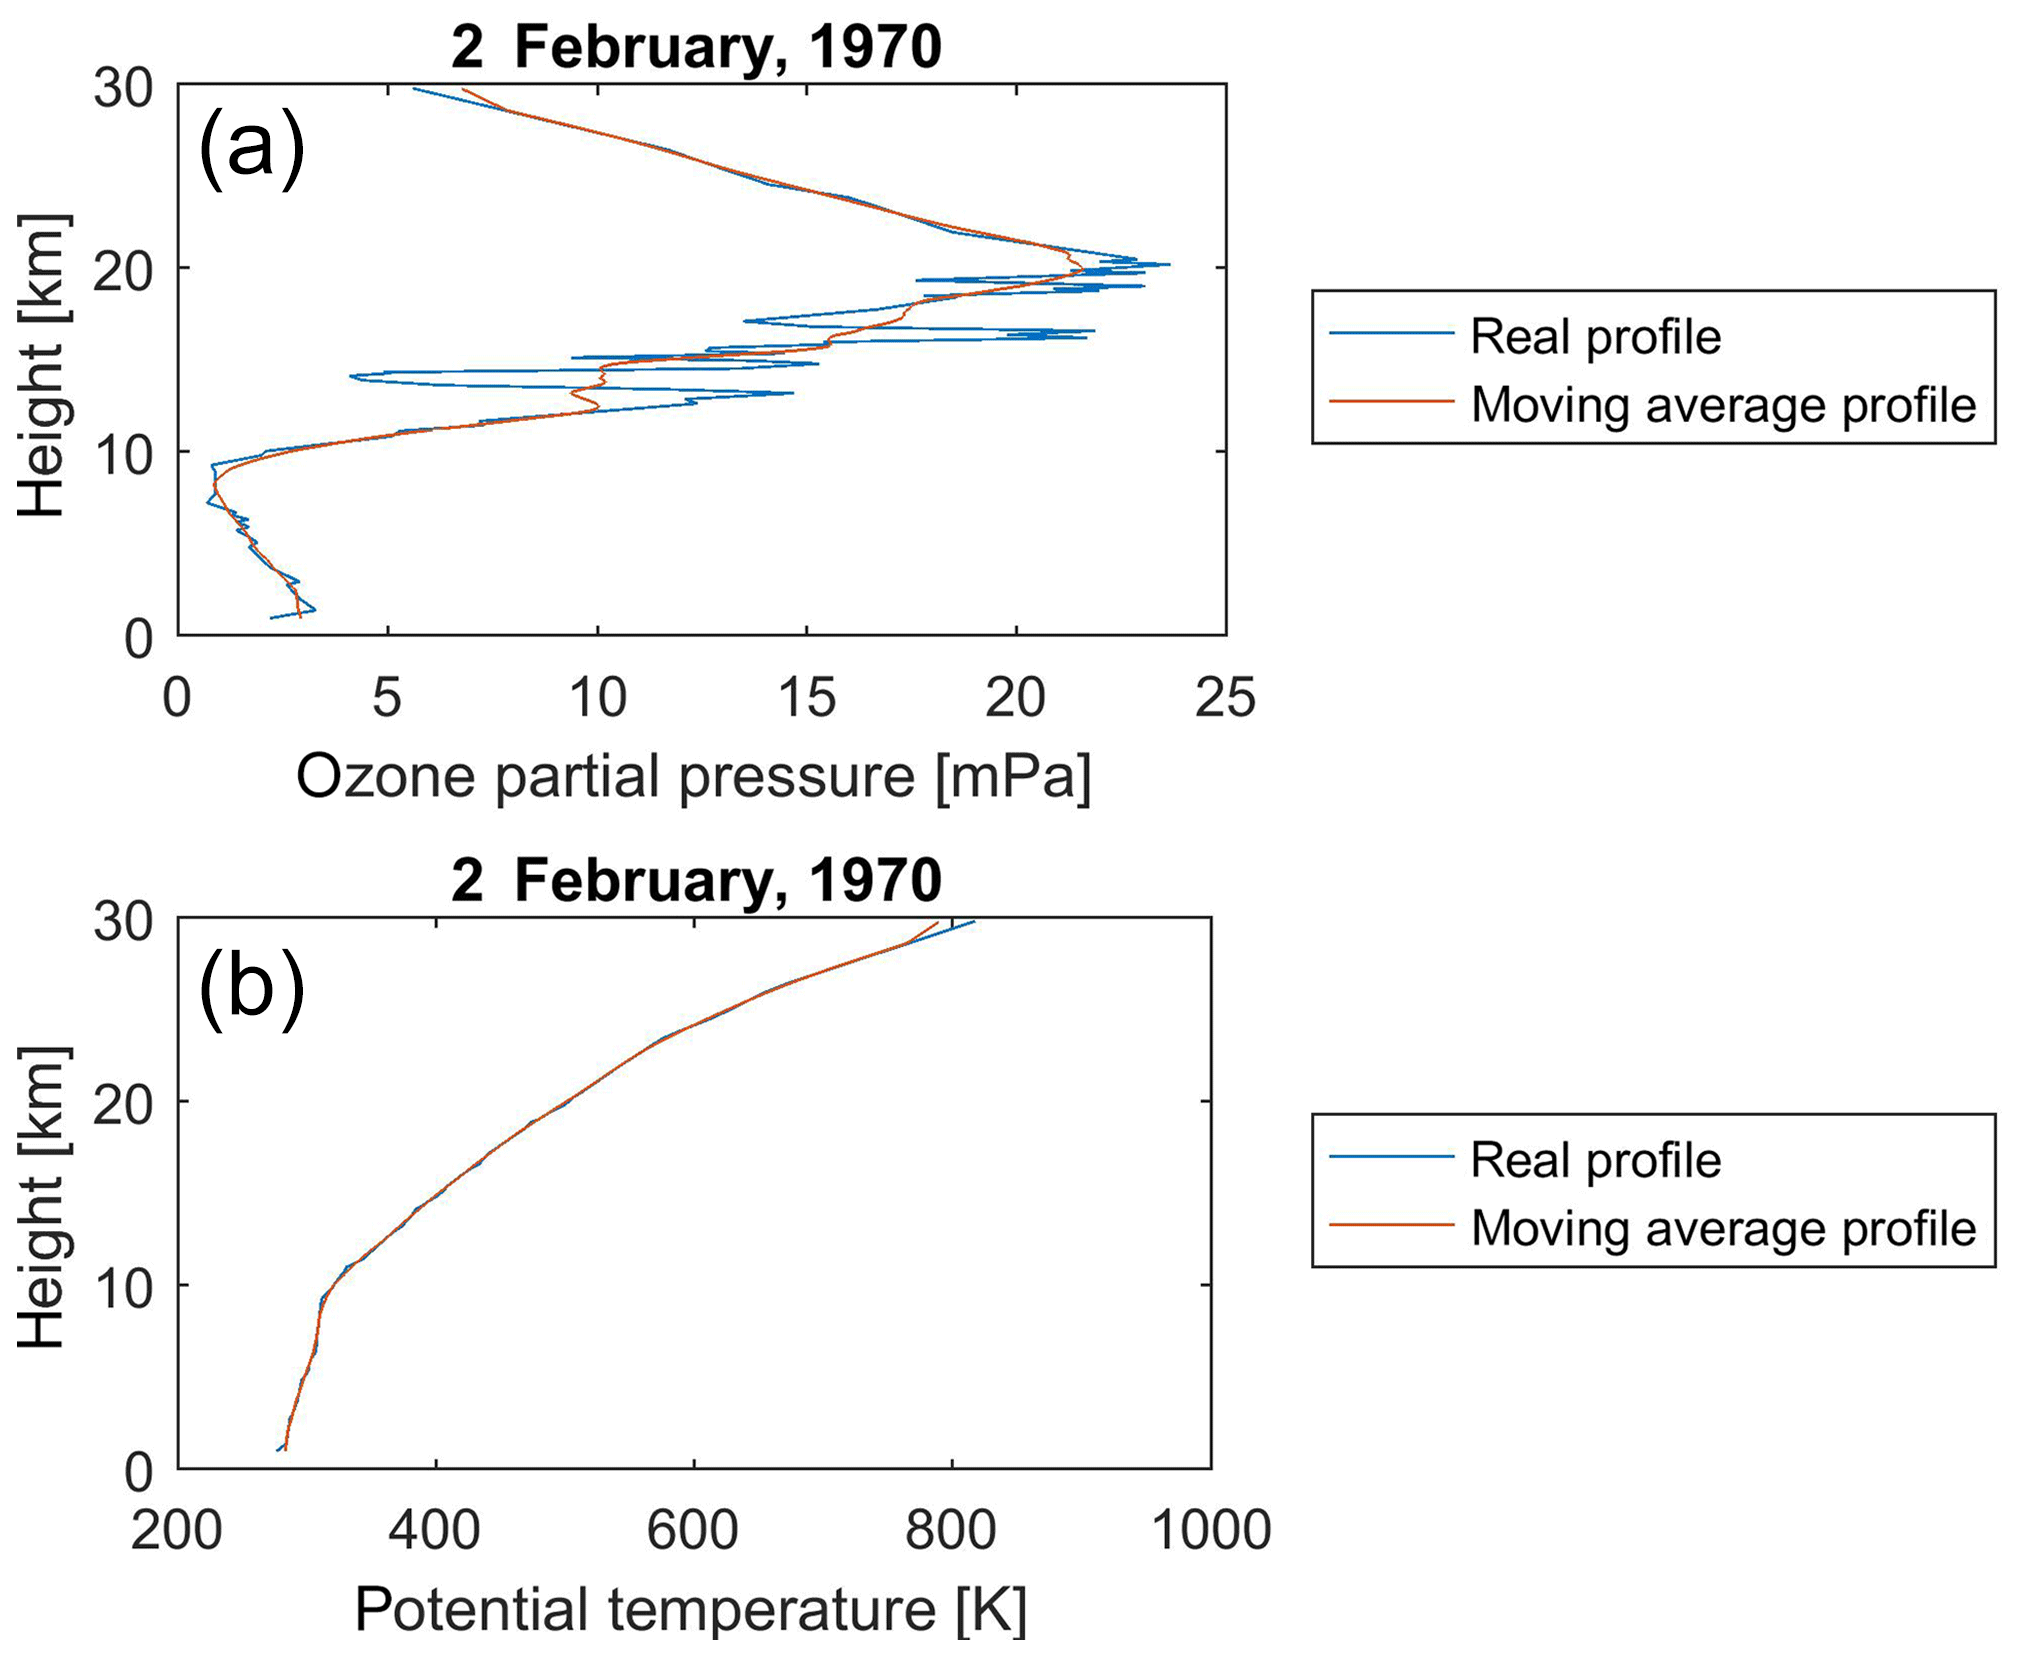
Figure 1Real and smooth ozone (a) and potential temperature (b) vertical profile at Hohenpeissenberg from 2 February 1970.
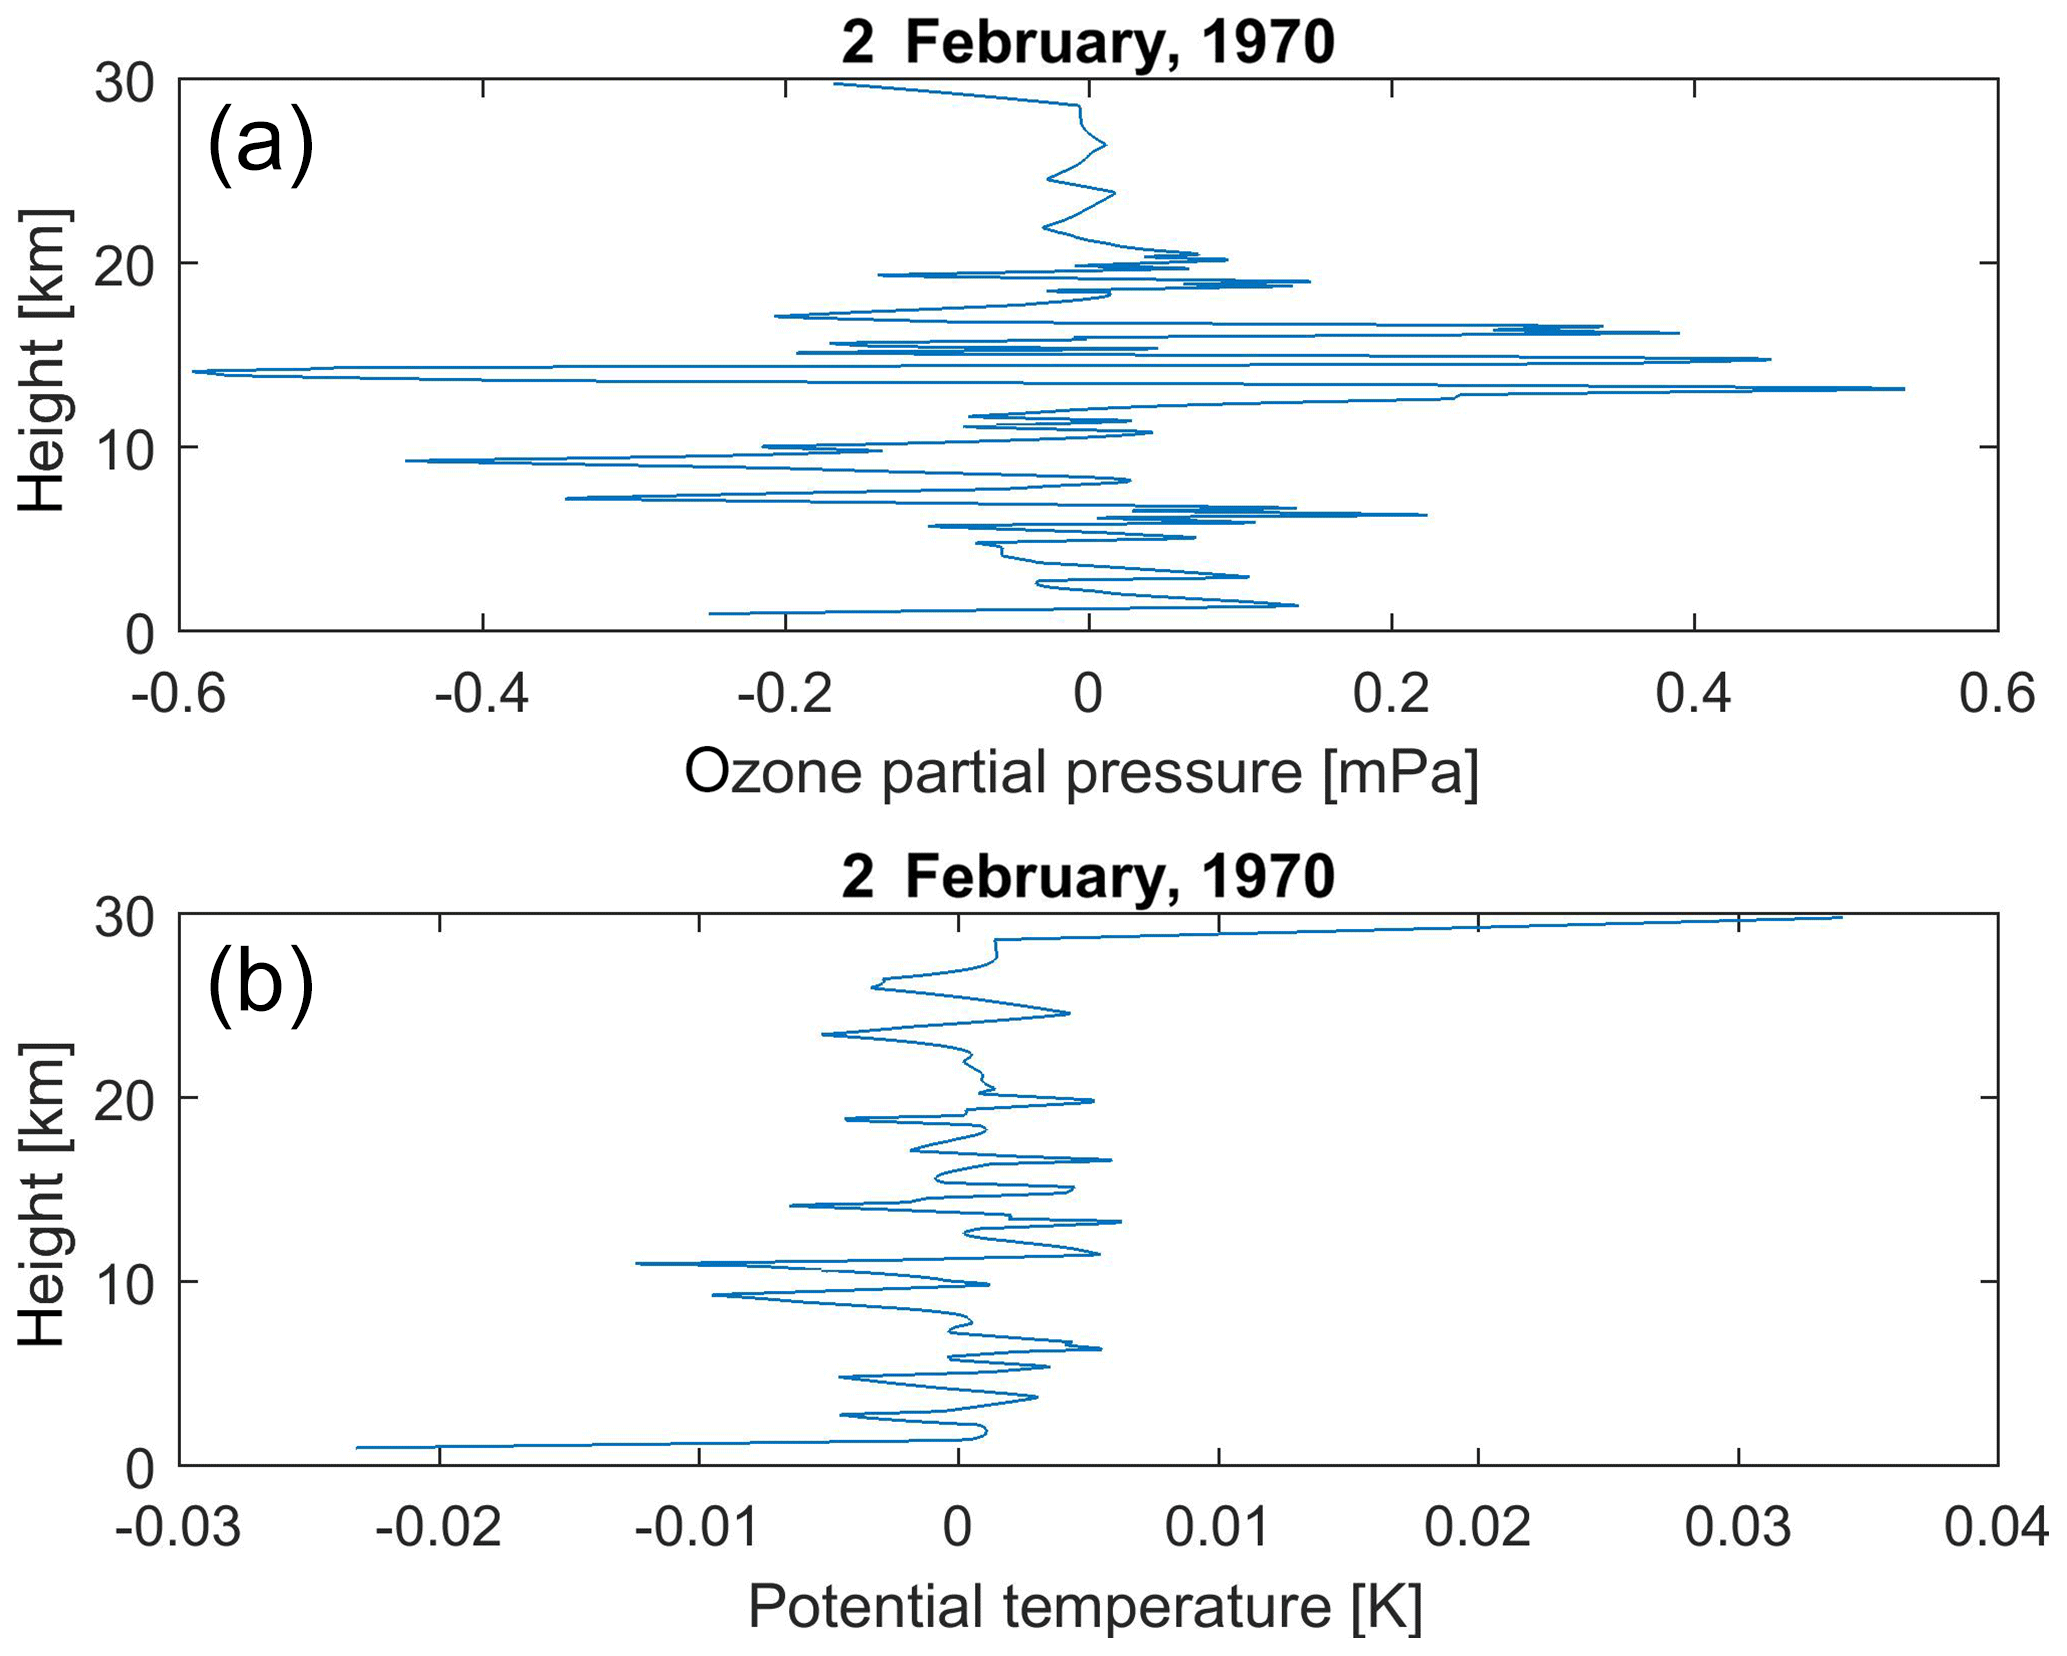
Figure 2Differences between real and smooth vertical profiles from 2 February 1970 for ozone (a) and potential temperature (b).
At each point of the high-resolution ozone profile we compute the correlation coefficient between the ozone perturbations and the scaled potential temperature perturbation up to 5 km above this point. The vertical dependence of this correlation coefficient from the ground to the point which is situated 5 km below the highest ozone profile point is seen in Fig. 4. If the correlation coefficient is greater than 0.7, the vertical ozone profile in this point is influenced by the gravity waves. In Fig. 4 the correlations are higher than 0.7 at some altitudes above 5 km and below 15 km. If the lamina maximum is situated in this high-correlation area, we conclude this lamina is induced by the gravity waves. On the other hand, if these correlations are low (between −0.3 and 0.3), we consider the ozone profile to be influenced by the planetary waves in this point (from 17 to 22 km in Fig. 4), and again, if there is a lamina maximum there, we consider this lamina to be the one induced by the planetary waves. When the correlation coefficient is above 0.3 and below 0.7 or below −0.3 we are not able to evaluate which type of laminae is present and call them indistinguishable laminae. The boundary values of correlation coefficients were taken from Teitelbaum et al. (1995).
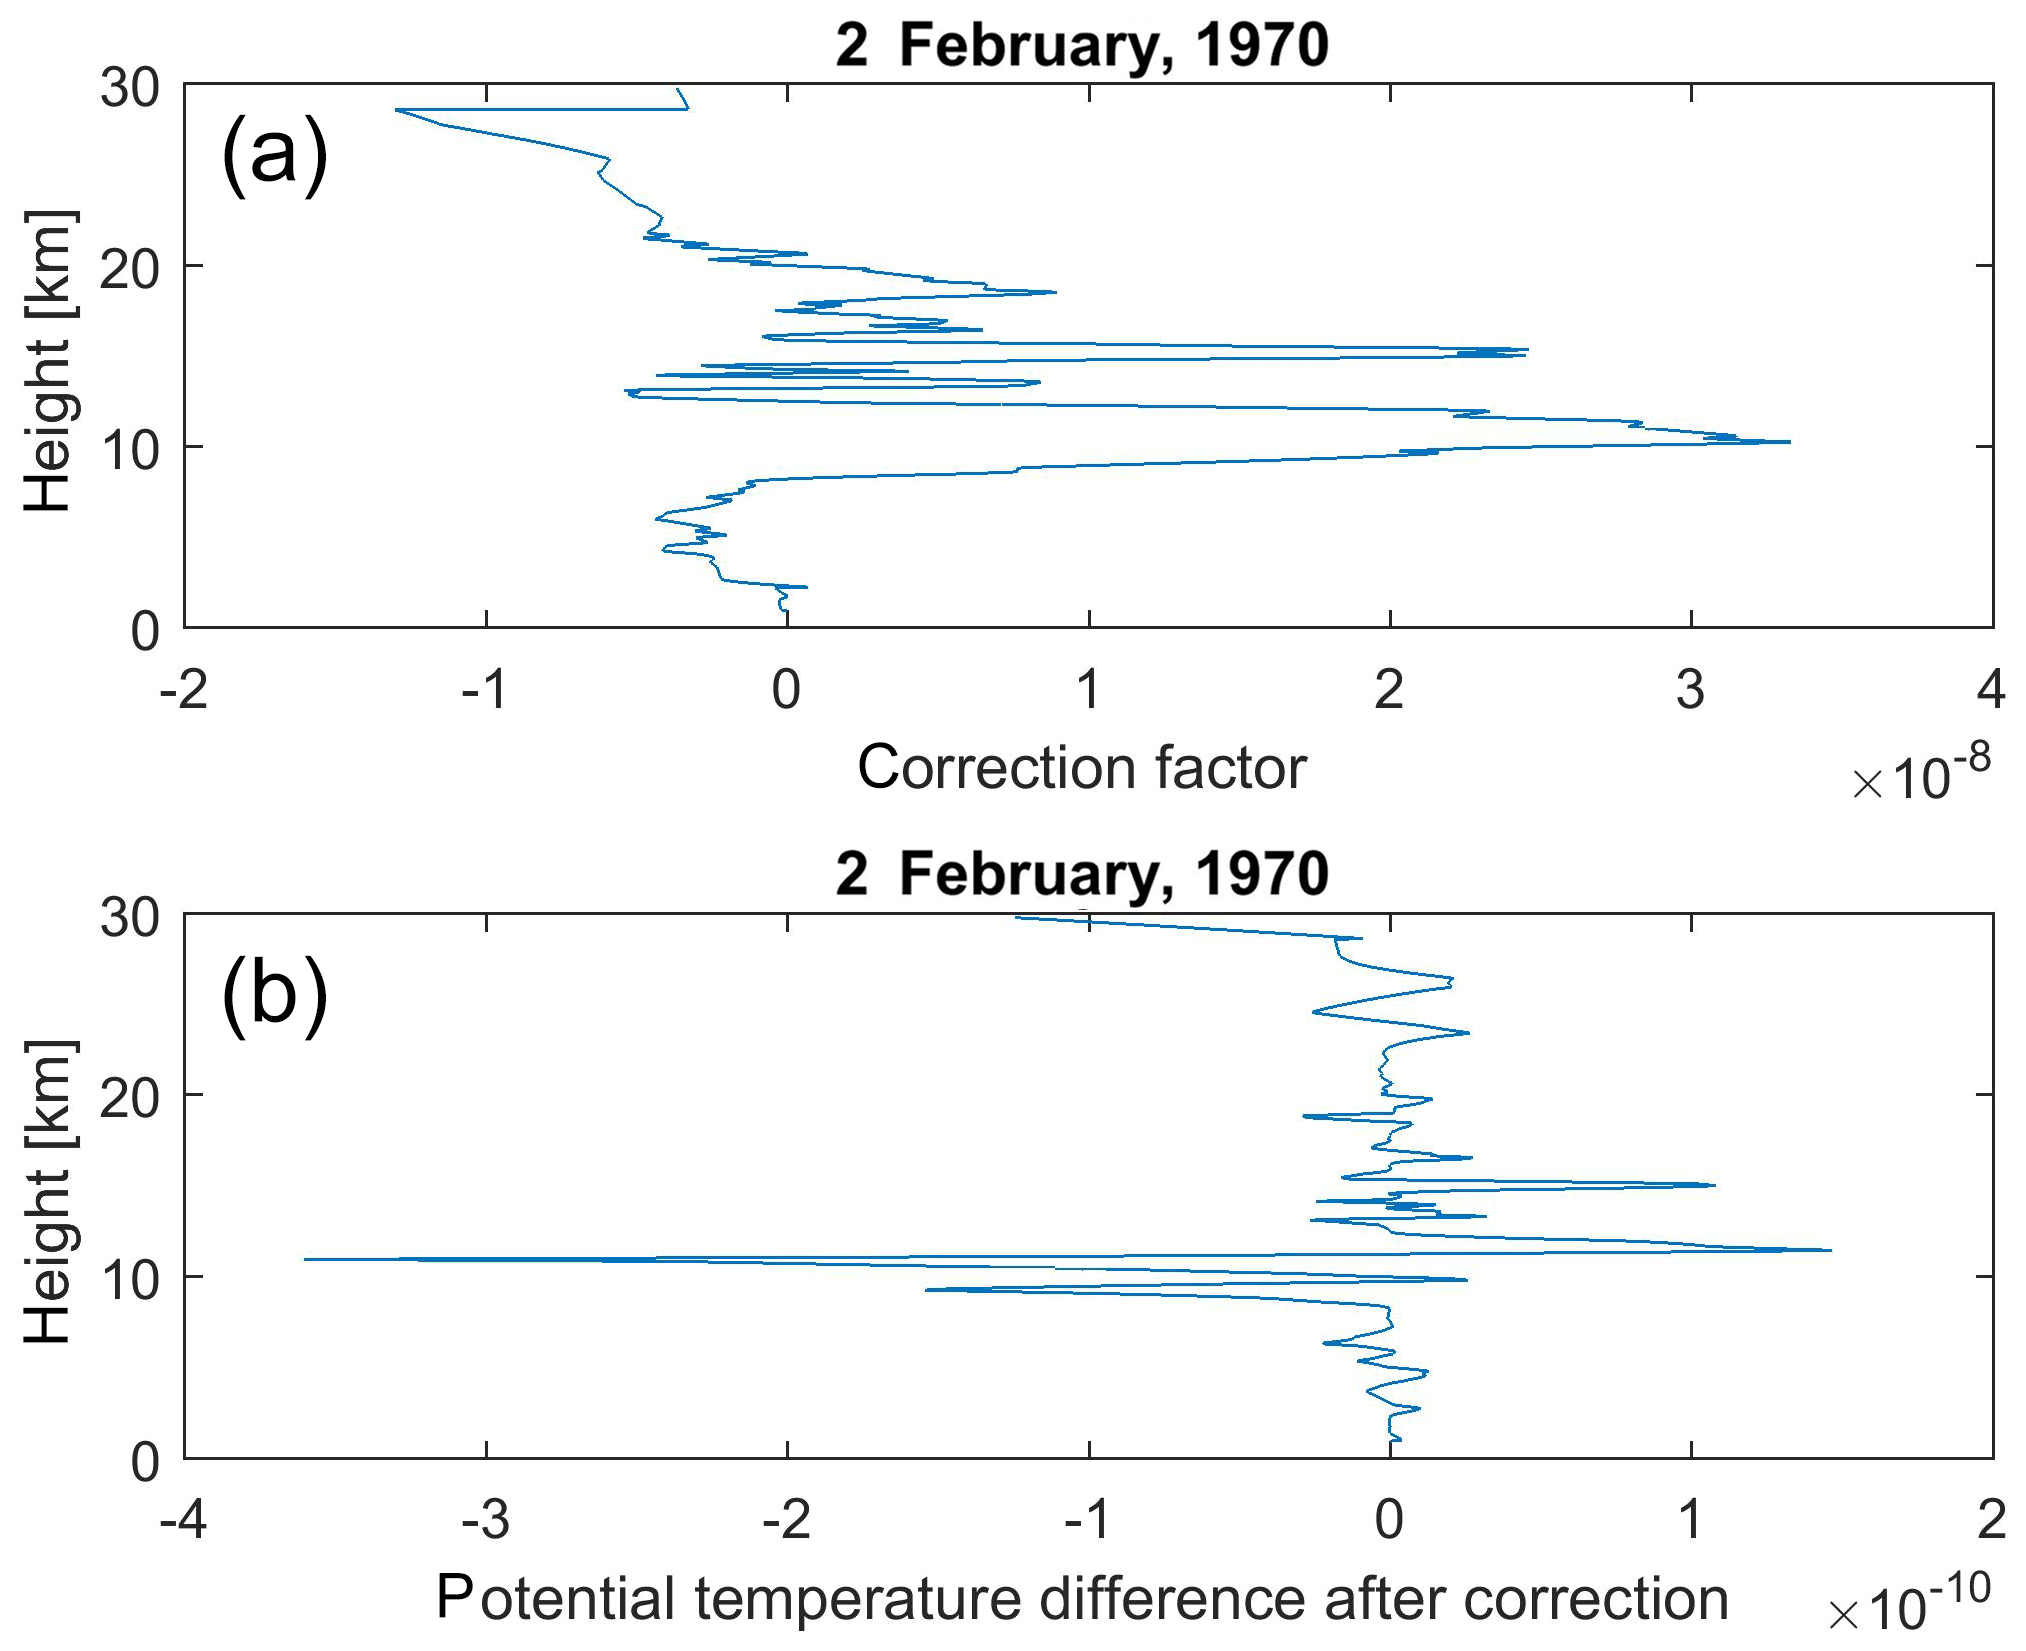
Figure 3Vertical profile of the potential temperature correction factor (a) and vertical profile of differences between real and smooth potential temperature profiles (b) after correction.
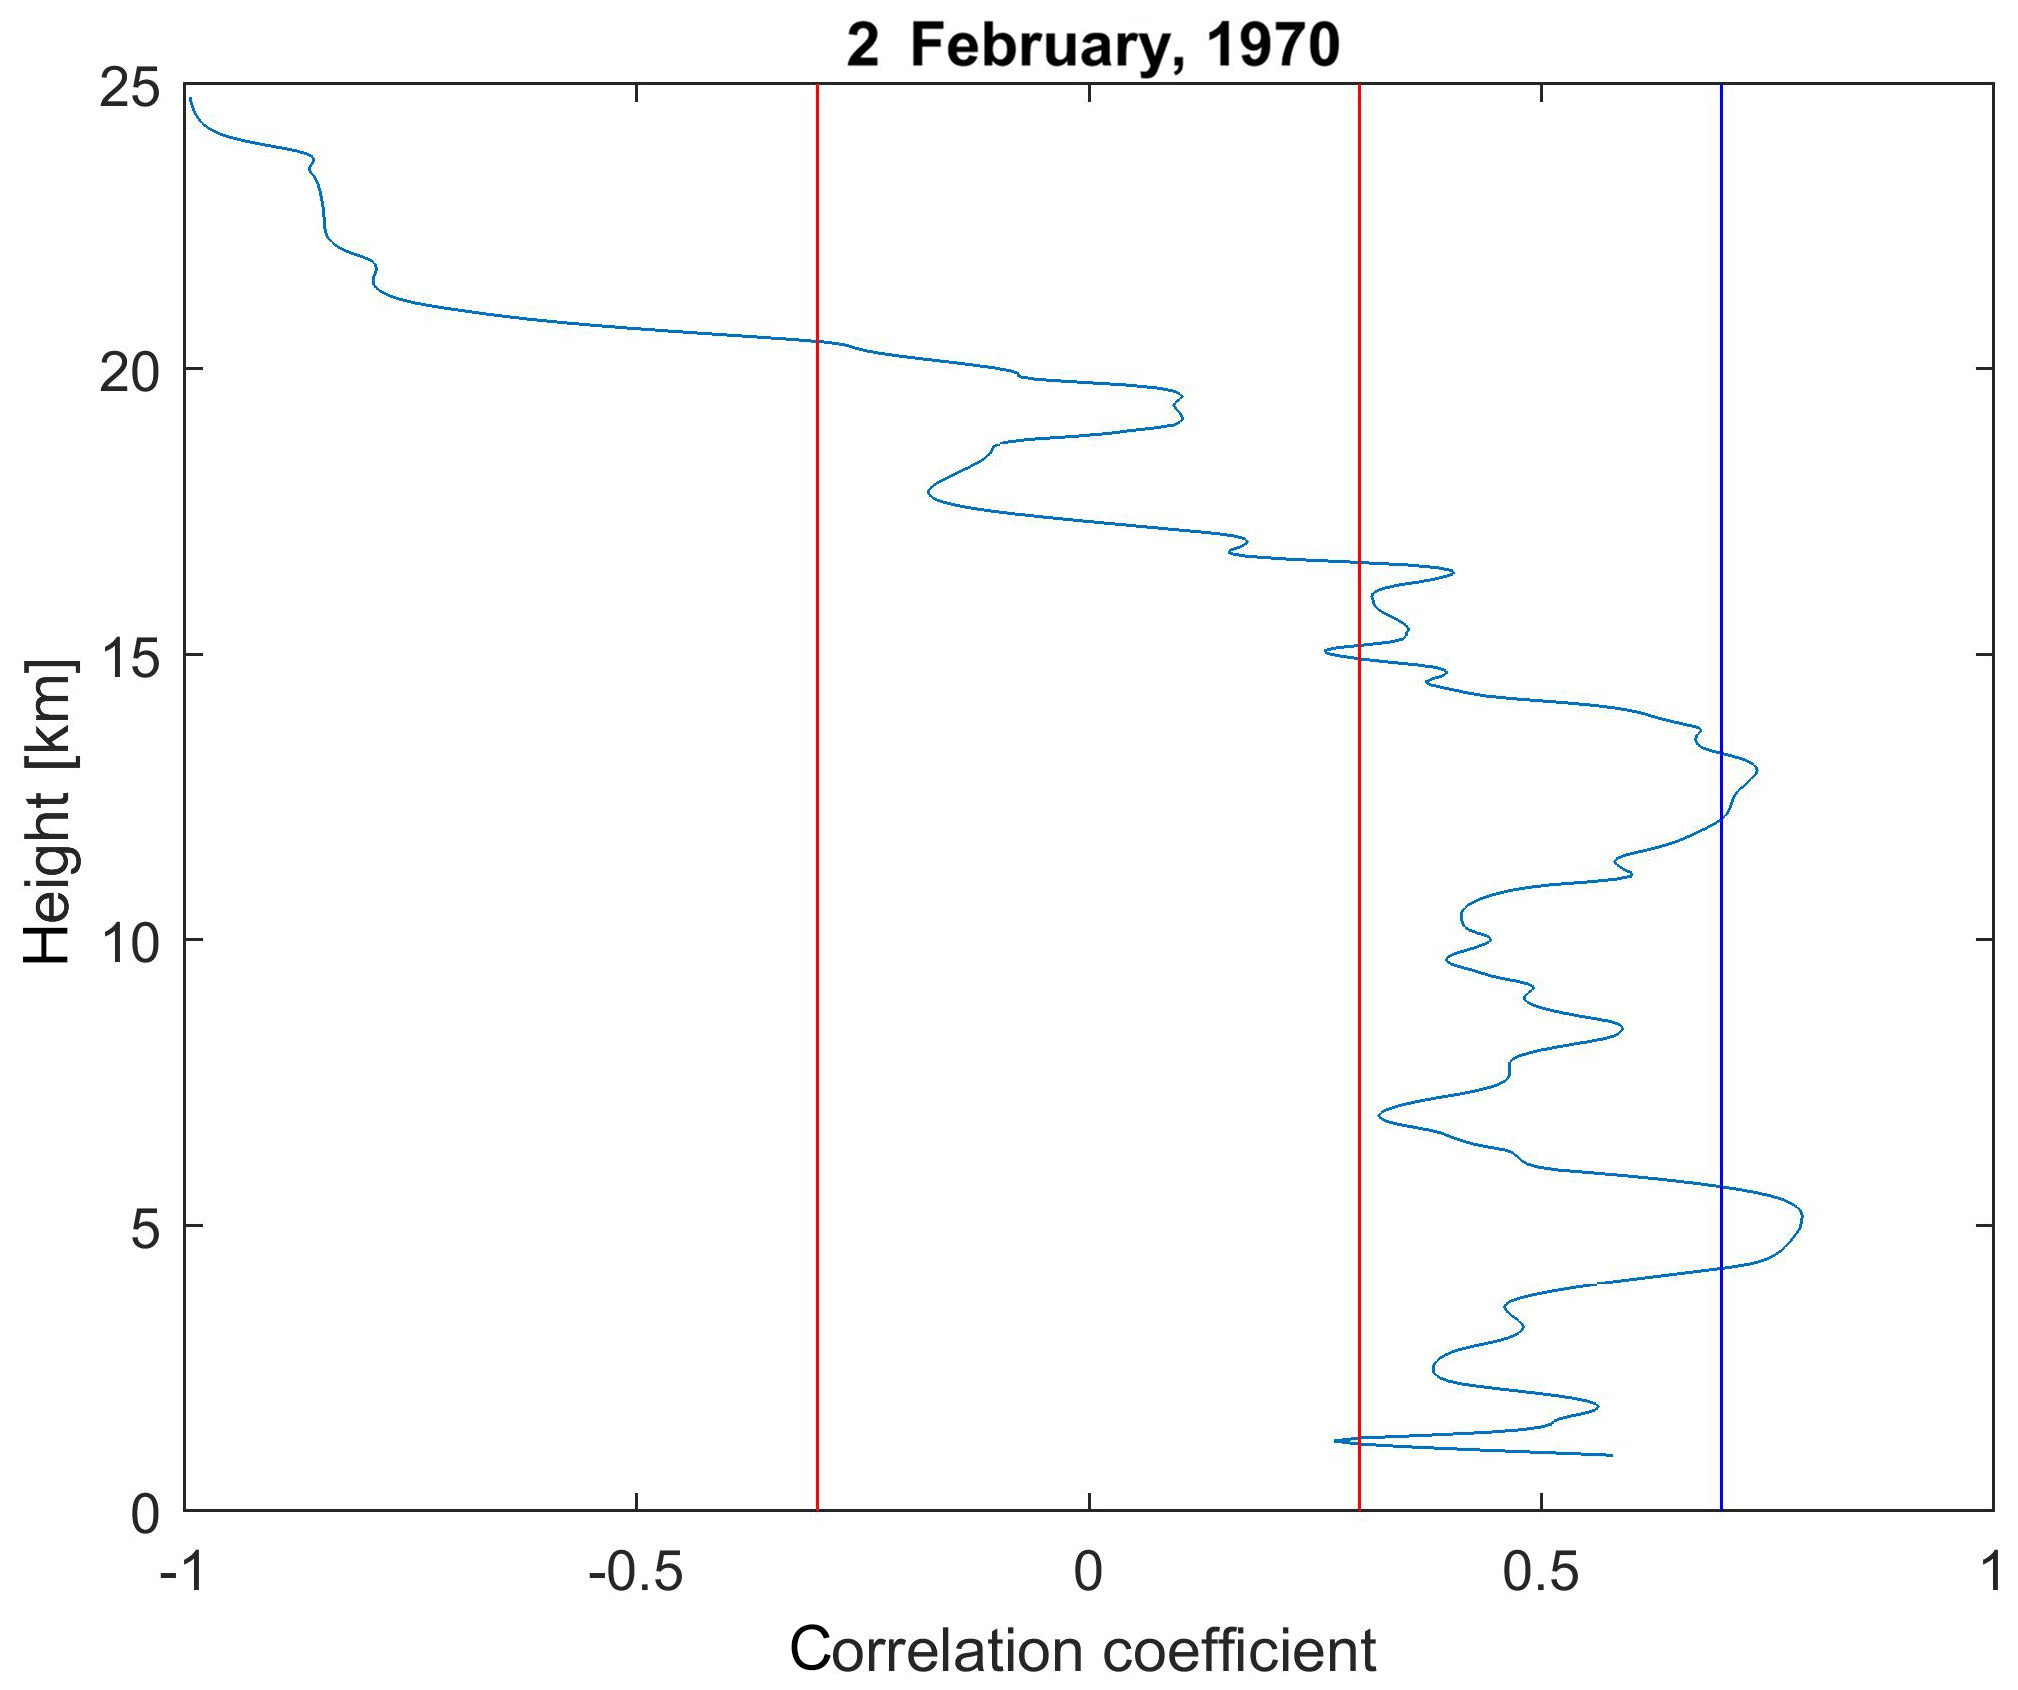
Figure 4The vertical profile of correlations between the corrected potential temperature differences and the ozone differences from 2 February 1970 at Hohenpeissenberg. The red vertical lines are the borders for the laminae induced by the planetary waves and the blue vertical line is the border for gravity wave ones.
We are going to apply this procedure to the following European midlatitude stations: Hohenpeissenberg (Germany, 1970–2016, 5166 files), Payerne (Switzerland, 1970–2016, 5998 files), Uccle (Belgium, 1970–2015, 6221 files), Lindenberg (Germany, 1975–2013, 2380 files), and Legionowo (Poland, 1979–2016, 1728 files). These data were taken from WOUDC Toronto (http://woudc.org/archive/Archive-NewFormat/, last access: 4 April 2019). During the research some problems with a vertical resolution of the ozone profile occurred, and so at the end we exclude the data from station Lindenberg. The Hohenpeissenberg data were used only for large laminae.
3.1 Performance of method
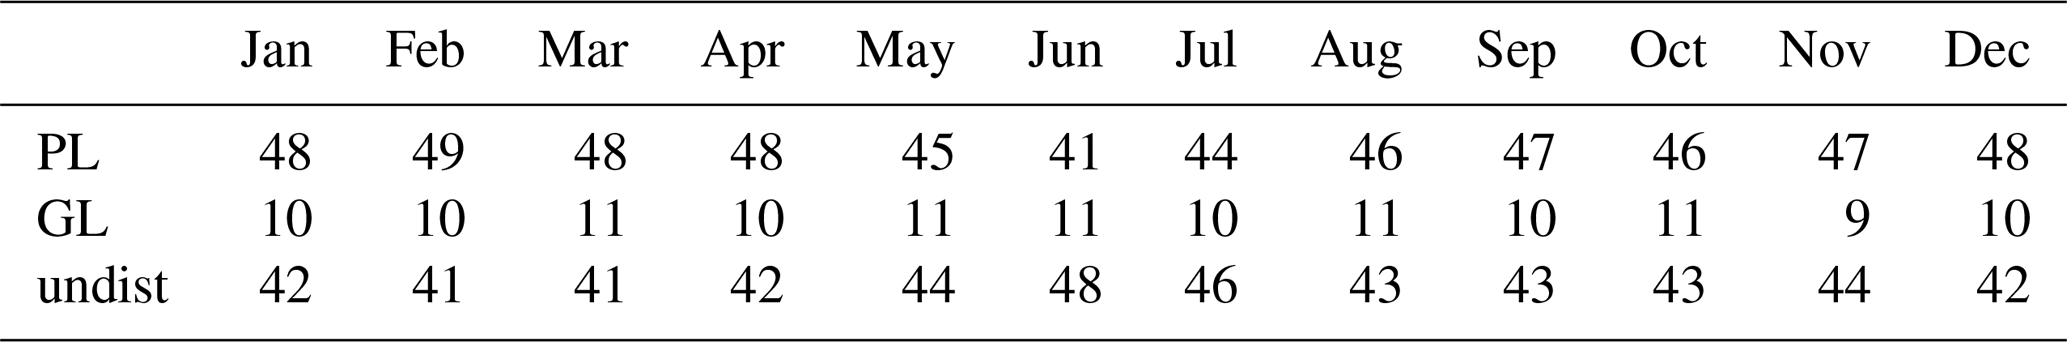
At first we must answer the question whether the procedure used in the paper is successful in partitioning of laminae to the groups. If the procedure is suitable, the number of the indistinguishable laminae cannot be very high. The performance of this procedure is given in Table 1 for Hohenpeissenberg for each month and for all laminae regardless of the size. The results at the other stations are very similar. From this table we see that approximately 47 % of all laminae are PL, while GL laminae formed about 10 % and the share of indistinguishable laminae is about 43 %. This means that more than 50 % of all laminae can be divided into the laminae induced by the gravity or the planetary wave activity. So we can conclude that this procedure is successful in lamina partitioning, because nobody can expect that only GL and PL will be present and with no indistinguishable laminae. Practically there is no yearly course in the lamina composition.
Table 1Monthly composition of laminae (%) at Hohenpeissenberg in the period 1970–2016 (undistinguishable laminae).
3.2 Vertical resolution and number of laminae
At first we must look at the homogeneity of the sonde vertical resolution used in this paper. The results are given in Fig. 1. We see the resolution is not homogenous and the resolution increases (vertical distance decreases) in the period 1970–2016. And thus we must ask the question whether this resolution change has an effect on a number of laminae detected in the profile. We have computed the correlation coefficient between the yearly values of lamina number and vertical resolution. If these correlations are significant, the resolution influences the lamina number. We did the correlations for the following groups of laminae: small (< 1 mPa), medium (1–4 mPa), and large (> 4 mPa). The results are shown in Table 2. The number of small laminae is strongly correlated with vertical resolution. It means the numbers of small laminae are affected by the resolution. With increasing sizes of laminae, these correlations decrease. For large laminae the results are station dependent. These results are a bit surprising because one expects negative correlations of lamina number with resolution, and these negative correlations were observed only for small laminae. For the explanation of these results we must look at the average lamina depth in small, medium, and large laminae (Table 2), which was obtained for the best vertical resolution (below 100 m). We can see the increase in lamina depth with increasing size. When the depth of laminae is small (small laminae), the vertical resolution strongly influences the lamina number, because with decreasing resolution the number of detected laminae decreases. On the other hand, the average depth of large laminae is above the worst vertical resolution (800 m, Fig. 5), and so the increasing resolution does not influence significantly the number of detected laminae.
Table 2Correlation coefficient of lamina number and average vertical resolution at the European middle-latitude stations from the period 1970–2016 (before slash – PL; after slash – GL). Significant correlation coefficient values are in bold.
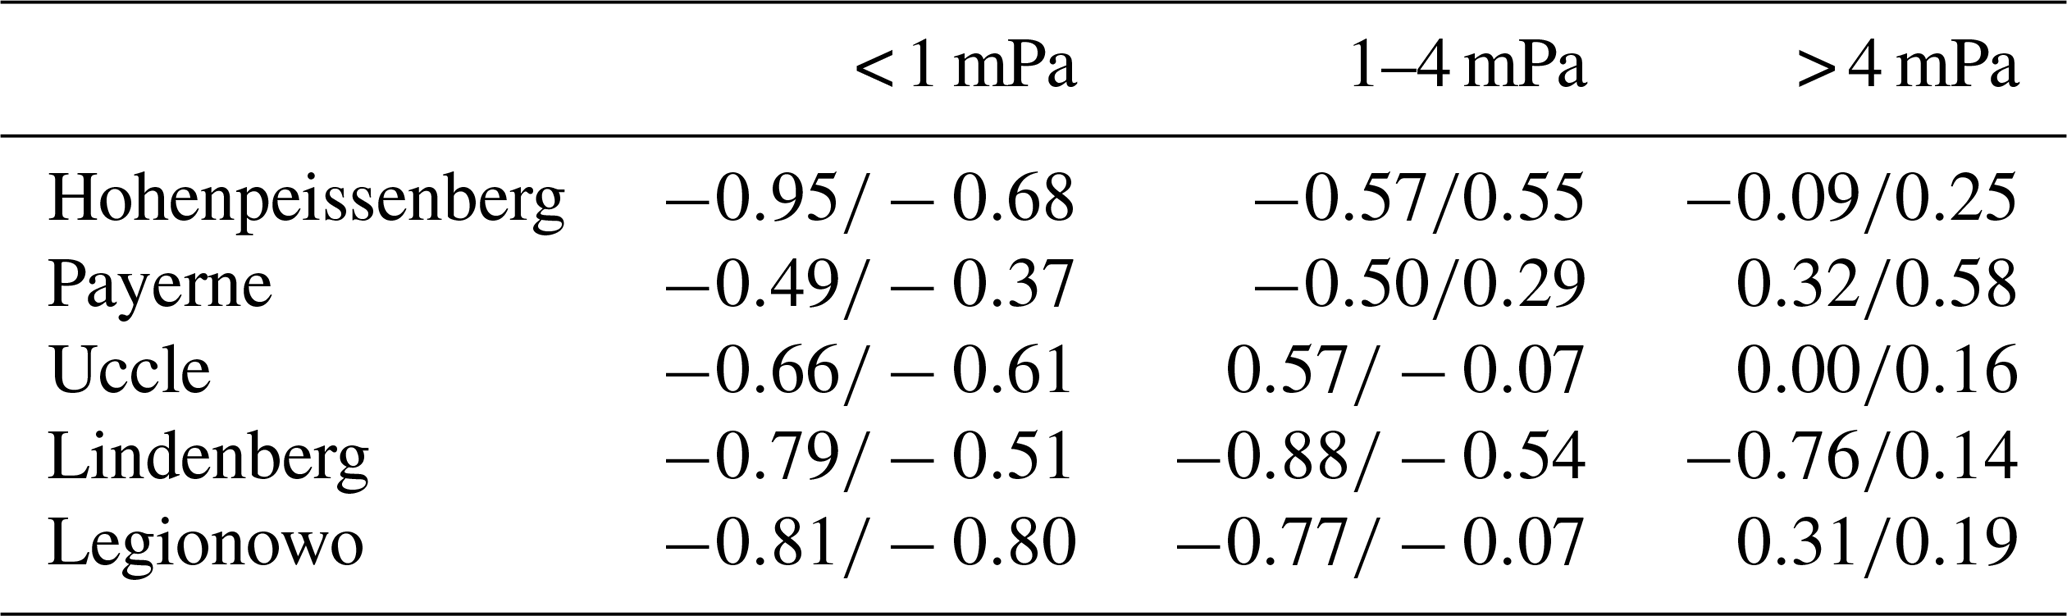

Figure 5Long-term evolution of the average vertical resolution of profiles at the European ozonosonde stations.
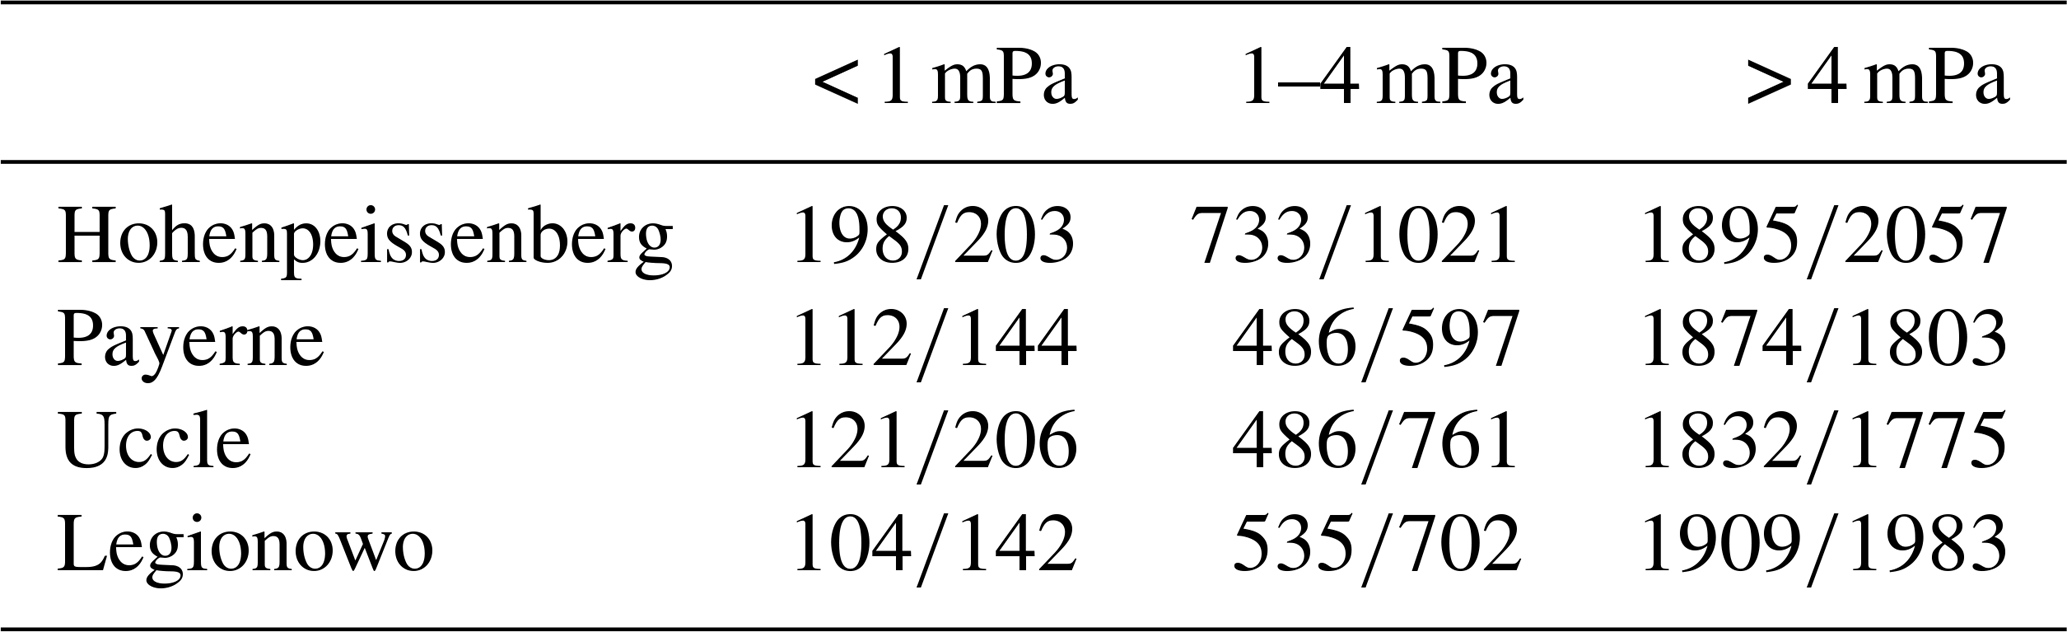
The vertical resolution of sonde measurements must be comparable to or smaller than the average depth of laminae, and thus one can see (Table 3) that the maximal vertical resolution in the case of small laminae must be 100 m and for medium laminae 500 m. The depth of large laminae is above the worst vertical resolution, so the large lamina results are not resolution dependent. Originally we also considered station Lindenberg, but it had to be excluded due to large and variable vertical resolution. Station Hohenpeissenberg is suitable only for several years after 2010. Only stations Payerne and Uccle have suitable vertical resolution in the period 1990–2016 and station Legionowo in the period 1995–2016. Because we must compromise between the quality and amount of data, we take into account only these three stations in the period 1995–2016 for the small and medium laminae and the Hoheinpeissenberg data for the large ones.
Table 3Average lamina depth (m) in the selected lamina size intervals at the European middle-latitude stations for the vertical resolution below 100 m (before slash – advective laminae; after slash – gravity wave laminae).
3.3 Annual variation of laminae induced by the gravity and the planetary wave activity
Figure 6 shows the annual variation of the number of laminae larger than 2 mPa for GL and PL at all stations used in this paper. The annual variation with a maximum in winter/spring and a summer/autumn minimum is clearly seen for PL, but this pattern is very weak in the case of GL. Monthly values of the ratio of the number of PL and GL at the European midlatitudinal stations are given in Table 4 for laminae greater than 2 mPa. We see this ratio is month dependent. On average its value is from 10 to 20, but in January at Legionowo its value is nearly 100. We think it is an outlier. The number of PL is much higher than that of GL. This different behaviour of the annual variation is the evidence that both types of laminae are formed by different processes.
Table 4Monthly values of the ratio of the number of PL and GL at the European midlatitudinal stations for laminae greater than 2 mPa.
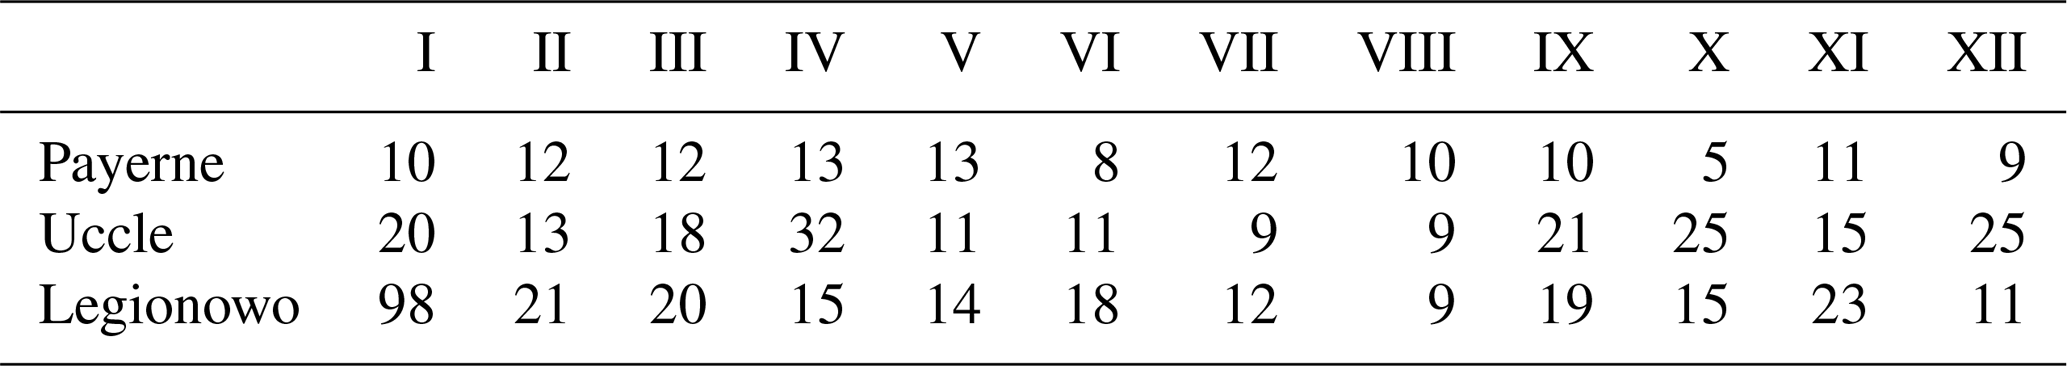
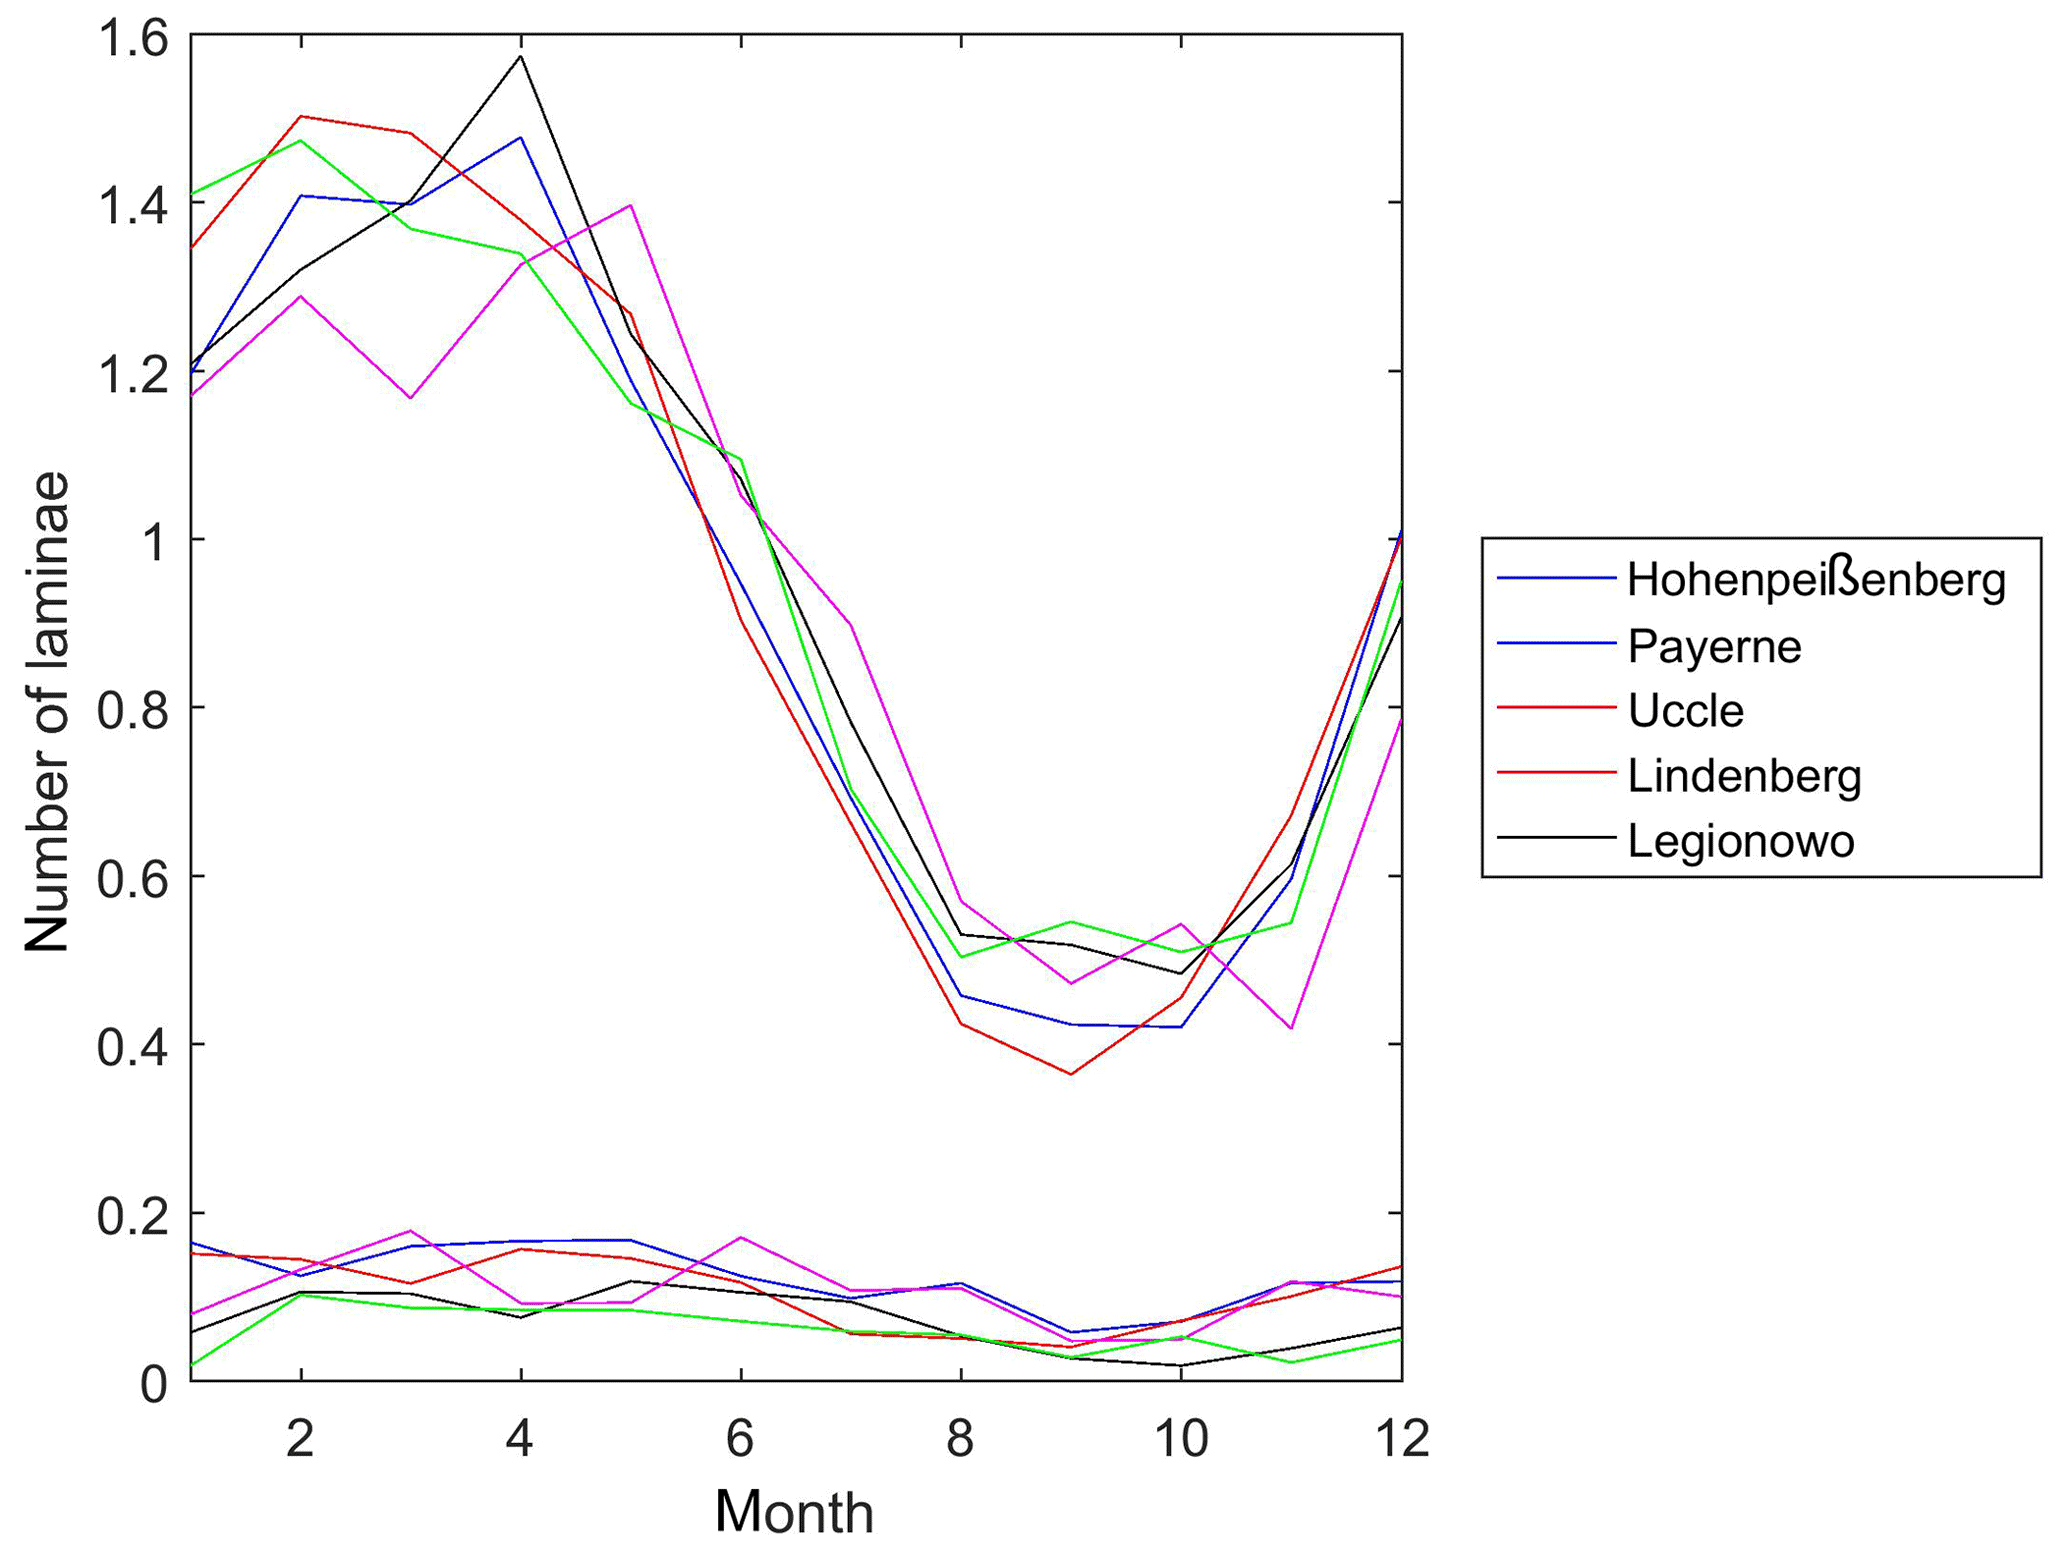
Figure 6The annual variation of the lamina number per ozone profile for PL (group of lines with the strong variation) and for GL (group of lines with the weak variation) at the European ozonosonde stations.
3.4 Dependence of lamina type on the size of laminae
In this section we deal with the lamina type occurrence frequency in the selected classes of lamina size. The laminae were sorted to the following groups: small (< 1 mPa), medium size (1–4 mPa), and large (> 4 mPa), and in each group we found the occurrence frequency of different types of laminae. The results are presented in Fig. 7. The results are almost identical for all stations. The share of GL is decreasing with the increasing size and the opposite is true for PL. The performance of the used procedure increases with the increasing lamina size (the share of indistinguishable laminae decreases). The gravity waves are able to produce predominantly small laminae, while the planetary waves also produce the large ones. Similar results were also obtained by Teitelbaum et al. (1995).
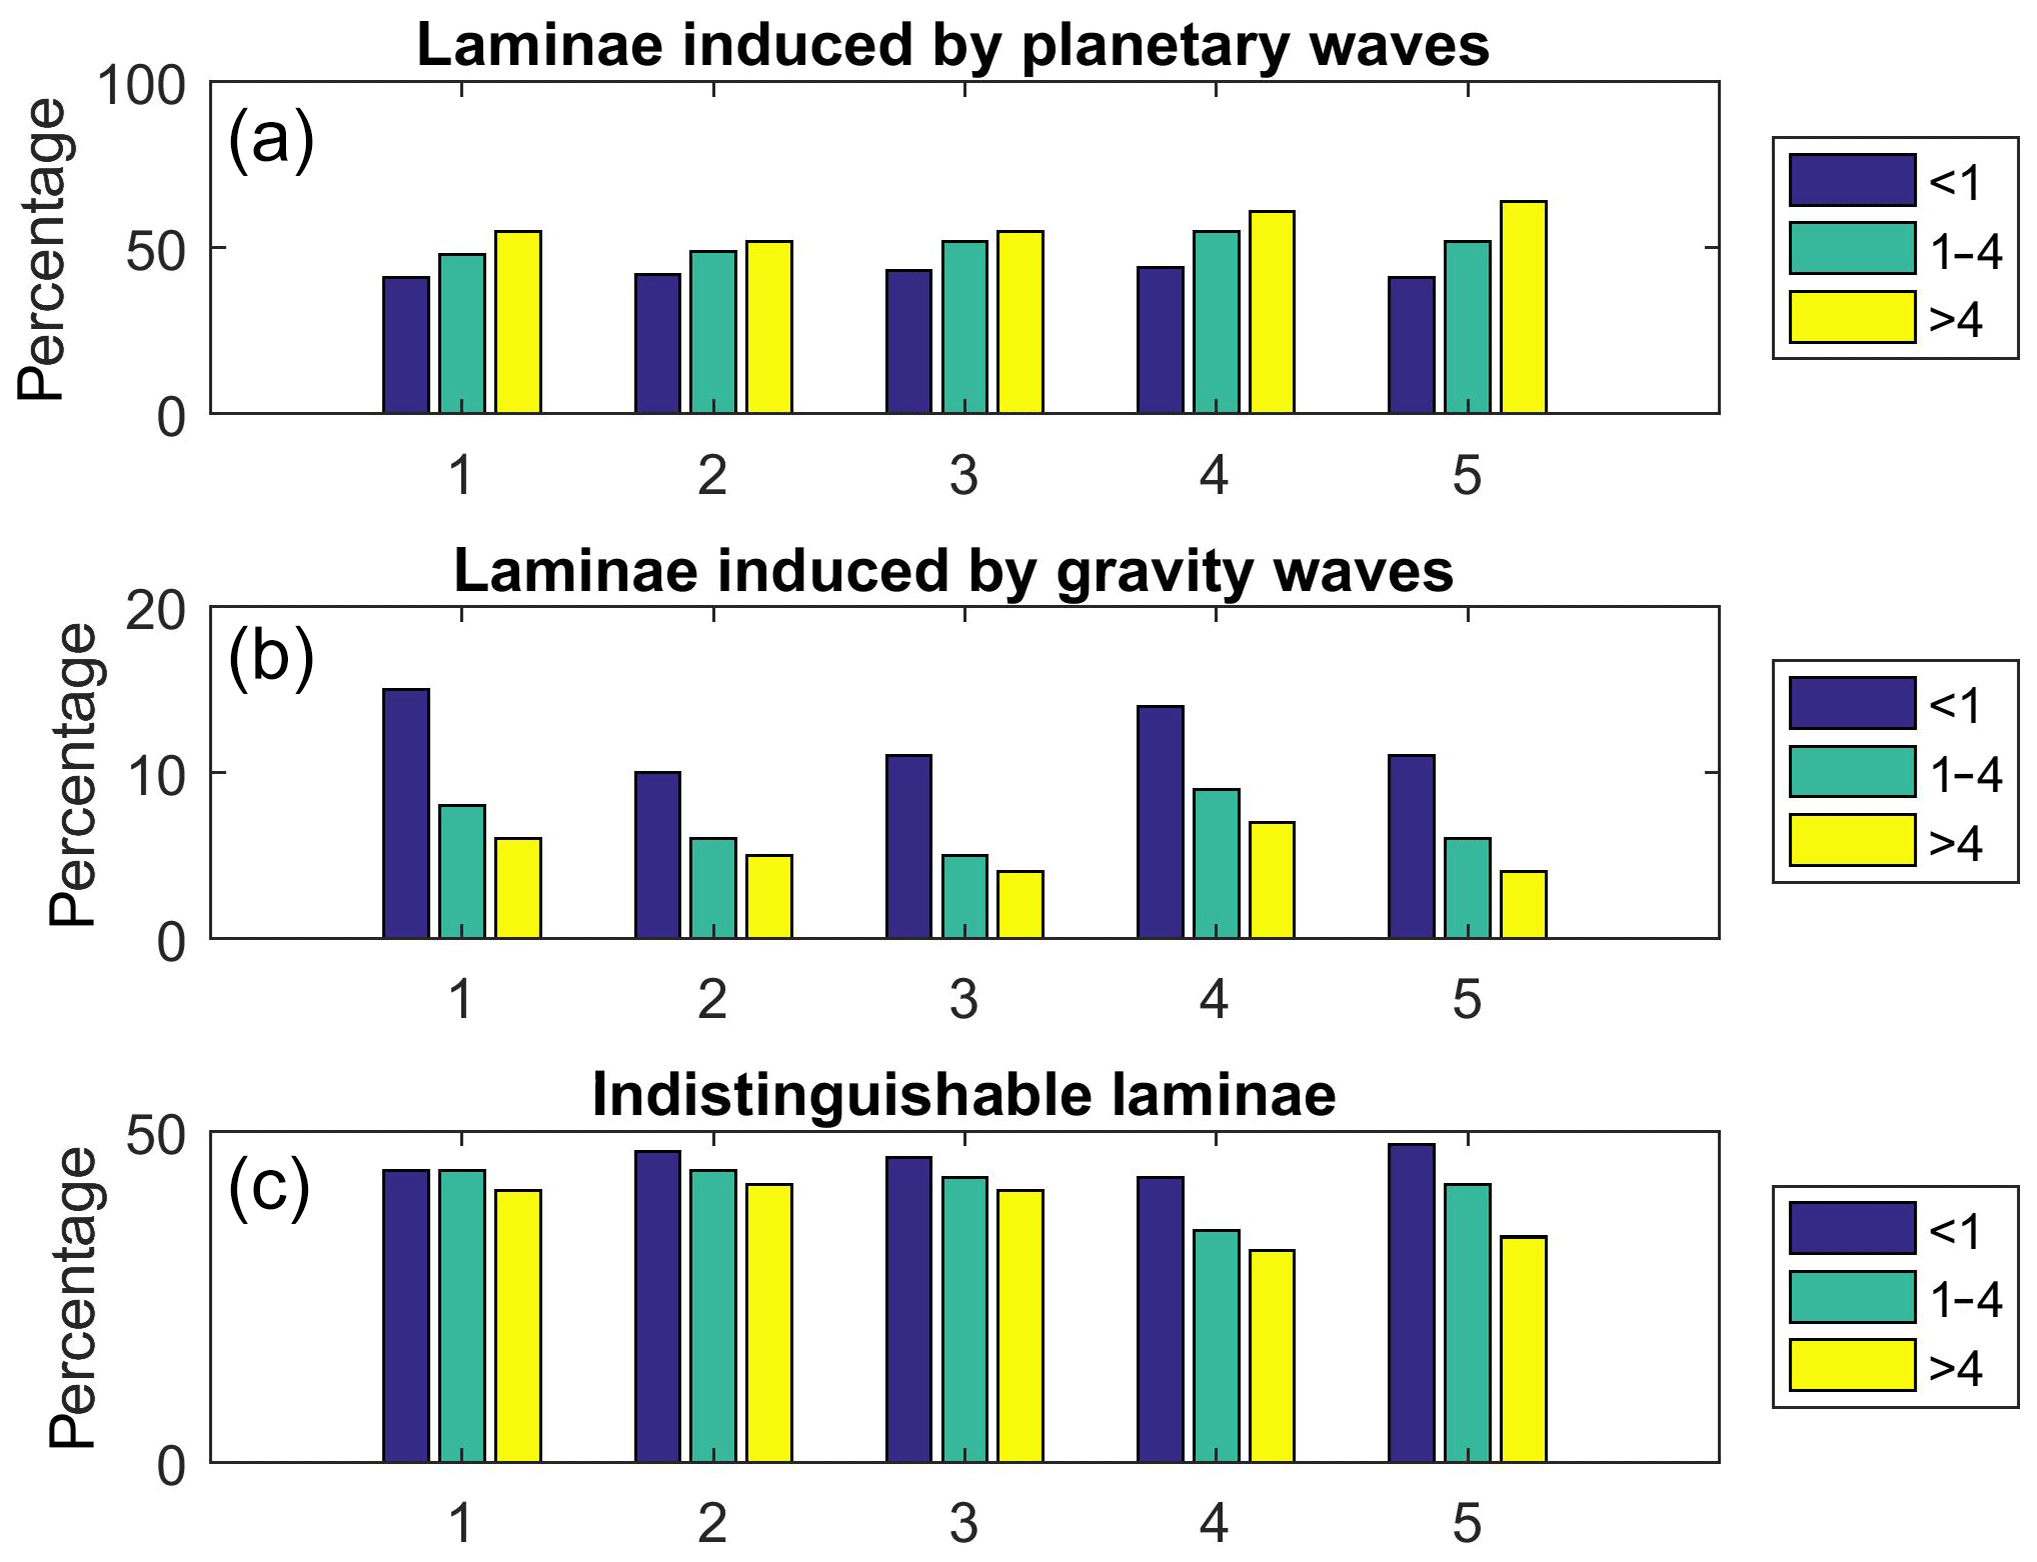
Figure 7The dependence of the lamina composition on a lamina size for PL (a), GL (b), and indistinguishable laminae (c) at the European stations (1 – Payerne, 2 – Uccle, 3 – Legionowo).
3.5 Vertical dependence of the occurrence of advection and gravity wave laminae
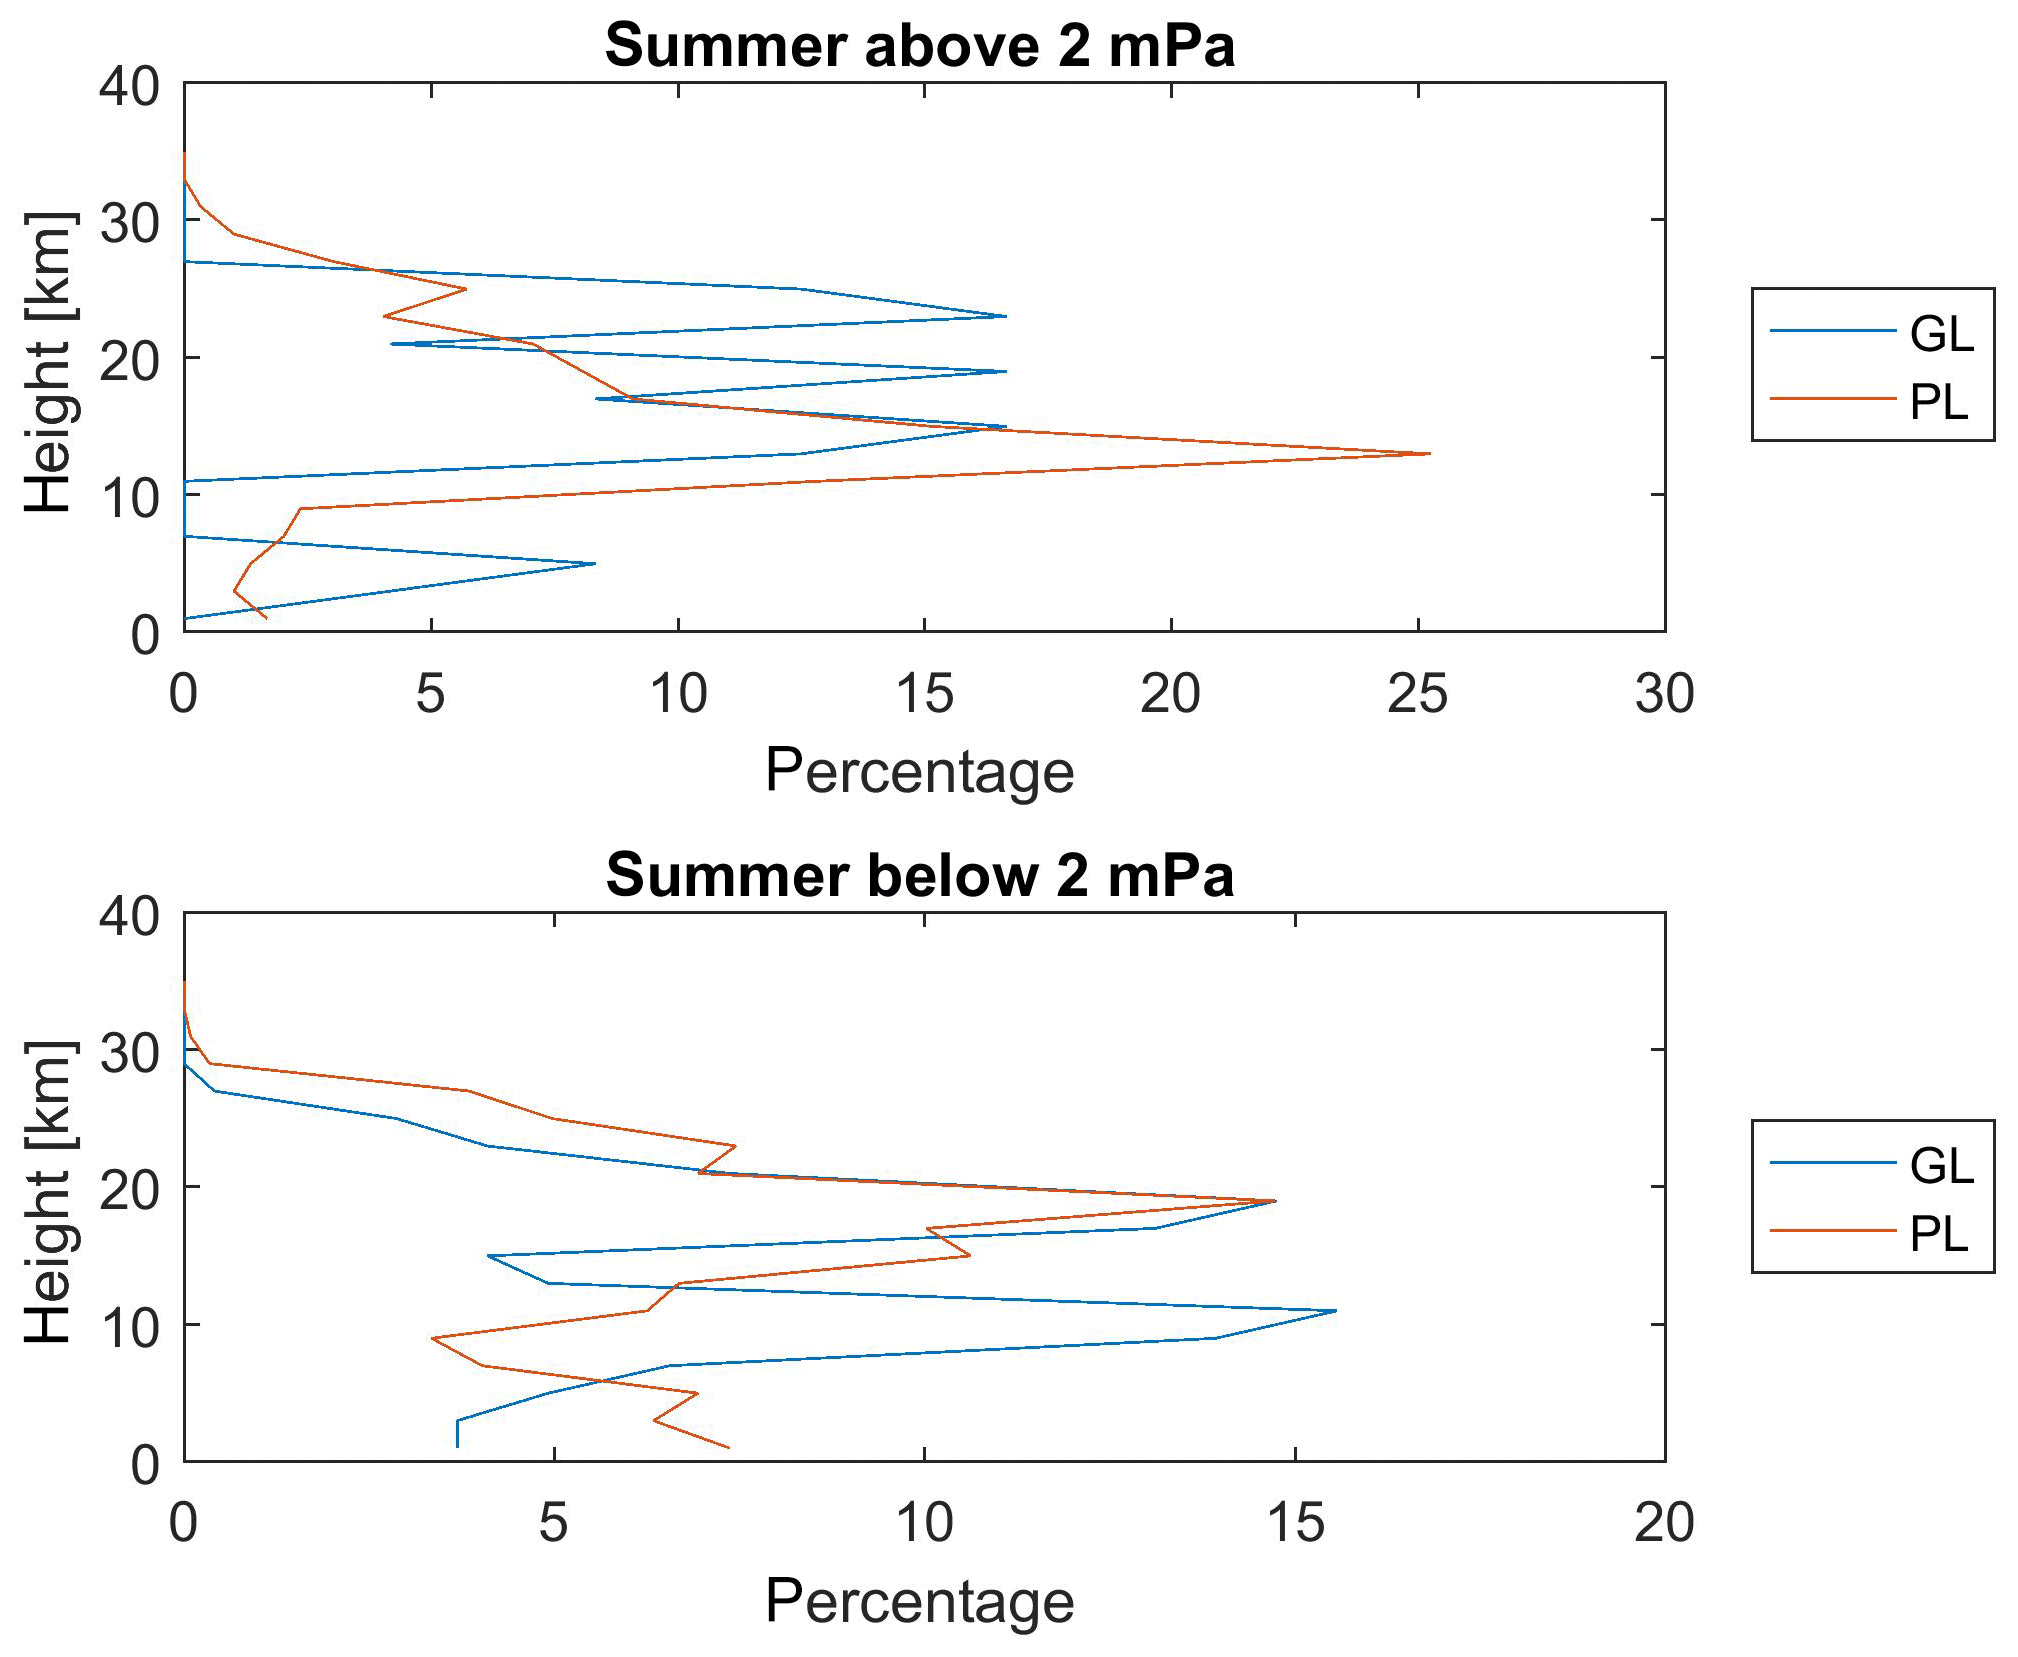
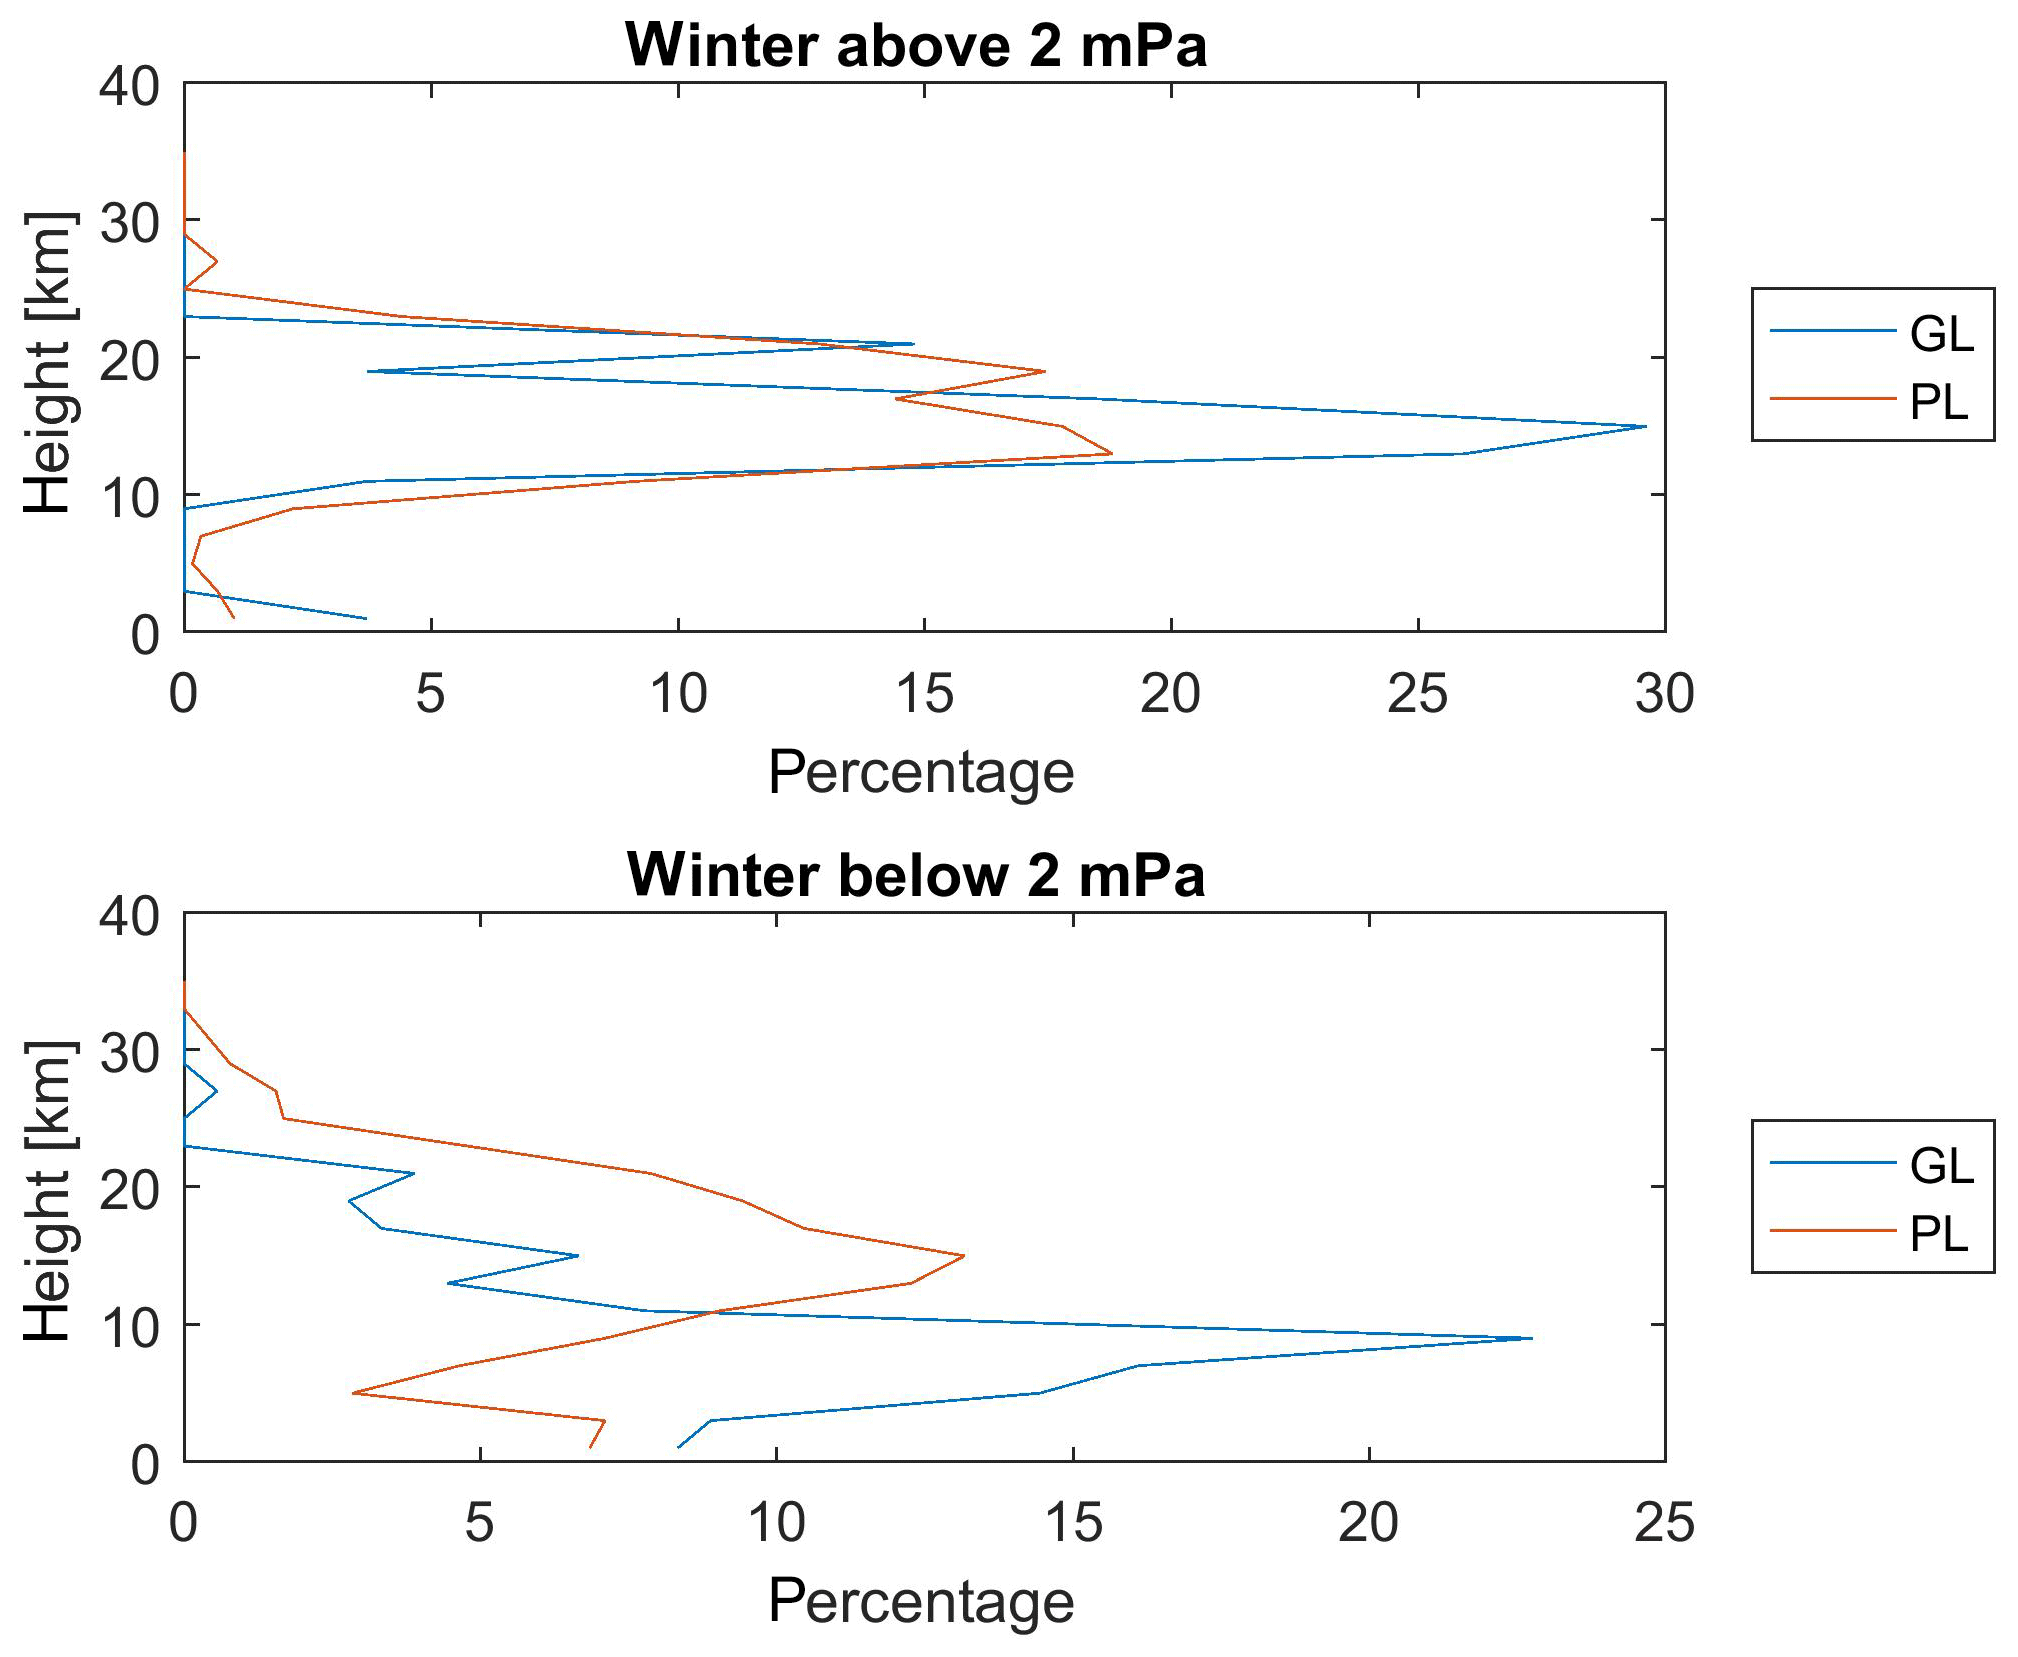
Now we examine the altitudinal dependence of occurrence of GL and PL at the stations used in this paper for all seasons. March, April, and May form spring, June, July, and August are summer months, September, October, and November are the autumn ones, and December, January, and February are winter. We divided the ozone vertical profile into 2 km wide intervals and in each interval we search for the lamina occurrence. The results are displayed as the percentage of all laminae which occur in the individual altitude interval. We grouped laminae into two groups, small (< 2 mPa) and large (> 2 mPa), and in each group we are searching for the lamina occurrence. The results are displayed only for station Payerne, because at the other stations the results are similar. The winter results are given in Fig. 8 for the large (a) and small (b) laminae. The large laminae have similar behaviour for both GL and PL. Their maximal occurrence is observed in the lower stratosphere and there are no large laminae in the troposphere. On the other hand, the occurrence of the small laminae is different. GL have maximal occurrence in the troposphere. Similar behaviour is seen in spring (Fig. 9), where we observe strong small GL occurrence maximum in the troposphere. In spring small PL have the maximal occurrence in the lower stratosphere. In summer (Fig. 10) the large GL have a broad stratospheric maximum and the smaller maximum is observed in the troposphere. Large GL have a sharper stratospheric maximum and they are not very present in the troposphere. We observe broad stratospheric maximum in small PL occurrence in summer, while the small GL have a bimodal vertical profile with one maximum in the troposphere and the other maximum is present in the stratosphere. In autumn (Fig. 11) the maximum in occurrence of small PL and GL laminae is observed in the stratosphere.
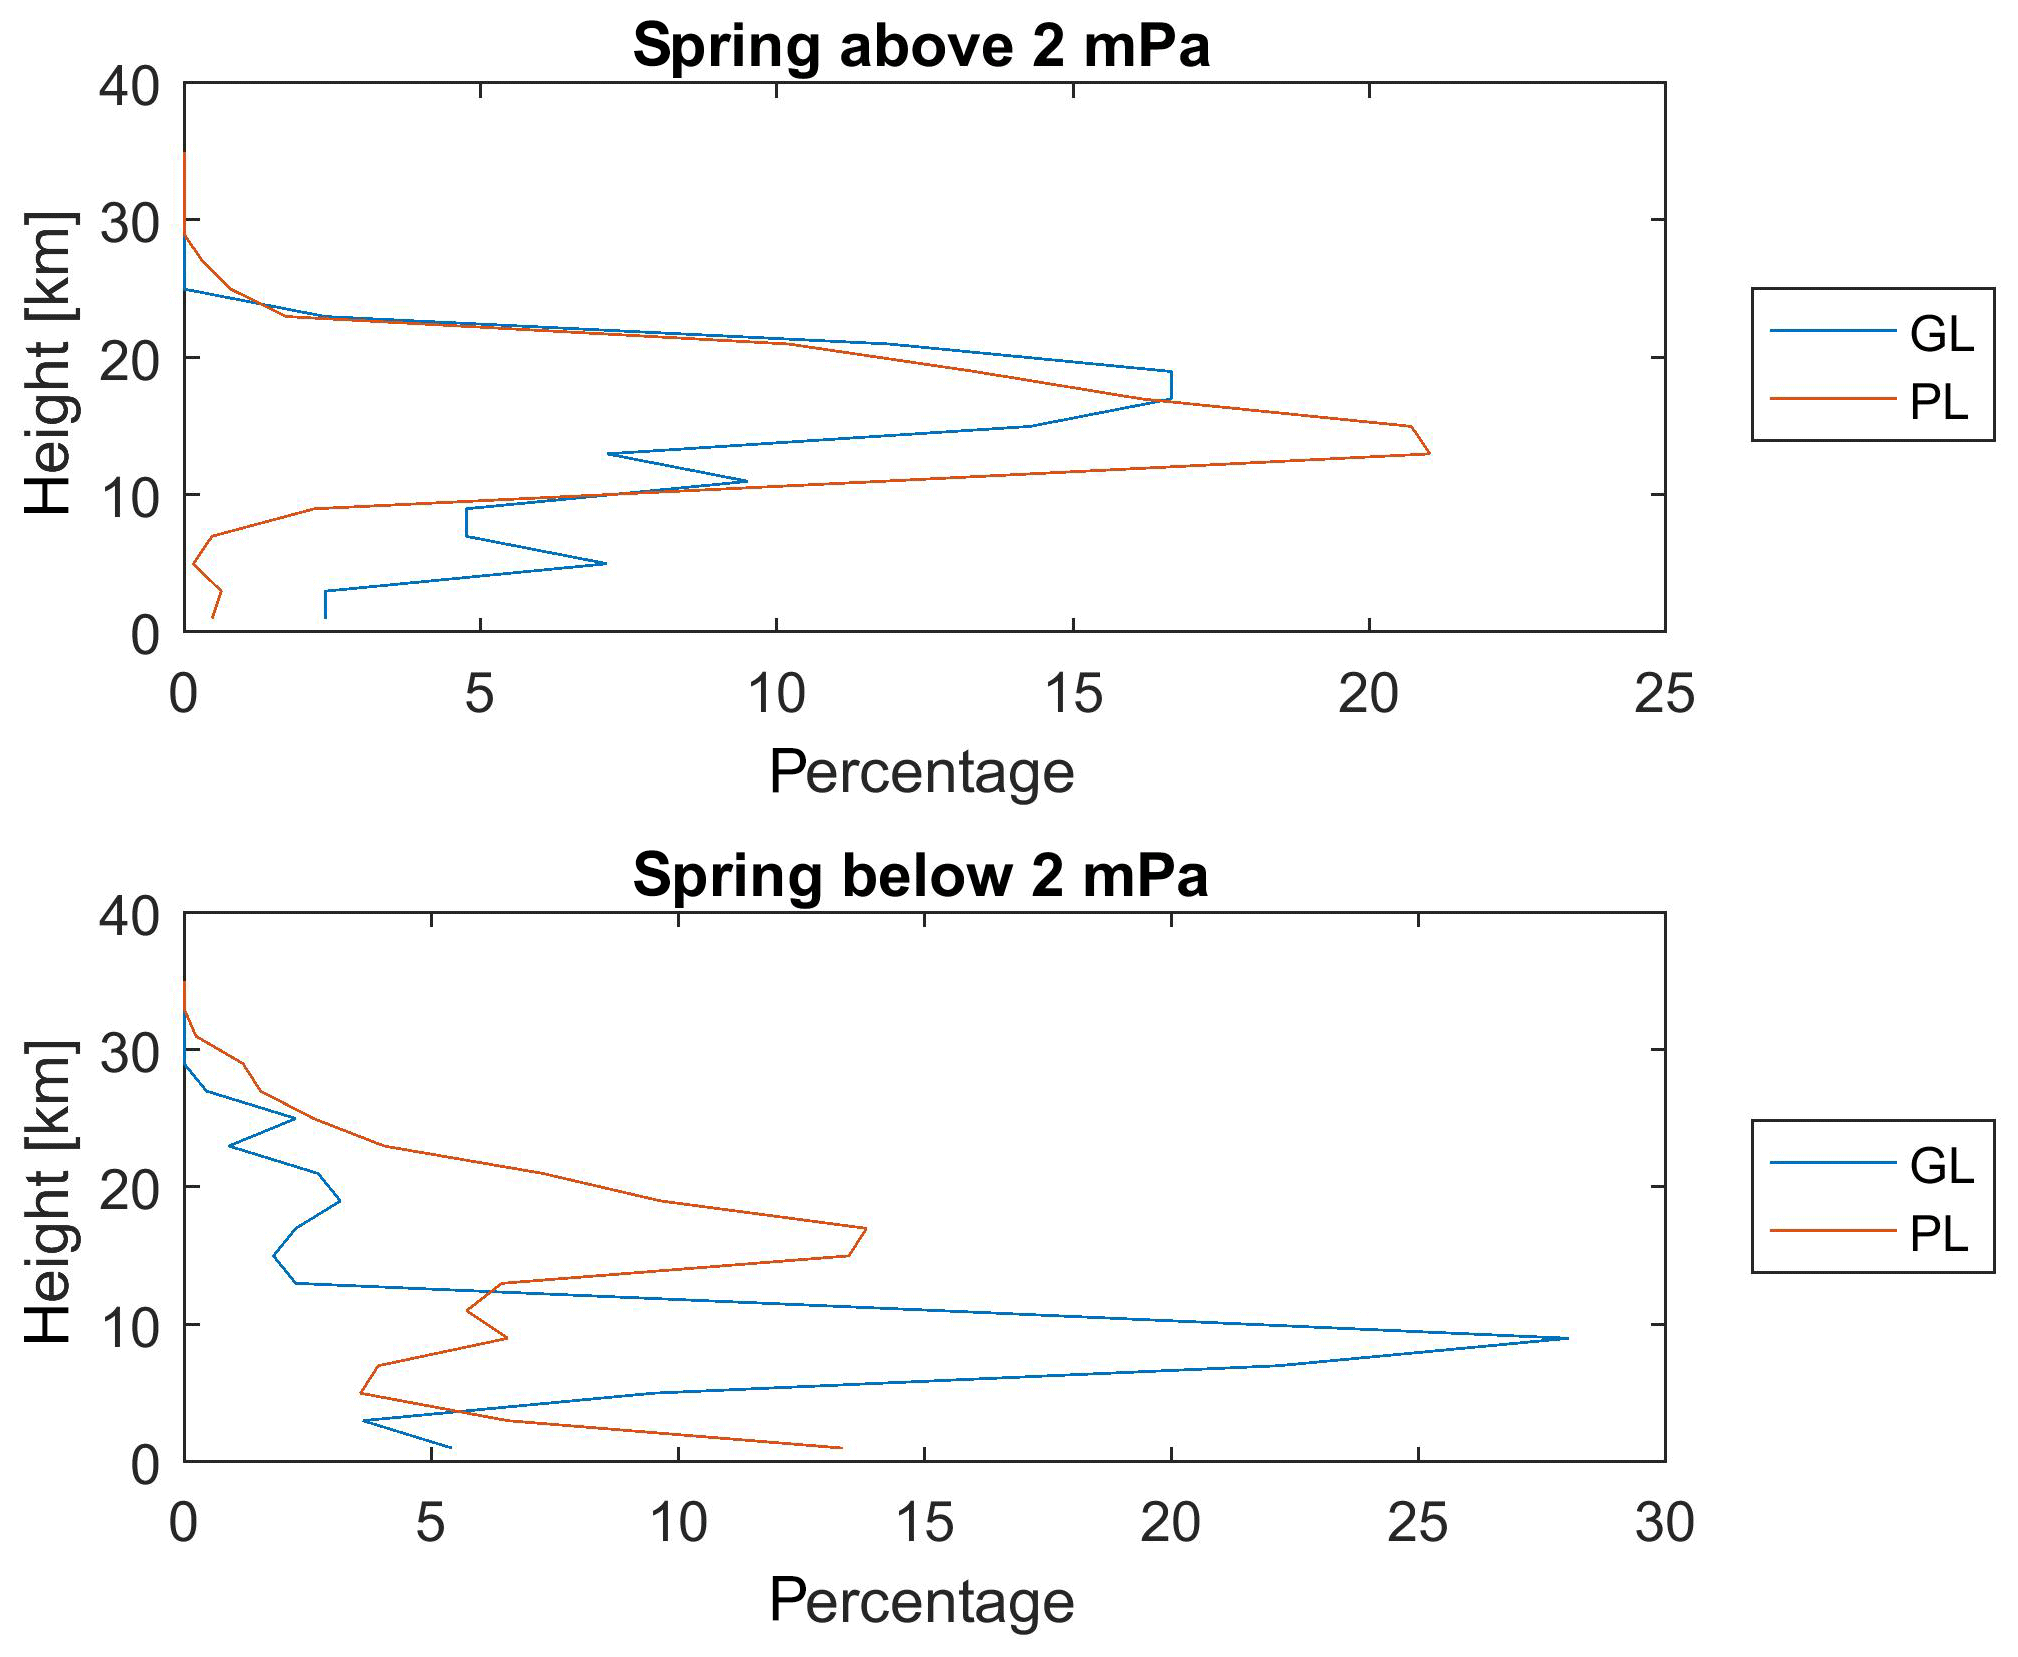
Figure 8The vertical dependence of the occurrence of the laminae induced by the gravity waves and the ones induced by planetary waves at Payerne in the period 1995–2016 in winter in terms of percentage of all GL and all PL.
We found the occurrence frequency of PL to be about 10–20 times larger than that of GL. The most frequent way of formation of the laminae induced by planetary waves is vertically different advection of air with the various ozone contents (Manney et al., 2000). Tomikawa et al. (2002) proposed one of the lamina formation mechanism vertical shears of the subtropical jet. In these processes we observe transformation of the horizontal gradient of the ozone concentration into the vertical one. The air with the high ozone concentration comes to midlatitudinal Europe in winter from the edge of the polar vortex (Orsolini et al., 2001). On the other hand, the low ozone air has its origin inside the polar vortex and is transported to the middle latitudes (Reid and Vaughan, 1991) or is the air from the low latitudes where ozone concentration is low (Orsolini et al., 1995).
The strong source of gravity waves is orography (Smith et al., 2008), especially passing the air through a mountain range when the gravity waves occur on the downwind side of the ridge. For stations used in this paper the most important mountains are the Alps. These stations are situated in such a way during prevailing westerly winds that they are not on the leeward side of the Alps and the share of gravity wave laminae are practically the same for all stations. The same is true for the laminae induced by planetary waves. In this case all stations are practically under the same conditions. So we cannot expect large interstation differences in lamina partitioning. It will be reasonable to do this investigation at the stations which lie on the leeward side of mountains or at stations which are in hotspots of the gravity wave activity (Sacha et al., 2016). The other sources of the gravity waves are jet stream and convection (Guest et al., 2000; Yoshiki et al., 2004). Their conditions are the same for all stations used in this study. In the troposphere the stratosphere–troposphere exchange may cause the positive laminae and in the stratosphere this exchange may lead to formation of negative laminae (Kritz, 1991).
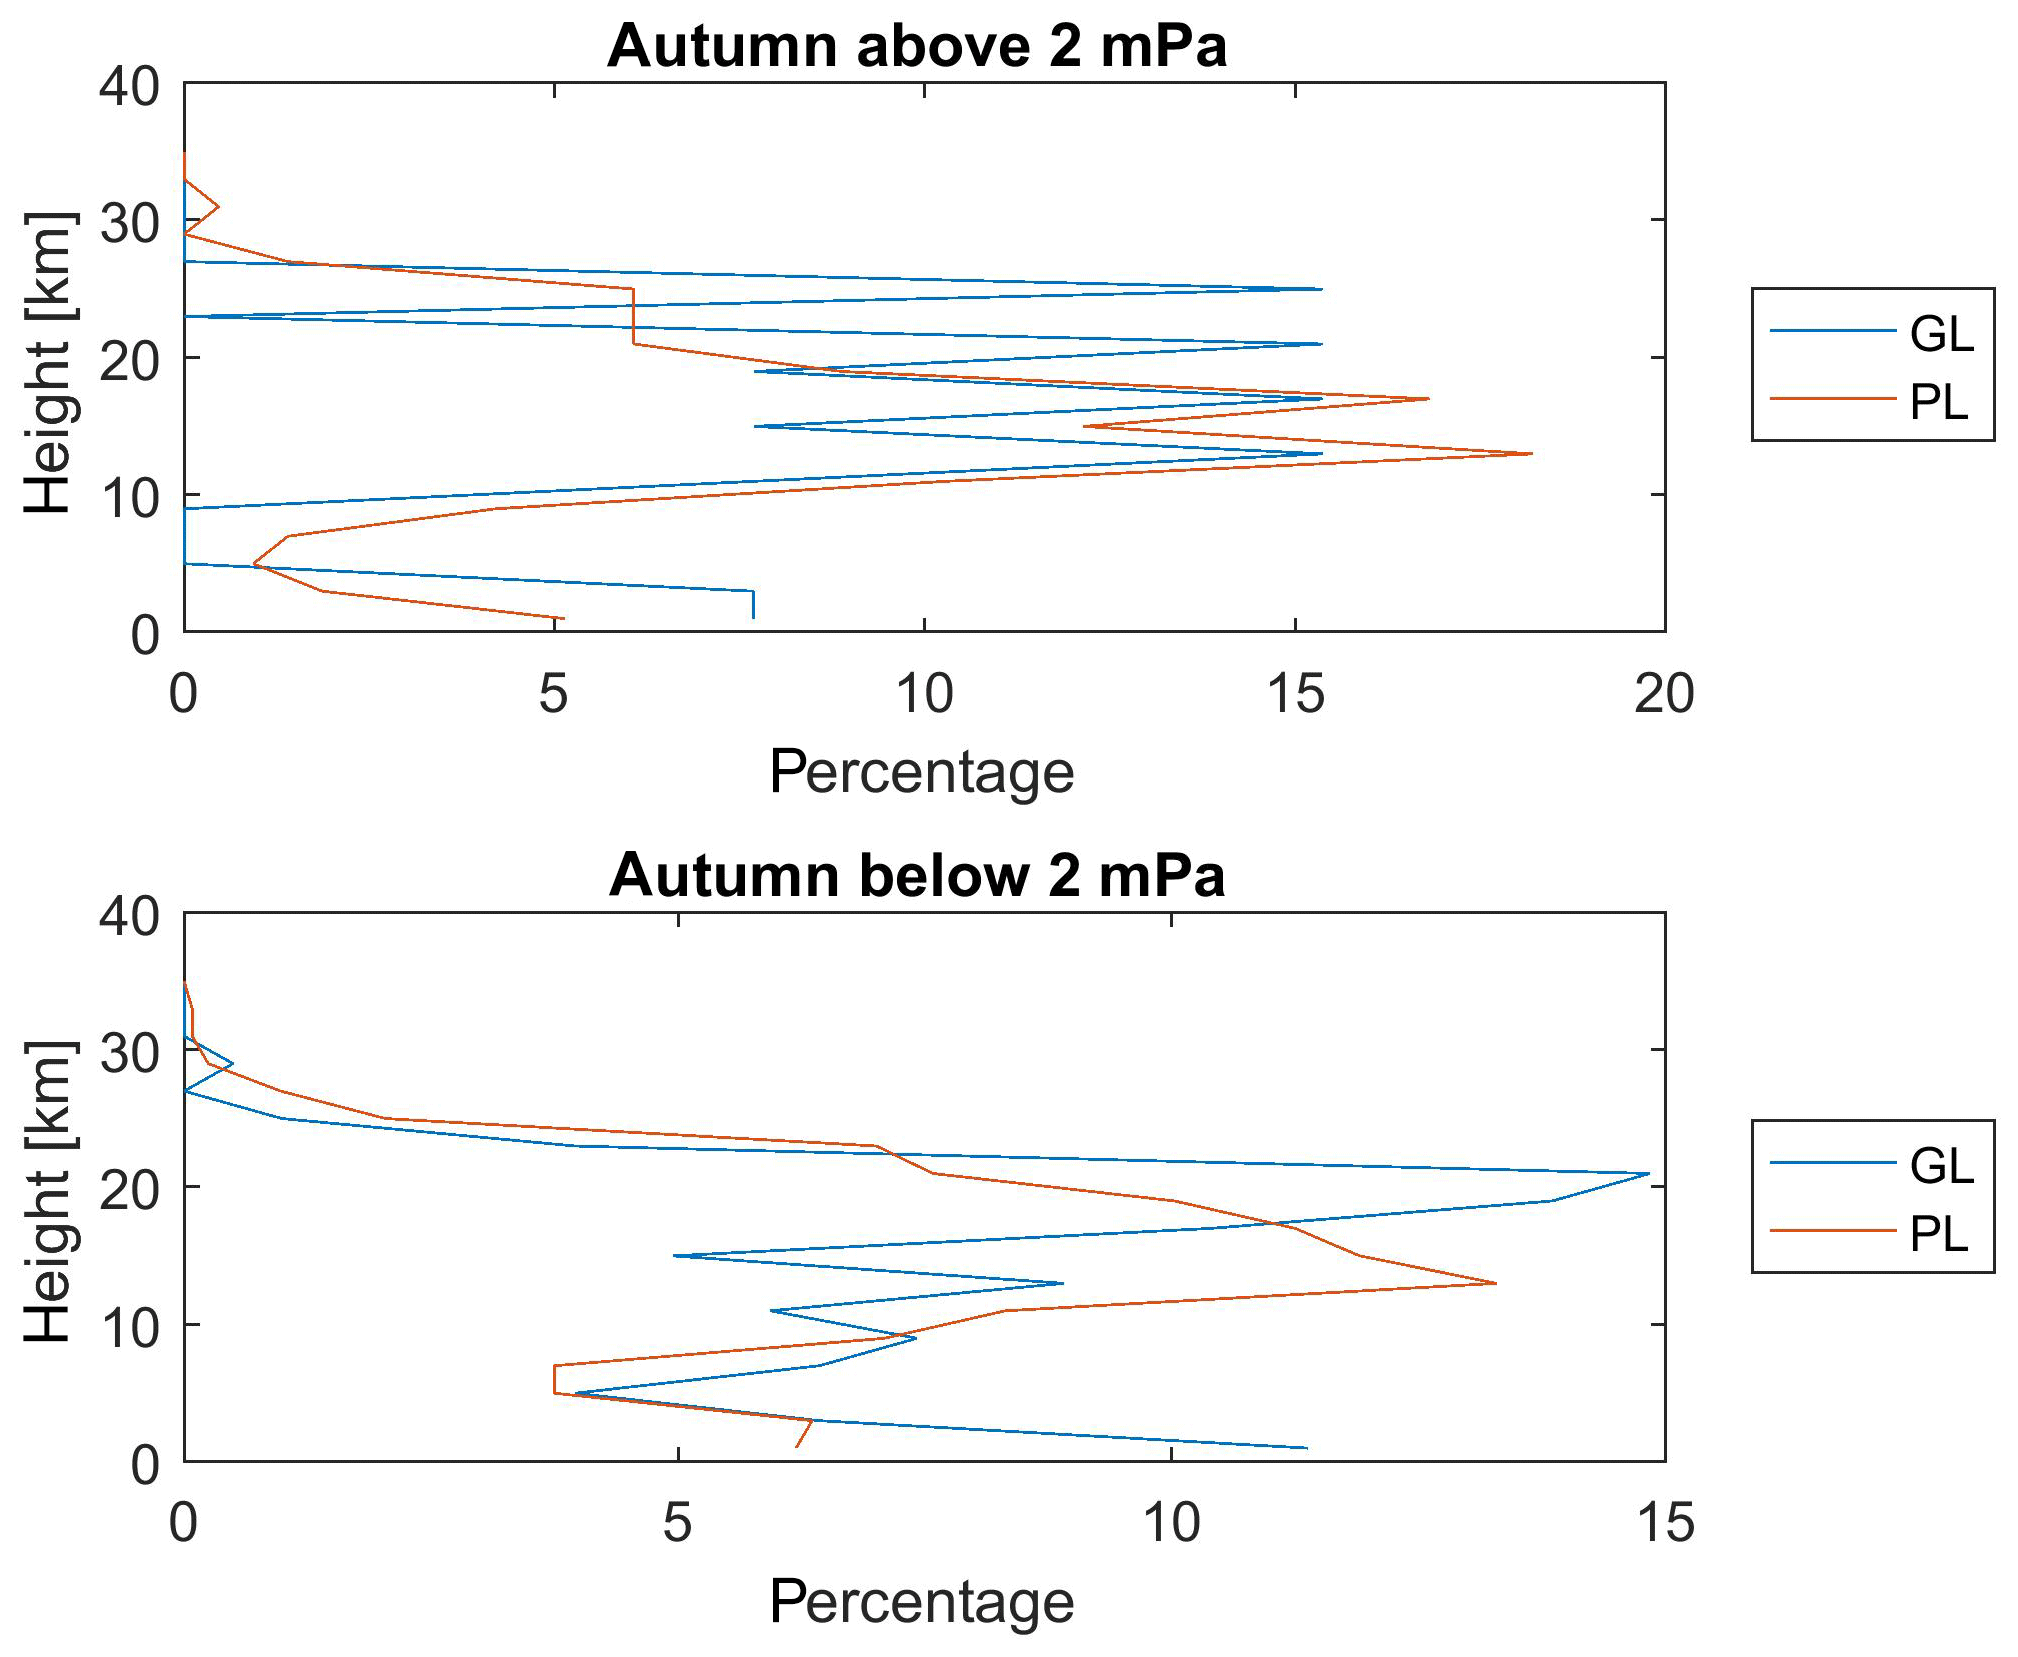
Laminae greater than 2 mPa occur very predominantly in the stratosphere, where the ozone concentration is high. When the ozone concentration is high, the probability of large lamina formation increases. The confirmation of this rule is also the yearly course of PL where the maximal occurrence is observed when the ozone concentration is the highest (winter and spring). On the other hand, in the troposphere we observe neither the PL large laminae nor the large GL due to a small ozone concentration. Similarly, we observe less large PL in the stratosphere in summer and autumn. This dependence of the lamina occurrence on the background ozone concentration is valid only for PL, not for the gravity wave ones.
For the laminae smaller than 2 mPa, the situation is different. We observe the differences in the vertical distribution of PL and GL. In winter the maximal occurrence is observed in the lower stratosphere in the case of PL, while gravity wave laminae have their occurrence maximum in the tropopause. In spring the small GL maximum lies lower than in winter. In summer the occurrence distribution has a bimodal structure with one maximum in the troposphere and the other one in the stratosphere. In autumn the stratospheric mode is dominant.
In summer and autumn there is no polar vortex. Vortex remnants (Durry et al., 2005) may form the positive laminae in the stratosphere, while the advection of air from low latitudes (Koch et al., 2002) creates layers with the low ozone concentration.
In the troposphere the situation is different. Positive laminae are created by various processes: the stratosphere–troposphere exchange (Manney et al., 2000), the advection of polluted air from the boundary layer (Oltmans et al, 2004; Collete et al., 2005), or in situ ozone production (Li et al., 2002). Tropospheric gravity waves occur predominantly in the transition region from the troposphere to the stratosphere where there is a strong change in the atmospheric stability.
Our paper is based on the lamina-searching procedure introduced by Teitelbaum et al. (1995). In their paper no climatological results are presented. They illustrated the method for partitioning of laminae for several case studies. The goal of our paper is to use this method for obtaining the climatological results from the mid-Europe ozonosonde stations. A similar searching method was used by Grant et al. (1998) and Pierce and Grant (1998), but for tropical and low-latitude stations. The authors found rare occurrence of PL and the majority of laminae were induced by gravity waves. We found more PL compared to the gravity-induced ones, because our investigation was done at middle latitudes, not at the low and tropical ones. The activity of planetary waves is stronger at the middle latitudes compared to the low and equatorial ones.
In this paper we were interested in PL and GL laminae which can be detected from the ozone profile. We evaluated the vertical profile of the PL and GL occurrence at Payerne. This station is situated in the valley between the Alps and the Jura mountains. The behaviour of PL is given by the activity of planetary waves, and thus there is no reason for which we can expect special behaviour of PL at this station. In the case of GL, the most important thing which governs GL behaviour is orography. The Alps are situated to the east (south-east) of the station, so during prevailing westerly winds the most important feature of orography is the Jura mountains, which are not high enough to generate strong gravitational waves in the stratosphere. We can speculate that some of the GL in the troposphere may have its origin in the Jura mountains.
The main results of this paper are the following.
-
Most often the laminae are induced by the planetary wave activity (45 %–50 %), followed by the indistinguishable ones (about 40 %). The share of the gravity wave laminae is about 10 %.
-
There is a pronounced annual variation in the occurrence frequency of PL, while there is no such variation for GL.
-
With increasing lamina size the share of gravity wave and indistinguishable laminae decreases, while the share of the planetary wave laminae increases.
-
The vertical distribution of the lamina number for large laminae has a maximum in the stratosphere, while the distribution of small laminae is type and season dependent.
Data were taken from WOUDC Toronto (http://woudc.org/archive/Archive-NewFormat/, last access: 1 July 2019).
All work was done by PK. JL gave some comments.
The authors declare that they have no conflict of interest.
Support by the Grant Agency of the Czech Republic via grant 18-01625S is acknowledged.
This research has been supported by the Czech scientific fund (grant no. 15-01625S).
This paper was edited by Andrew J. Kavanagh and reviewed by two anonymous referees.
Bird, J. C., Pal, S. R., Carswell, A. I., Donovan, D. P., Manney, G. L., Harris, J. M., and Uchino, O.: Observations of ozone structures in the Artic polar vortex, J. Geophys. Res., 102, 10785–10800, 1997.
Collete, A. and Ancellet, G.: Impact of vertical transport processes on the tropospheric ozone layering above Europe, Part II: Climatological analysis of the past 30 years, Atmos. Environ., 39, 5423–5435, 2005.
Dobson, G. M. B.: The laminated structure of the ozone in the atmosphere, Q. J. Roy. Meteor. Soc., 99, 599–607, 1973.
Durry, G. and Hauchecorne, A.: Evidence for long-lived polar vortex air in the mid-latitude summer stratosphere from in situ laser diode CH4 and H2O measurements, Atmos. Chem. Phys., 5, 1467–1472, https://doi.org/10.5194/acp-5-1467-2005, 2005.
Grant, W. B., Pierce, R. B., Oltmans, S. J., and Edward, W.: Seasonal evolution of total and gravity waves induced laminae in ozonosonde data in the tropics and subtropics, Geophys. Res. Lett., 25, 1863–1866, 1998.
Guest, F. M., Reeder, M. J., Marks, C. J., and Karoly, D. J.: Inertiagravity waves observed in the lower stratosphere over Macquarie Island, J. Atmos. Sci., 57, 737–752, 2000.
Kar, J., Trepte, C. R., Thomason, L. W., and Zawodny, J. M.: Observations of layers in ozone vertical profiles from SAGE II (v 6.0) measurements, Geophys. Res. Lett., 29, 1–4, https://doi.org/10.1029/2001GL014230, 2002.
Koch, G., Wernli, H., Staehelin, J., and Peter, T.: A Langrangian analysis of stratospheric ozone variability and long-term trends above Payerne (Switzerland) during 1970–2001, J. Geophys. Res., 107, 437, 1–14, https://doi.org/10.1029/2001JD001550, 2002.
Kritz, M. A., Rosner, S. W., Danielsen, E. F., and Selkirk, H. B.: Air mass origins and troposphere to stratosphere exchange associated with mid-latitude cyclogenesis and tropopause folding inferred from 7Be measurements, J. Geophys. Res., 96, 17405–17414, 1991.
Križan, P. and Laštovička, J.: Definition and determination of laminae in ozone profiles, Studia Geoph. Geod., 48, 777–789, 2004.
Križan, P. and Laštovička, J.: Trends in positive and negative ozone laminae in the Northern Hemisphere, J. Geophys. Res., 110, D10107, https://doi.org/10.1029/2004JD005477, 2005.
Laštovička, J. and Križan, P.: Trends in laminae in ozone profiles in relation to trends in someother middle atmospheric parameters, Phys. Chem. Earth, 31, 46–53, 2006.
Li, Q., Jacob, D. J., Fairlie, T. D., Liu, H., Martin, R. V., and Yantosca R. M.: Stratospheric versus pollution influences on ozone at Bermuda: Reconciling past analyses, J. Geophys. Res., 107, 4611, https://doi.org/10.1029/2002JD002138, 2002.
Manney, G. L., Michelsen, H. A., Irion, F. W., Toon, G. C., Gunson, M. R., and Roche, A. E.: Lamination and polar vortex development in fall from ATMOS long-lived trace gases observed during November 1994, J. Geophys. Res., 105, 29023–29038, 2000.
Oltmans, S. J., Johnson, B. J., Harris, J. M., Thompson, A. M., Liu, H. Y., Chan, C. Y., Vömel, H., Fujimoto, T., Brackett, V. G., Chang, W. L., Chen, J. P., Kim, J. H., Chan, L. Y., and Chang, H. W.: Tropospheric ozone over the North Pacific from ozonosonde observations, J. Geophys. Res., 109, D15801, https://doi.org/10.1029/2003JD003466, 2004.
Orsolini, Y., Simon, P., and Cariolle, D.: Filamentation and layering of an idealized tracer by observed winds in the lower stratosphere, Geoph. Res. Lett., 22, 839–842, 1995.
Orsolini, Y. J., Hansen, G., Hoppe, U. P., Manney, G. L., and Fricke, K. H.: Dynamical modeling of wintertime lidar observations in the Artic: Ozone laminae and ozone depletion, Q. J. Roy. Meteor. Soc., 123, 785–800, 1997.
Orsolini, Y. J., Hansen, G., Manney, G. L., Livesey, N., and Hoppe, U. P.: Lagrangian reconstruction of ozone column and profile at the Artic Lidar Observatory for Middle Atmosphere Research (ALOMAR) throughout the winter and spring of 1997–1998, J. Geophys. Res., 106, 10011–10021, 2001.
Pierce, R. B. and Grant, W. B.: Seasonal evolution of Rossby and gravity wave induced laminae in oznosonde data obtained from Wallops Island, Virginia, Geophys. Res. Lett., 25, 1859–1862, 1998.
Reid, S. J. and Vaughan, G.: Lamination in ozone profiles in the lower stratosphere, Q. J. Roy. Meteor. Soc., 117, 825–844, 1991.
Sacha, P., Lilienthal, F., Jacobi, C., and Pisoft, P.: Influence of the spatial distribution of gravity wave activity on the middle atmospheric dynamics, Atmos. Chem. Phys., 16, 15755–15775, https://doi.org/10.5194/acp-16-15755-2016, 2016.
Smith, R. B., Woods, B. K., Jensen, J., Cooper, W. A., Doyle, J. D., Jiang, Q., and Grubišić, V.: Mountain Waves Entering the Stratosphere, J. Atmos. Sci., 65, 2543–2562, https://doi.org/10.1175/2007JAS2598.1, 2008.
Teitelbaum, H., Moustaoui, M., Ovarlez, J., and Kelder, H.: The role of atmospheric waves in the laminated structures of ozone profiles at high latitude, Tellus A, 48, 442–455, 1995.
Teitelbaum, H., Basdevant, C., and Moustaoui, M.: Explanations for simultaneous laminae in water vapor and aerosol profiles found during the SESAME experiment, Tellus A, 52, 190–202, 2000.
Tomikawa, Y., Sato, K., Kita, K., Fujiwara, M., Yamamori, M., and Sano, T.: Formation of an ozone lamina due to differential advection revealed by intensive observations, J. Geophys. Res., 107, 1–10, 2002.
WOUDC Toronto: http://woudc.org/archive/Archive-NewFormat/, last access: 1 July 2019.
Yoshiki, M., Kizu, N., and Sato, K.: Energy enhancements of gravity waves in the Antarctic lower stratosphere associated with variations in the polar vortex and tropospheric disturbances, J. Geophys. Res., 109, D23104, https://doi.org/10.1029/2004JD004870,2004.