the Creative Commons Attribution 4.0 License.
the Creative Commons Attribution 4.0 License.
 | 21 Nov 2019
Investigation of the behavior of the atmospheric dynamics during occurrences of the ozone hole's secondary effect in southern Brazil
Gabriela Dornelles Bittencourt
Damaris Kirsch Pinheiro
José Valentin Bageston
Hassan Bencherif
Luis Angelo Steffenel
Lucas Vaz Peres
The Antarctic ozone hole (AOH) directly influences the Antarctic region, where its levels can reach values below 220 DU. The temporary depletion of ozone in Antarctica generally occurs between the beginning and middle of August, during the austral spring, and extends to November, when a temporary reduction in ozone content is observed in a large region over the Antarctic continent. However, masses of ozone-depleted air can break away from the ozone hole and reach mid-latitude regions in a phenomenon known as the secondary effect of the Antarctic ozone hole. The objective of this paper is to show how atmospheric dynamics behave during the occurrence of this type of event, especially in mid-latitude regions, such as southern Brazil, over a 12-year observation period. For the analysis and identification of the events of influence of the AOH on the southern region of Brazil, data from the total ozone column were used from ground-based and satellite experiments, the Brewer Spectrophotometer (MkIII no. 167), and the Ozone Monitoring Instrument (OMI) on the Aura satellite. For the analysis of the stratospheric and tropospheric fields, the ECMWF reanalysis products were used. Thus, 37 events of influence of the AOH that reached the southern region of Brazil were identified for the study period (2006–2017), where the events showed that in approximately 70 % of the cases they occurred after the passage of frontal systems and/or atmospheric blocks over southern Brazil. In addition, the statistical analysis showed a strong influence of the jet stream on mid-latitude regions during the events. Among the 37 identified events, 92 % occurred in the presence of the subtropical and/or polar jet stream over the region of study, possibly explaining the exchange of air masses of ozone deficient in the upper troposphere–lower stratosphere (UT–LS) region.


Discovered in 1840 by Christian F. Schonbein, ozone is the most important constituent of stratospheric gas traces which, together with water vapor (H2O) and carbon dioxide (CO2), are responsible for the Earth's energy balance (Seinfeld and Pandis, 2016). Due to its ability to absorb ultraviolet radiation (UV) (Salby, 1996; Dobson, 1968), O3 is the most important component in the stratosphere from the point of view of skin protection against harmful UVB solar radiation (even considering that a small portion of this spectrum can pass through the O3 layer and hit the ground surface). Most of its atmospheric content (about 90 %) is concentrated in the stratosphere between 15 and 35 km altitude (London, 1985) in the region known as the “ozone layer”.
The concentration of ozone in a particular region of the Earth is mainly determined by the meridional transport of this element in the stratosphere (Gettelman et al., 2011). The explanation for the higher concentration of ozone found in polar rather than equatorial regions (where there is greater production) is precisely a special type of poleward transport known as the Brewer–Dobson circulation, in which air masses are transported quasi-horizontally from the stratospheric tropical reservoir to polar regions (Brewer, 1949; Dobson, 1968; Bencherif et al., 2007). The poleward transport of stratospheric ozone is one of the essential factors for the concentration of this atmospheric constituent in a certain region of the planet (Ploeger et al., 2012), being much studied from the use of potential vorticity, which correlates with the transport of chemical constituent tracers such as ozone (O3), nitrous oxide (N2O), and water vapor (H2O) on isentropic surfaces in the lower stratosphere. The potential vorticity (PV) acts as a dynamical tracer for large-scale air mass transport, behaving as a material surface where the potential temperature is conserved (Hoskins et al., 1985). In the lower reaches of the stratosphere the lifetime of O3 molecules is longer, and therefore they can be used as a tracer in the study of air mass flow in the stratosphere–troposphere exchange events (Bukin et al., 2011).
The first studies discussing the ozone concentration in polar regions showed that during the spring of the Southern Hemisphere there was a massive reduction of the O3 content known as the Antarctic ozone hole (AOH) (Chubachi, 1984; Farman et al., 1985; Solomon, 1999). The ozone hole area is defined when there is a region with values below 220 DU, less than two-thirds of the historical level (Hofmann et al., 1997). Nevertheless, temporary destruction directly influences ozone content around the polar regions due to the crossing of the polar vortex boundary over these regions, causing drastic reductions in the ozone content and an increase in the levels of surface ultraviolet radiation (Casiccia et al., 2008). Studies by Guarnieri et al. (2004) have shown that reductions of up to 1 % in total ozone content in southern Brazil cause an average 1.2 % increase in surface ultraviolet radiation. In addition, increased ozone-related ultraviolet radiation may also affect aquatic and terrestrial systems, helping to explain the decline in amphibian species associated with genetic malformations caused by increased radiation levels received (Schuch et al., 2015). However, their effects can affect regions of middle and low latitudes, causing temporary decreases in the total columns of ozone.
Poor ozone air masses are released from the interior of the Antarctic polar vortex, the edge of the ozone hole, being carried by the polar filaments in these regions (Marchand et al., 2005) in a phenomenon called the secondary effect of the Antarctic ozone hole that causes a temporary fall in ozone content first observed by Kirchhoff et al. (1996) over the south of Brazil. Peres et al. (2014) and Peres (2016) showed the effects of this secondary event on mid-latitude regions such as the southern region of Brazil, where ozone content falls over the region from August to November. Recently, Bittencourt et al. (2018) reported on the second most intense event ever recorded in the southern region of Brazil. According to the latest World Meteorological Organization (WMO) reports (WMO, 2014, 2018), there is a growth trend between the 1980s and 1990s, stabilizing at high rates since the year 2000 despite indications of declining trends in Antarctic ozone in recent years (Solomon et al., 2016).
Unlike other regions of Brazil, the weather conditions in southern Brazil are strongly influenced by transient meteorological systems (Reboita et al., 2010). Examples of such systems are cold and hot fronts, which carry strong westerly winds at high tropospheric levels called jet streams. Moreover, the upper troposphere–lower stratosphere (UT–LS) region in southern Brazil seems to be the home of many dynamical processes, such as stratosphere–troposphere exchanges and isentropic transport between the tropical stratosphere reservoir, polar vortex, and middle latitude. Indeed, understanding the patterns of the UT–LS is important in understanding transport and exchange processes and the links with tropospheric meteorology (Ohring et al., 2010).
Because of this, the main objective of this paper is to show how atmospheric dynamics behave during the occurrence of events of influence of the Antarctic ozone hole over mid-latitude regions such as southern Brazil, during a 12-year observation period. In addition, recent works (Peres et al., 2014; Bittencourt et al., 2018) show that there is a secondary influence of the ozone hole with these regions where the tropospheric dynamics behavior can influence most cases in the occurrence of these events.
2.1 Region of study and instruments
The region of study was the central portion of Rio Grande do Sul, comprising the city of Santa Maria – RS (29.72∘ S, 53.72∘ W). In this work two instruments were used for the analysis of the total ozone content over the southern region of Brazil for a period of 12 years of data (2006–2017). The ground-based instrument named the Brewer Spectrophotometer (Brewer Model MarK – Brewer MKIII, no. 167), from now on referred to only as Brewer (Brewer Models, 2019), was operated in the municipality of São Martinho da Serra – RS (about 30 km from the city of Santa Maria – RS), and data from the OMI were used for the days when there were no Brewer measurements, completing the database for the region of study.
Total ozone column (TOC) measurements were obtained by using data from Brewer model MBIV no. 081 spectrophotometers during the period 1992–2000, from model MKII no. 056 from 2000 to 2002, and finally by model MKIII no. 167 from 2002 until today (Brewer Website, 2019). All the above-listed instruments were operated at the Southern Space Observatory (SSO), located about 14 km from downtown São Martinho da Serra – RS (29.44∘ S, 53.82∘ W; elevation 476 m). The Brewer instrument operating at SSO/INPE is part of Brewer's Brazilian network that is calibrated against the standard travel reference Brewer no. 017, managed by International Ozone Services (IOS), and Brewer no. 158 from manufacturer Kipp & Zonen (SCI TEC, 1988).
Brewer is a fully automated instrument designed for terrestrial measurements of spectral irradiations in the UV-B range of the solar spectrum at five wavelengths, 306.3, 310.1, 313.5, 316.8, and 320.1 nm (Kerr, 2002), with an approximated resolution of 0.5 nm allowing the total column of ozone (O3) and sulfur dioxide (SO2) (Fioletov et al., 2005) to be obtained. The MKIV instrument also measures intensity of radiation in the visible part of the spectrum (430–450 nm) and uses differential absorption in this region to infer total column nitrogen dioxide (Brewer Manual, 2019). This instrument also permits the optical thickness of atmospheric aerosols and the vertical O3 profile to be obtained by the Umkehr technique (Kerr, 2002; Brewer Manual, 2019).
Peres et al. (2019) analyzed a long-term (35-year) total ozone column (TOC) series for southern Brazil using Brewer data and satellites, where they showed good agreement between ground-based and satellite instruments. Vanicek (2003) presented a history of calibrations of the Dobson and Brewer instruments in Prague, Czech Republic, where the correct function of the Brewer Spectrophotometer was shown and, consequently, its accurate observation process, which depends only on the precise adjustments of the optics as components of Brewer's electronics and mechanics. In South America, the accuracy and quality of TOC data are ensured by cross-calibration using the Brewer no. 017 calibrator, allowing a deviation of only about 0.58 % from daily averages (Fioletov et al., 2005).
The Ozone Monitoring Instrument (OMI) launched in July 2004 onboard NASA's Earth Observing System Aura satellite (Levelt et al., 2006) is a continuation of the records made by the Total Ozone Mapping Spectrometer (TOMS) NASA program that began in 1978 and was officially closed in 2007 (NASA website, 2019). This state-of-the-art instrument, the OMI, measures the TOC besides other atmospheric parameters related to ozone chemistry and climate (e.g., NO2, SO2). OMI also can distinguish distinct types of aerosols (such as smoke, dust, and sulfates) and measures the atmospheric pressure and cloud coverage. The Earth's atmosphere is observed in 740 spectral bands of wavelength along the satellite path, with a band large enough to provide global coverage in 14 orbits (1 d). The 13×24 km spatial resolution can be expanded to 13×12 km to detect and track sources of pollution on an urban scale and observes the atmosphere in two ultraviolet bands, named UV-1 (270 to 314 nm) and UV-2 (306 to 380 nm), with spectral resolutions of 0.45 and 1 nm, respectively (Levelt et al., 2006). In terms of the TOC (in Dobson units, DU), the OMI presents an absolute accuracy (the root sum of square of all (1σ) errors) of 3 % and a relative accuracy of 1 %, respectively, for the full vertical column and for the 13×24 km in horizontal resolution (Levelt et al., 2006).
We also used reanalysis data available at Era-Interim/ECMWF, and described by Dee et al. (2011), where meteorological fields were prepared for the analysis of the stratospheric and tropospheric dynamics. Due to radiosonde limitations in the region of study, the spatial resolution used was 2.5∘ × 2.5∘ latitude–longitude, responding well to the objectives of this work, where a higher resolution is not necessary for further details. For the stratospheric dynamics analysis, data of potential vorticity and ozone mixing ratio were used at the potential temperature levels of 265 and 850 K. For the analysis of tropospheric dynamics, wind data (components u, v, and w), geopotential height, and layer temperature available from 1000 to 1 hPa, at the pressure level, in addition to pressure data at mean sea level were used. With these data, potential vorticity fields were made for the potential temperature levels of 600 and 700 K. For tropospheric fields, there were sea-level pressure and layer thickness between 1000 and 500 hPa, a horizontal layer cut showing the jet at 250 hPa and Omega at 500 hPa, and a vertical cut of the layer between 1000 and 50 hPa of potential temperature and wind (m s−1) for the longitude of 54∘ W.
The HYSPLIT/NOAA model was used to help identify the events of influence of the Antarctic ozone hole over the region of study (Rolph et al., 2017). The Lagrangian HYSPLIT model is a complete system for calculating simple trajectories of air parcels as well as complex transport simulations, chemical transformation, and deposition (HYSPLIT, 2019). The model assumes that a particle follows the wind flow passively; its trajectory is the integration of the particle position vector in space and time. In this study, which aims to show the air mass behavior for 4 d before the events, the HYSPLIT model, an isentropic vertical velocity model, was used to assist in the observation of possible event days over the region, available in HYSPLIT (2019).
2.2 Identification of AOH influence events
The identification of the events of influence of the AOH is done first by the analysis of the average daily data of the TOC through instruments onboard satellites and on the ground. In this work, 12 years of satellite data were analyzed with the aim of identifying days where the mean daily value of TOC is less than the climatological average for the month of analysis, i.e., the climatological average minus 1.5 of its standard deviation value (μ−1.5σ), where μ is a climatological average for the month of interest, σ is the standard deviation, and the value of −1.5 is the criterion chosen from the normal frequency distribution tests (Wilks, 2006). This criterion was also used by Peres (2016), where it was observed that the variations around the mean value can represent well the influences of the ozone content in the region of investigation.
After identifying the possible days of influence of the AOH over the region of study, the analysis of isentropic surfaces was conducted, where absolute potential vorticity (APV) fields were made. For the analysis of the stratospheric dynamics, we used reanalysis data available on the Era-Interim/ECMWF platform, and the APV fields were analyzed on isentropic surfaces for the potential temperature levels of 600 and 700 K. PV was used in previous studies that correlated PV with chemical constituents such as ozone, water vapor, and nitrous oxide on isentropic surfaces (adiabatic surfaces where the potential temperature remains constant) in the lower troposphere (Schoeberl, 1989).
In these case studies, the PV acts as a dynamic large-scale air mass tracer and can be used as a horizontal coordinate (Hoskins et al., 1985). In this way, this type of analysis aims to verify the origin of the air masses in which an APV increase is observed when the air mass originates from the highest latitudes (e.g., Antarctica). For this analysis, one needs to consider the previous days of the event or equatorial origin when a decrease in absolute potential vorticity occurs (Semane et al., 2006). Bittencourt et al. (2018) and Bresciani et al. (2018) showed the analysis of an extreme event of influence of the AOH on regions of middle latitudes through the analysis of the stratospheric dynamics with the fields of PV.
In the analysis of potential vorticity fields, the air mass trajectory was observed. When there is an increase in the APV it can be stated that the mass of air had a polar origin, and otherwise (decrease in the APV) the air mass has an equatorial origin. As described above, the APV acts as a dynamic marker for large-scale air masses and, thus, observations are made to identify the secondary effect of AOH, where reductions in O3 content are observed from intense to moderate (Bittencourt et al., 2018; Peres, 2016).
2.3 Tropospheric analysis
After identifying all the events for the study period (2006–2017), meteorological fields were prepared for the analysis of tropospheric dynamics, which aims to show how the troposphere behaved before, during, and after the occurrence of every event of the secondary effect of the AOH identified in southern Brazil. Peres et al. (2014) showed a case study of 2012, presenting two events of the influence of the AOH on the southern region of Brazil in which the synoptic analysis was done for the region on the day of the event. The results showed that one of the events occurred just after the passage of a frontal stationary system, where then the arrival of a high-pressure system helped to stabilize the region and in the advance of the air masses poor in O3, configuring the occurrence of the AOH influence event.
The meteorological data for the construction of the pressure fields at sea level and the layer thickness between 1000 and 500 hPa were obtained by the ECMWF, and the purpose here is to check which synoptic systems predominated during the events. A presence of the subtropical jet is intended to be displayed in the field of horizontal winds at 250 hPa and Omega at 500 hPa. In addition, ascending and descending surface movements were identified. Another field analyzed was the vertical cut of the atmosphere at different levels of potential temperature (in Kelvin) and wind components (in m s−1) for the longitude of 54∘ W. In this case, the jet stream was present at higher levels of the troposphere, which may aid in air exchanges from the stratosphere to the troposphere (Santos, 2016).
2.4 Statistical analyses
The average daily data of the ECMWF for the horizontal wind components (zonal – u – and meridional – v) and also the vertical movement velocity (Omega – w) were used for this analysis. In addition, temperature and geopotential height or the available pressure levels between 1000 and 1 hPa and the component of PV and O3 for the level of 700 K potential temperature were used. These data were correctly read and organized into matrices with the daily averaged values for each of these variables (temperature, u, v, and w, geopotential, PV, and O3) in a grid of 2.5∘ latitude by 2.5∘ longitude at the levels previously used.
As the set of data used in the preparation of the stratospheric and tropospheric analysis fields was only for the months of interest in this analysis, from August to November in 12 years, the reduction of this dataset allowed the separation of the days of interest (days of occurrence of events of influence of the AOH on the southern region of Brazil) and the subsequent calculation of the monthly averages.
For stratospheric analysis, mean fields of all identified events were made for a period of 3 d before and after each event. For the anomaly analysis of the potential vorticity fields, the following expression was used:
Equation 1 is used in the following way: the average of all events for each month is used and then this value is decreased from the month's climatological average. For the tropospheric statistical analyses, the average fields of the identified events of the horizontal cut of the atmosphere were made with the objective of analyzing the behavior of the jet stream at 250 hPa and Omega at 500 hPa.
In this work, the daily average data of the total ozone column were analyzed from the two instruments described above (Brewer and OMI), comprising a 12-year analysis period from 2006 to 2017, mainly from August to November (southern spring). Comparing the two instruments (figure not shown here, but very similar to Fig. 2 of Peres et al., 2019), the correlation index found here was considered very high, i.e., R2=0.96, showing high proportionality between the instruments used in this study. The results are also similar to the observations reported by Antón et al. (2009) for the Iberian Peninsula, where the Brewer and OMI total ozone datasets were compared, and also with other results from separate ozone monitoring stations around the world (Hendrick et al., 2011; Keckhut et al., 2010).
After the identification of the mean daily data of the TOC and analysis of the monthly climatology of the data observed at the SSO, the first step for the identification of AOH side-effect events over the study region is the analysis of the climatological average for the reference months and the occurrence of AOH during the extended austral spring period (August to November). For this, days are chosen in which a strong decrease in the ozone content is observed, i.e., when the average daily value of the total ozone column is less than the average climatological value (for the respective month) minus 1.5 of its standard deviation (μ−1.5σ). Table 1 shows the TOC monthly climatological values with monthly standard deviation, together with the lower TOC limit, for the extended spring season.
Table 1Monthly climatological values, their standard deviations, and limit −1.5σ for August, September, October, and November for the South Space Observatory (SSO).

After the confinement of the drop limits presented in Table 1, we analyzed 90 d where the TOC value of the respective day was lower than this limit minus 1.5σ. From these days, using a methodology described above, a total of 37 events were identified as important events that reached the southern region of Brazil from August to November in the years from 2006 to 2017. As expected, based on previous works and climatology, the identified events occurred mostly during October, and it is in good agreement with the results found by Peres (2016). To exemplify the analysis developed in this paper, we present in the next section a case study that took place on 18 September 2017, as this is the most recent event identified throughout the observed period, showing a side-effect event of AOH in the region of southern Brazil. Other interesting, and even more prominent, events have already been reported by Bresciani et al. (2018) and Bittencourt et al. (2018).
3.1 Case study: event observed on 18 September 2017
The event that occurred on 18 September 2017 presented a TOC value, measured by the Brewer Spectrophotometer, of 271.5 DU, representing a decrease of approximately 8.5 % in comparison with the climatological average for the month of September, as reported in Table 1. The observed decrease in TOC could be attributed to isentropic transport in the stratosphere.
Figure 1 shows the PV fields obtained from ECMWF data at 600 and 700 K isentropic levels in the stratosphere. One can see from Fig. 1 that Chile, Argentina, Uruguay, the south of Brazil, and Paraguay are under the influence of the passage of stratospheric air masses characterized by APV values greater than 100. We obtained almost the same PV pattern at the 600 K isentropic level. As explained above, PV is a conservative dynamical parameter and indicates the transport of air masses which takes place on isentropic surfaces (Hoskins et al., 1985). Therefore, PV distributions could be used to determine the origin of air masses. Since PV values are positive in the Northern Hemisphere and negative in the Southern Hemisphere, for convenience, we refer hereafter to the APV, which is positive regardless of the latitude. From Fig. 1 we can observe that PV values are higher than 100 and can be associated with air masses of polar origin, which suggests that the observed decrease in the total ozone column at the SSO, in the south of Brazil, is a result of the transport of air masses with low ozone concentration from high southern latitudes. In order to corroborate this hypothesis, the Lagrangian HYSPLIT model was initialized on 18 September 2018 at the SSO location and run for back-trajectory retrievals in the lower stratosphere (see Fig. 2a). All the stratospheric back-trajectories show that air masses observed over the SSO in the south of Brazil traveled northward and eastward over the polar region. This confirms the polar origin of the observed air masses. Moreover, Fig. 2b illustrates the global distribution of TOC recorded by the OMI experiment on 18 September 2018. It shows that transport of polar air is characterized by a reduction in TOC distribution extending from the polar region up to the mid-latitude region. This well illustrates the side effect of AOH, resulting in a decrease in stratospheric ozone concentrations during the analyzed event.
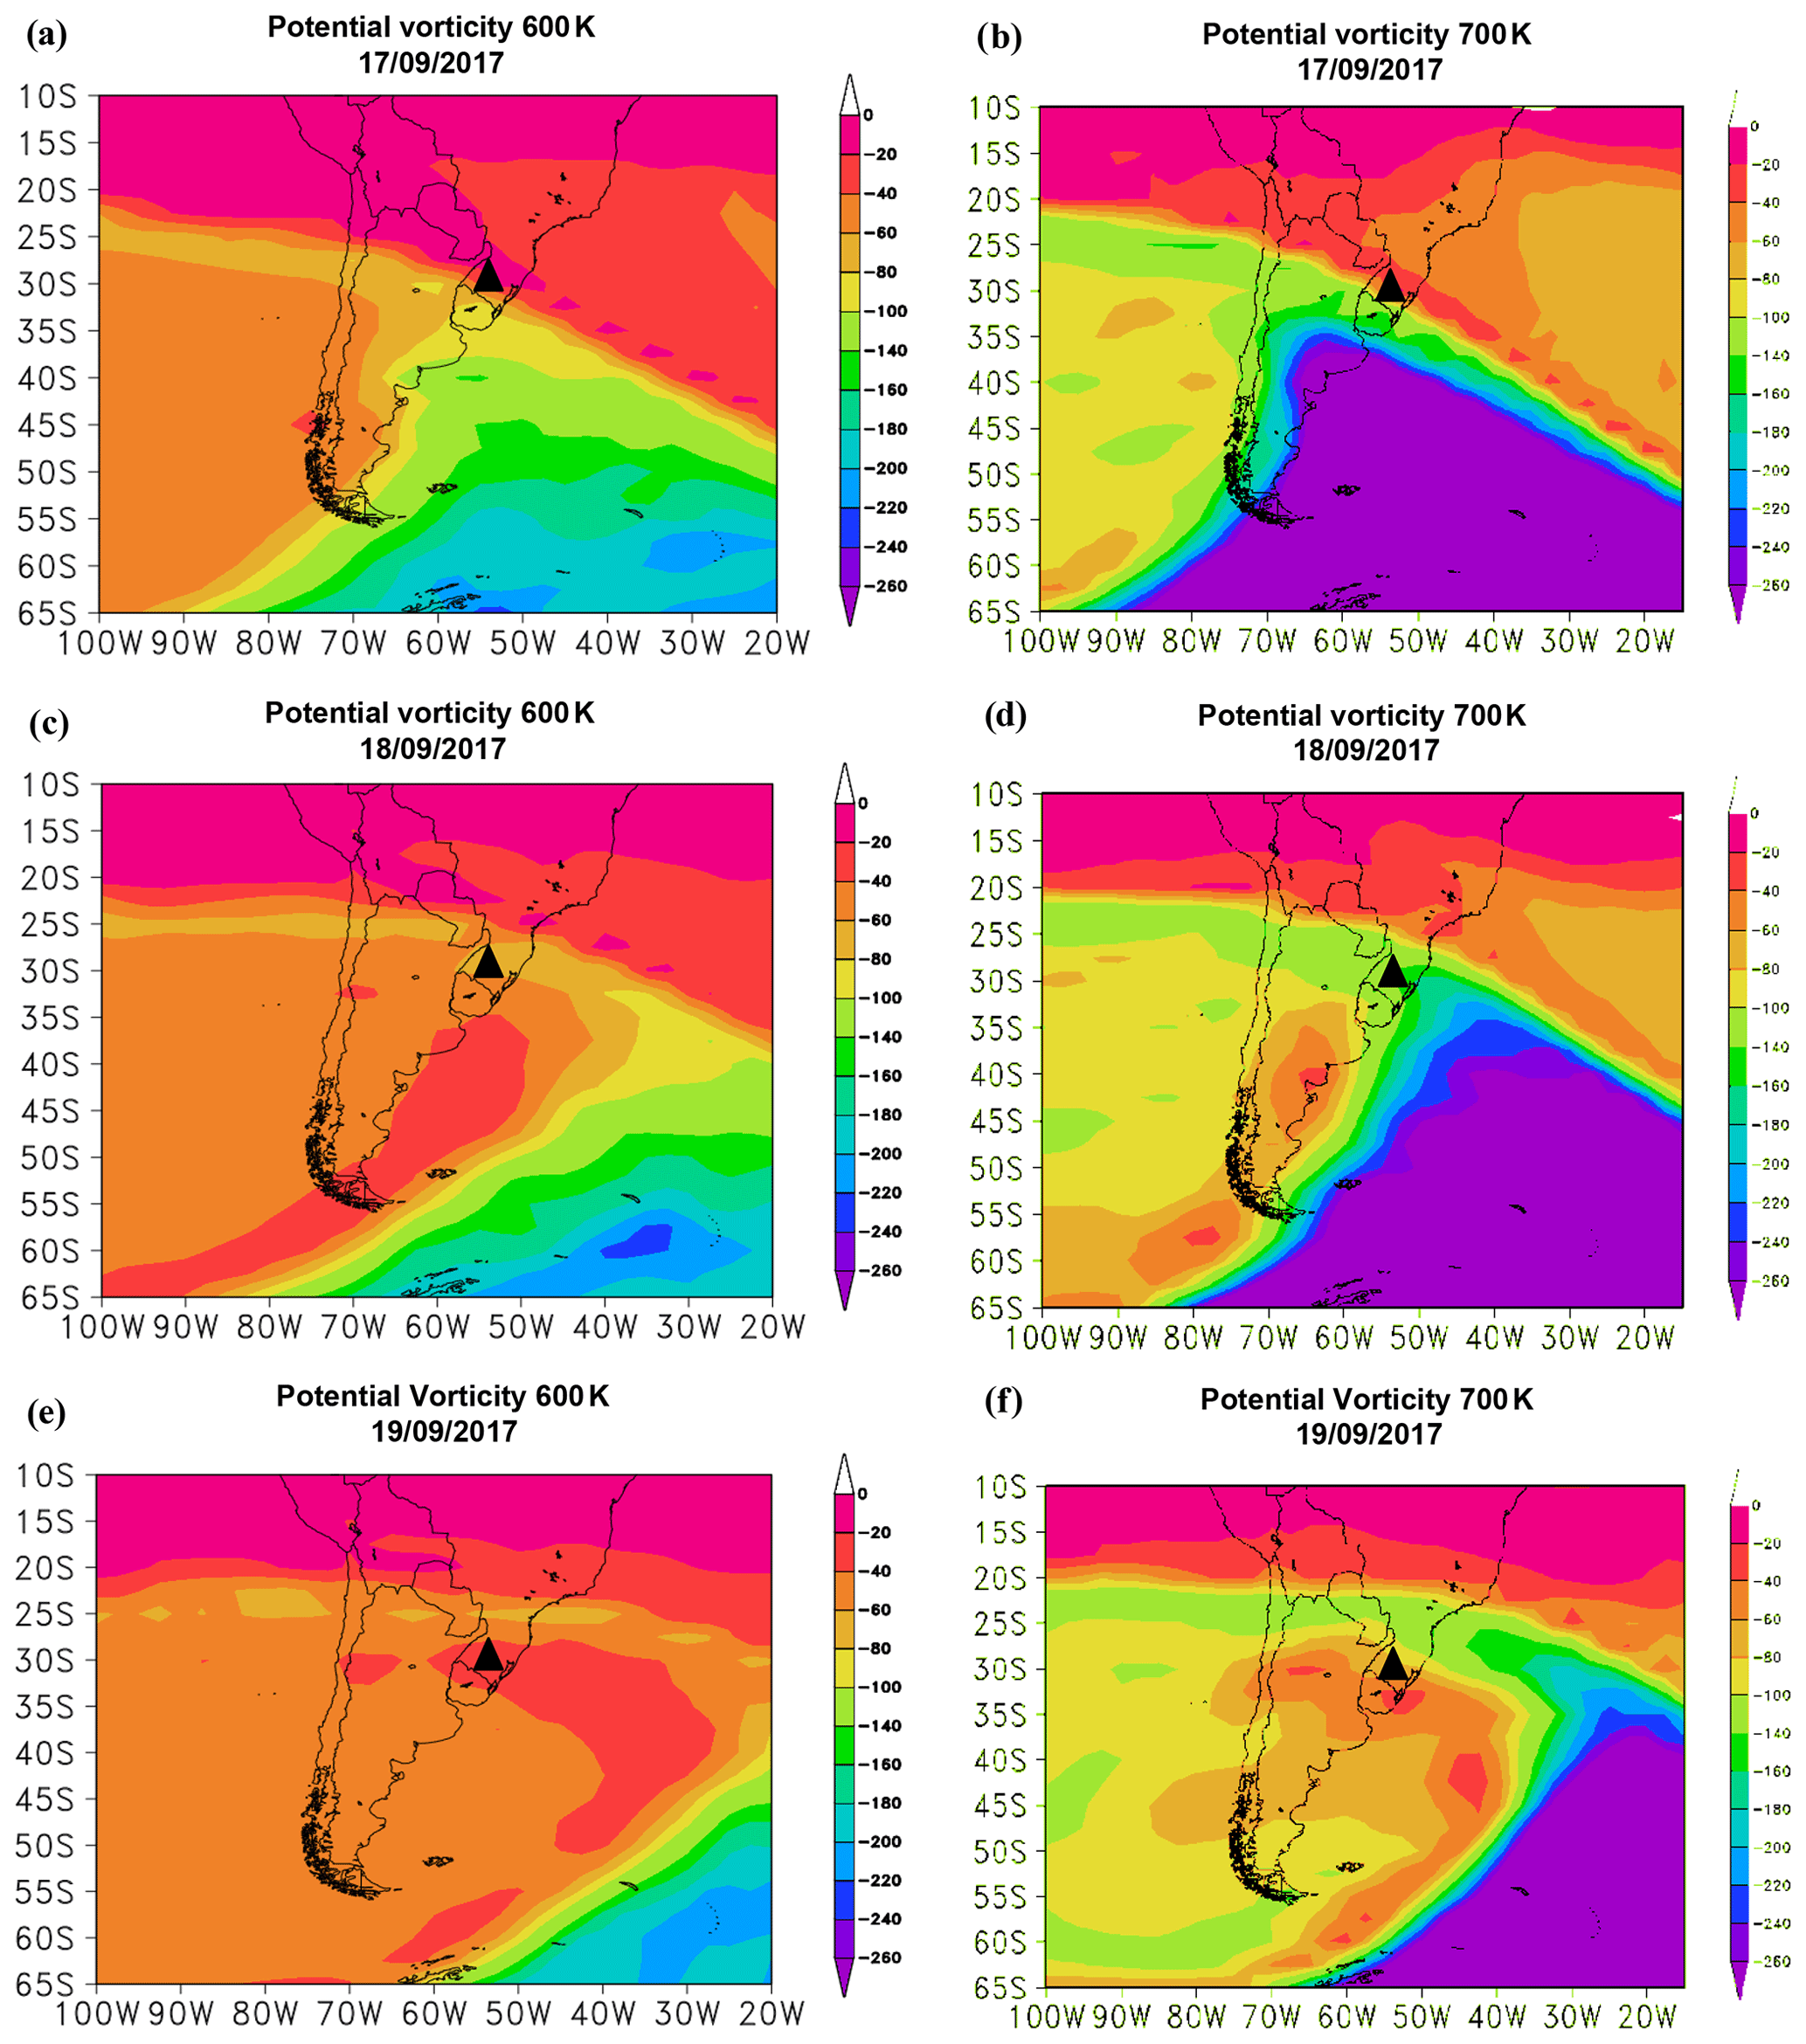
Figure 1Potential vorticity fields at the 600 and 700 K isentropic levels as derived from ECMWF data successively on (a and b) 17 September, (c and d) 18 September, and (e and f) 19 September 2017. The black symbol indicates the location of the SSO.
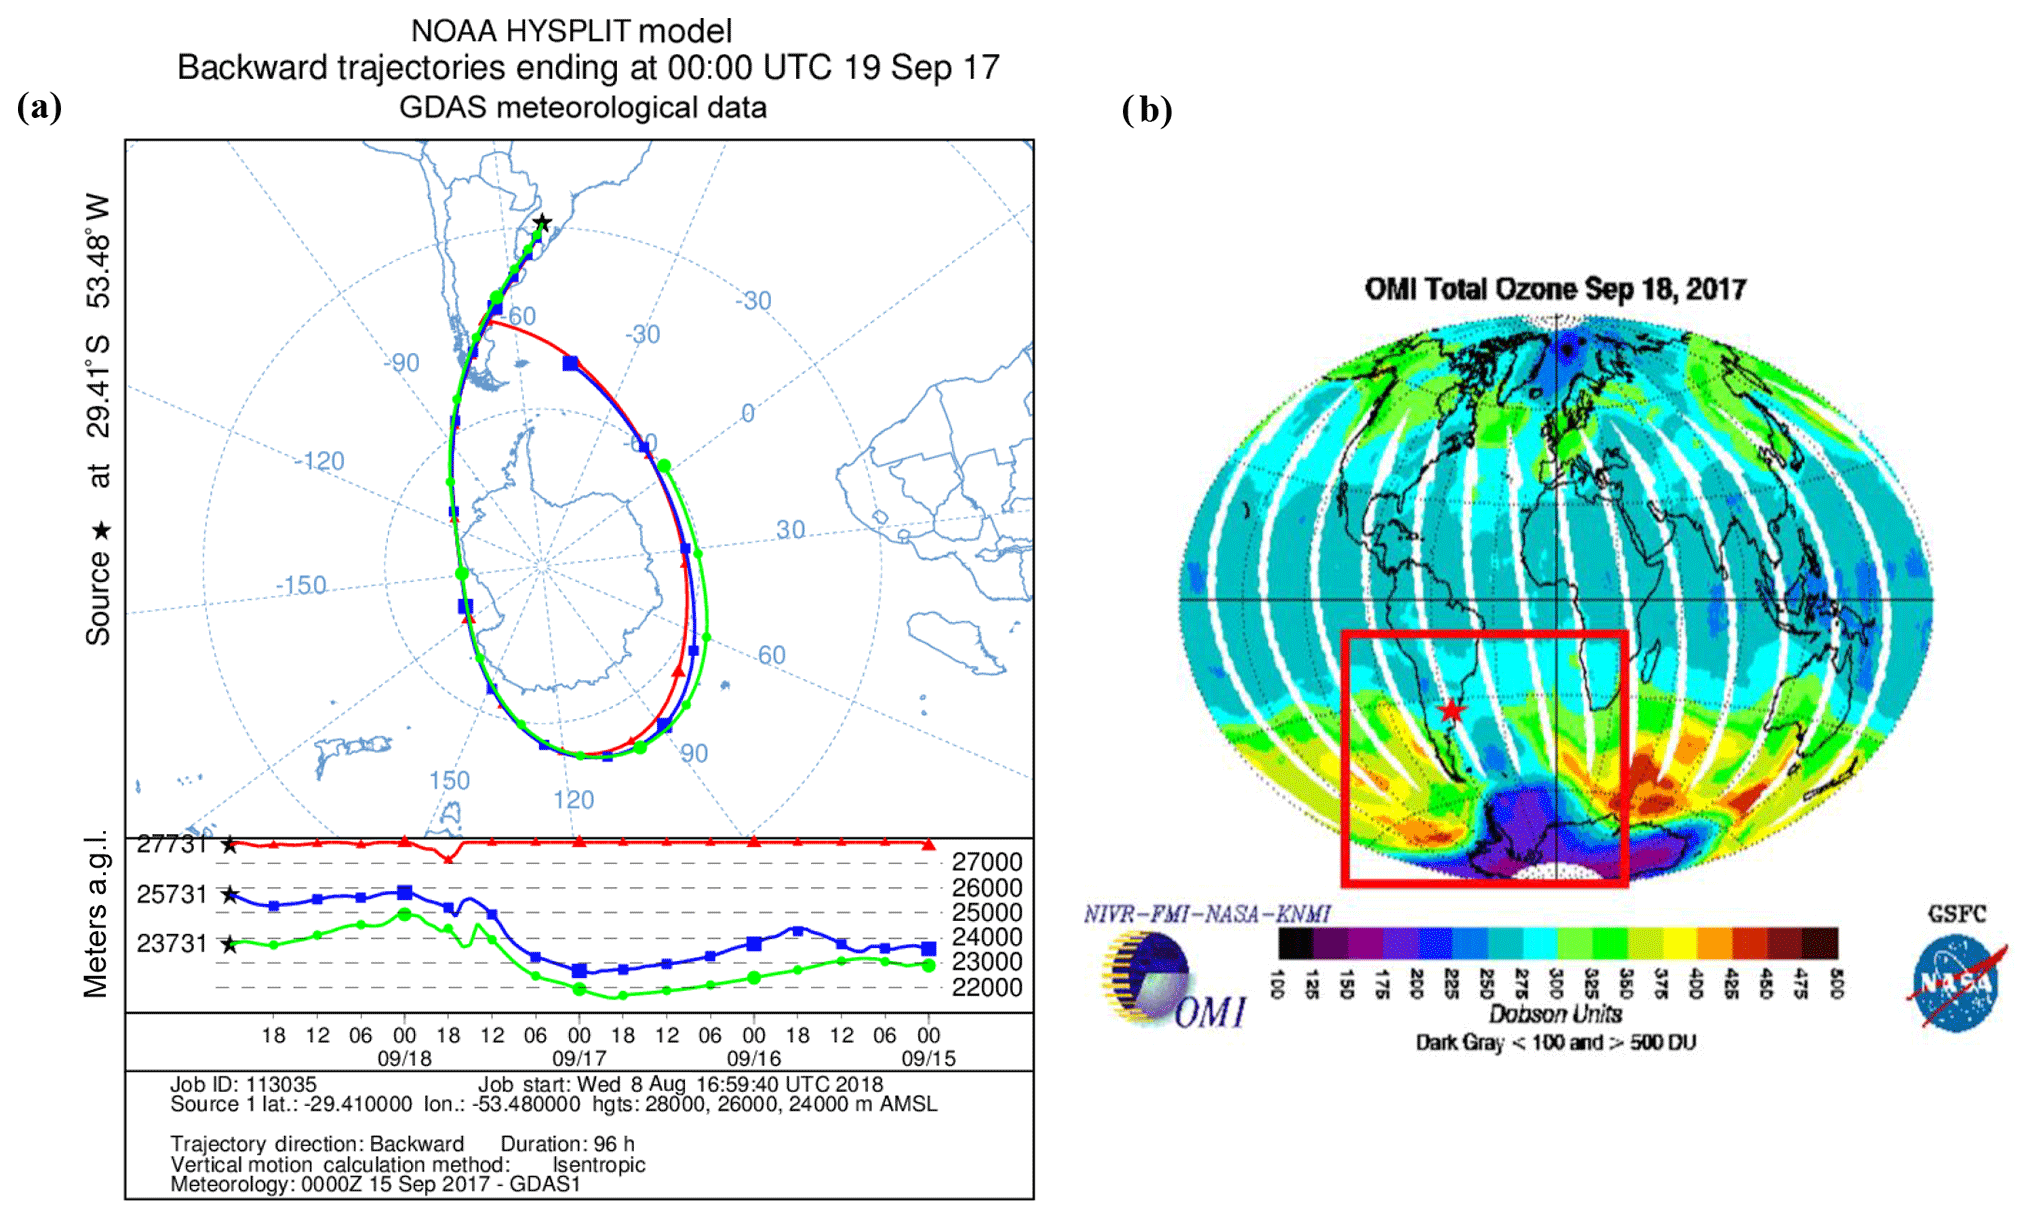
Figure 2(a) Retroactive trajectories as retrieved by the Lagrangian HYSPLIT model, initialized on 19 September 2017 00:00 UTC at the SSO location. The back-trajectories were run at 20 km (in red), 24 km (in blue), and 28 km (in green) above ground level; (b) global TOC distribution as recorded by the OMI experiment on 18 September 2017. The red box focuses on the low-ozone event and the star symbol indicates the location of the SSO site.
After the identification of the secondary effect of the AOH on the southern region of Brazil on 18 September 2018, the tropospheric dynamics were analyzed to observe how the troposphere was behaving during the occurrence of this event. Figure 3 presents the atmospheric fields used in this work for the study of tropospheric dynamics. This type of analysis was used by Bittencourt et al. (2018), where the study was done only for an extreme event of influence of AOH. In the days leading up to the confirmation of the side-effect event, the region remained unstable from 11 September 2018 until 1 d before the event, which can be explained by the isentropic tapering corresponding to a more compressed layer thickness, besides the presence of an intense temperature gradient. For the day of the event, 18 September 2018, the formation of a system of high pressure was observed in the region, which moved to the ocean in the following days. Under these circumstances, on the surface, we have a post-frontal high-pressure system near the region of interest, which may have helped to carry this O3 air mass to reach mid-latitude regions such as central southern Brazil.
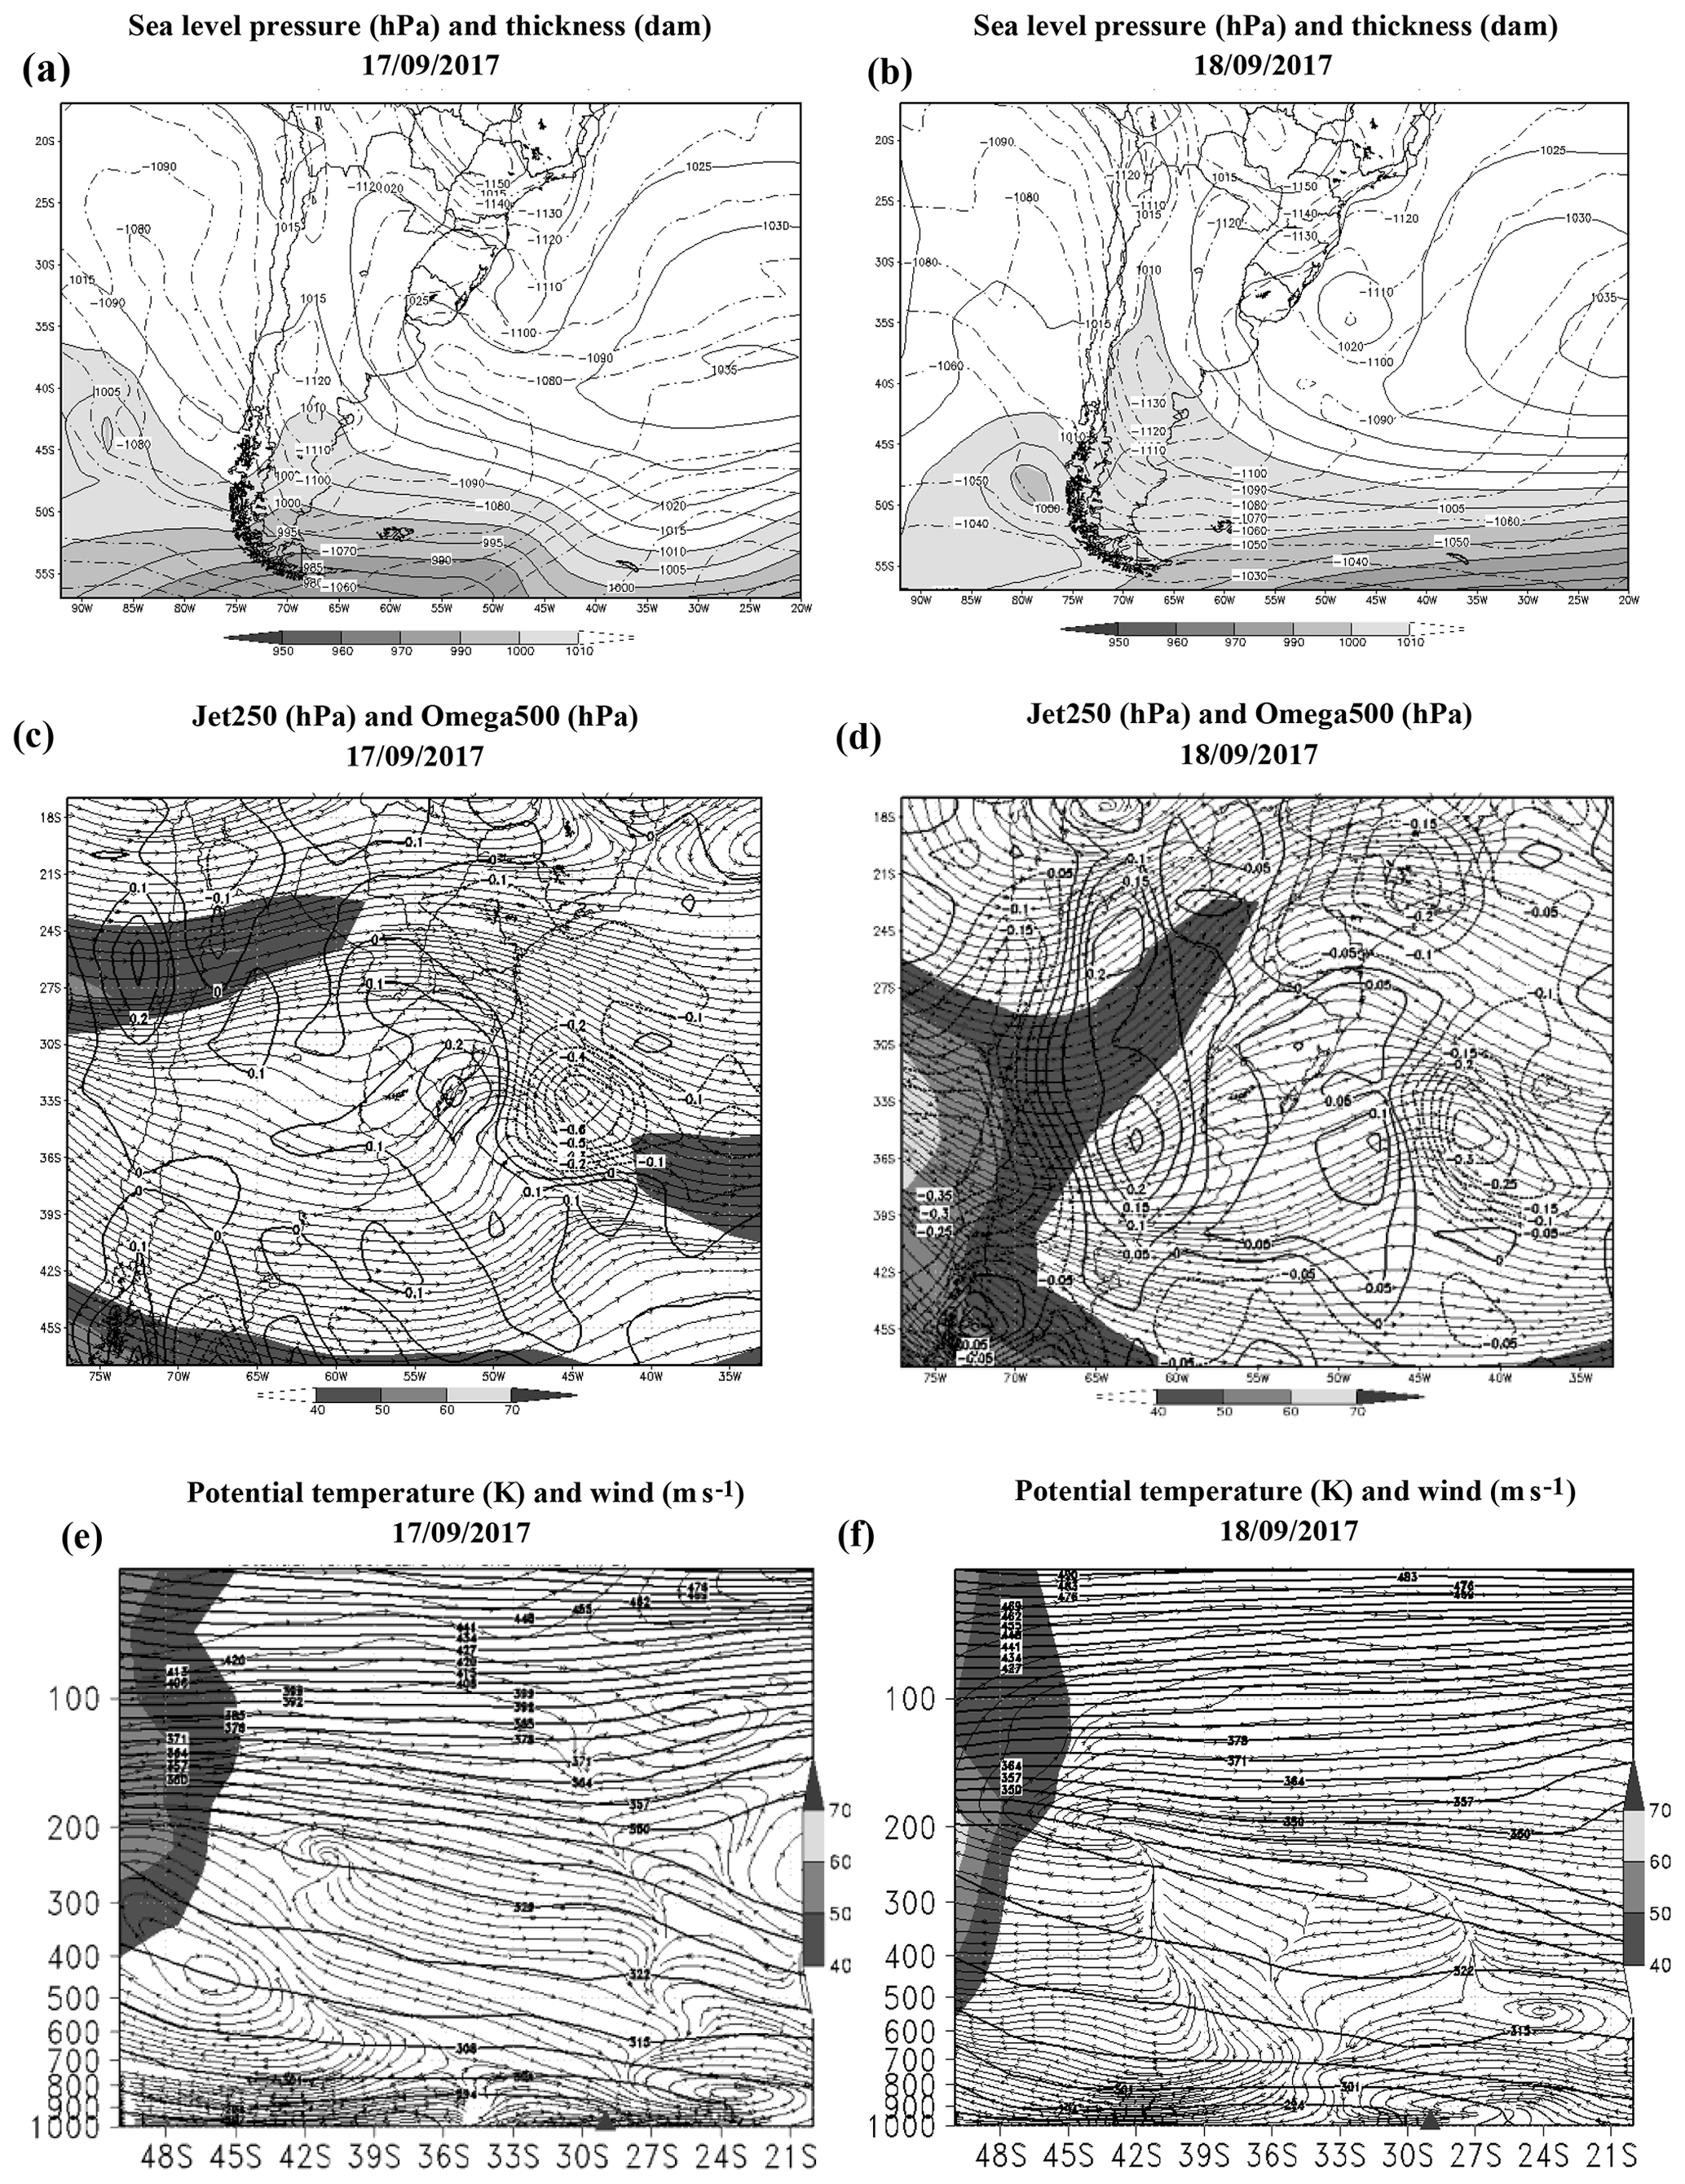
Figure 3Pressure fields at medium sea level, horizontal cut of the atmosphere, and vertical cut between 1000 and 50 hPa for (a, c, e) 17 September 2017 and (b, d, f) 18 September 2017. The red symbol indicates the location of the SSO site.
The horizontal wind and temperature fields (Fig. 3c and d) show the jet at 250 hPa and the Omega at 500 hPa, where the objective here is to identify the regions of upward and downward movement of air masses. The presence of the polar jet in southern Brazil, Argentina, and Uruguay is observed in Fig. 3c and d. Negative Omega values at 500 hPa persist throughout the period, indicating upward movement at lower levels of the atmosphere. Thus, the horizontal section of the atmosphere showed that the presence of the polar jet dominates the region until the day of the event confirmation. For this reason, the arrival of O3-poor air masses in the region may be associated with the performance of a frontal system that passed through the region days before the event was confirmed as well as the presence of the jet at higher atmospheric levels, helping in the exchanges of air from the stratosphere to the troposphere contributing to a temporary reduction in O3 content on 18 September 2018. The vertical section of the atmosphere between 1000 and 10 hPa of potential temperature and wind at 54∘ longitude (Fig. 3e and f) shows the presence of a polar jet current at higher levels of the atmosphere as well as the isentropic funnel near longitude from 30∘ S on 17 September 2018, indicating a frontal ramp which helps in the air exchange from the highest to lowest levels on the day of the event.
3.2 Statistical analyses: atmospheric dynamics
Figure 4 shows the mean field of the 37 AOH influence events identified in this work, where potential vorticity fields were used for the 700 K isentropic level, for 3 d before and up to 3 d after the event. Analyzing Fig. 4a and b, it can be observed that for −3 d the variation of potential vorticity over the region remains stable, without variation in the content of APV in the south of Brazil, with APV values between 40 and 60 PVU.
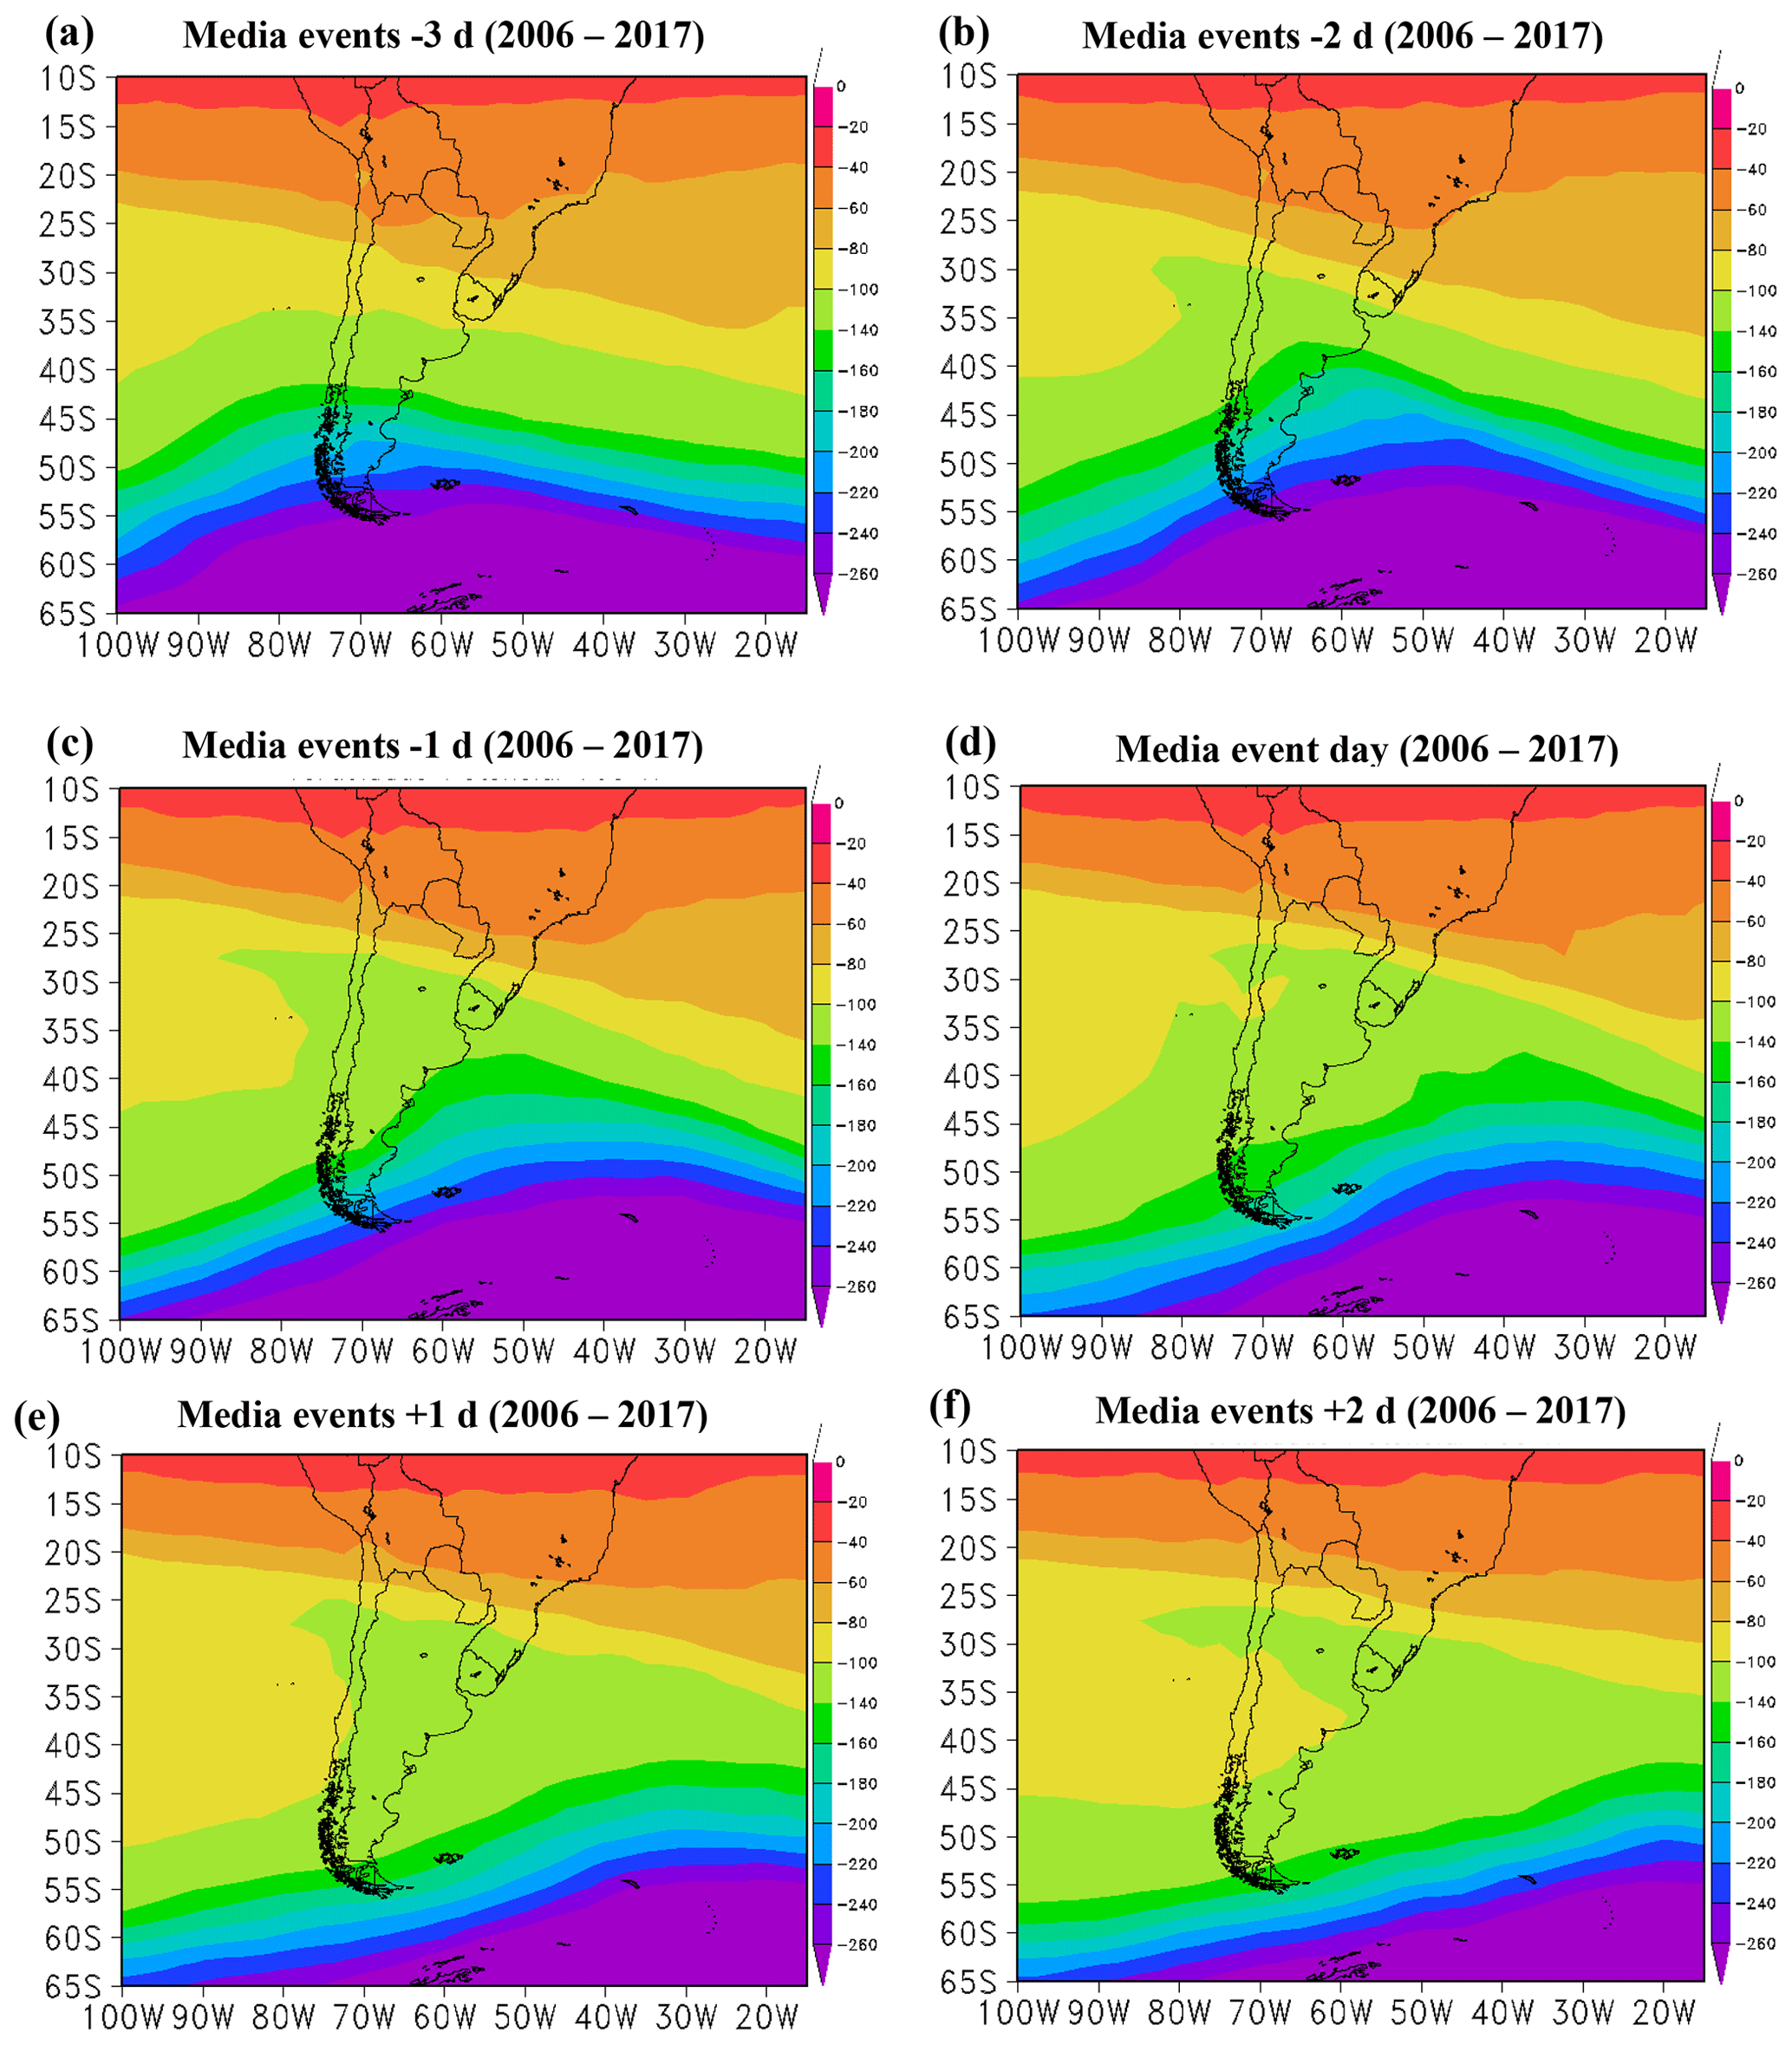
Figure 4Average PV maps at the 700 K isentropic level from 37 PV distributions detected as secondary effect events of AOH: (a) −3 d, (b) −2 d, (c) −1 d, (d) day of the event, (e) +1 d, (f) +2 d.
Already from 2 d before (−2 d) the event, Fig. 4c, we can observe a slight increase in APV values over the study region, mainly between Argentina, Uruguay, and southern Brazil with APV values from 60 to 80 PVU. From 1 d before (−1 d) the event, the increase in APV over the study region becomes more important, with APV values between 100 and 140 PVU. For the days after the event, +1 d (Fig. 4e) and +2 d (Fig. 4f), air masses with APV higher than 100 PVU bound the mid-latitude region in Chile, Argentina, Uruguay, and southern Brazil, with values up to 160 PVU. From the third day after the event, we found a decrease in APV values similar to the −2 d situation (not shown). These results indicate that during the 37 identified secondary effect events due to the AOH development, low-ozone air masses are transported from the polar region to mid-latitudes and cover a wide region over the north of Chile, Argentina, Uruguay, and southern Brazil. On average, such a low-ozone event may last and affect that sub-region during at least 4 d. This is in agreement with previous works published by Peres (2016).
Plots in Fig. 5 show the average monthly distributions of potential vorticity anomalies on the 700 K isentropic level, averaged for August, September, October, and November over the study period, 2006–2017. The PV anomaly fields show the predominance of positive potential vorticity anomalies in southern Brazil (values around 35 to 55 PVU). Figure 5a shows that in August there is a predominance of positive anomalies in southern Brazil, according to the number of events identified this month (seven events; see Table 2) in southern Brazil. November has the lowest number of low-ozone AOH events identified in the region (five events; see Table 2) and also shows the predominance of a positive anomaly in southern Brazil, with possible vorticity anomalies between 10 and 30 PVU. For the months of September and October, positive PV anomalies were very evident in the 12 years of data.
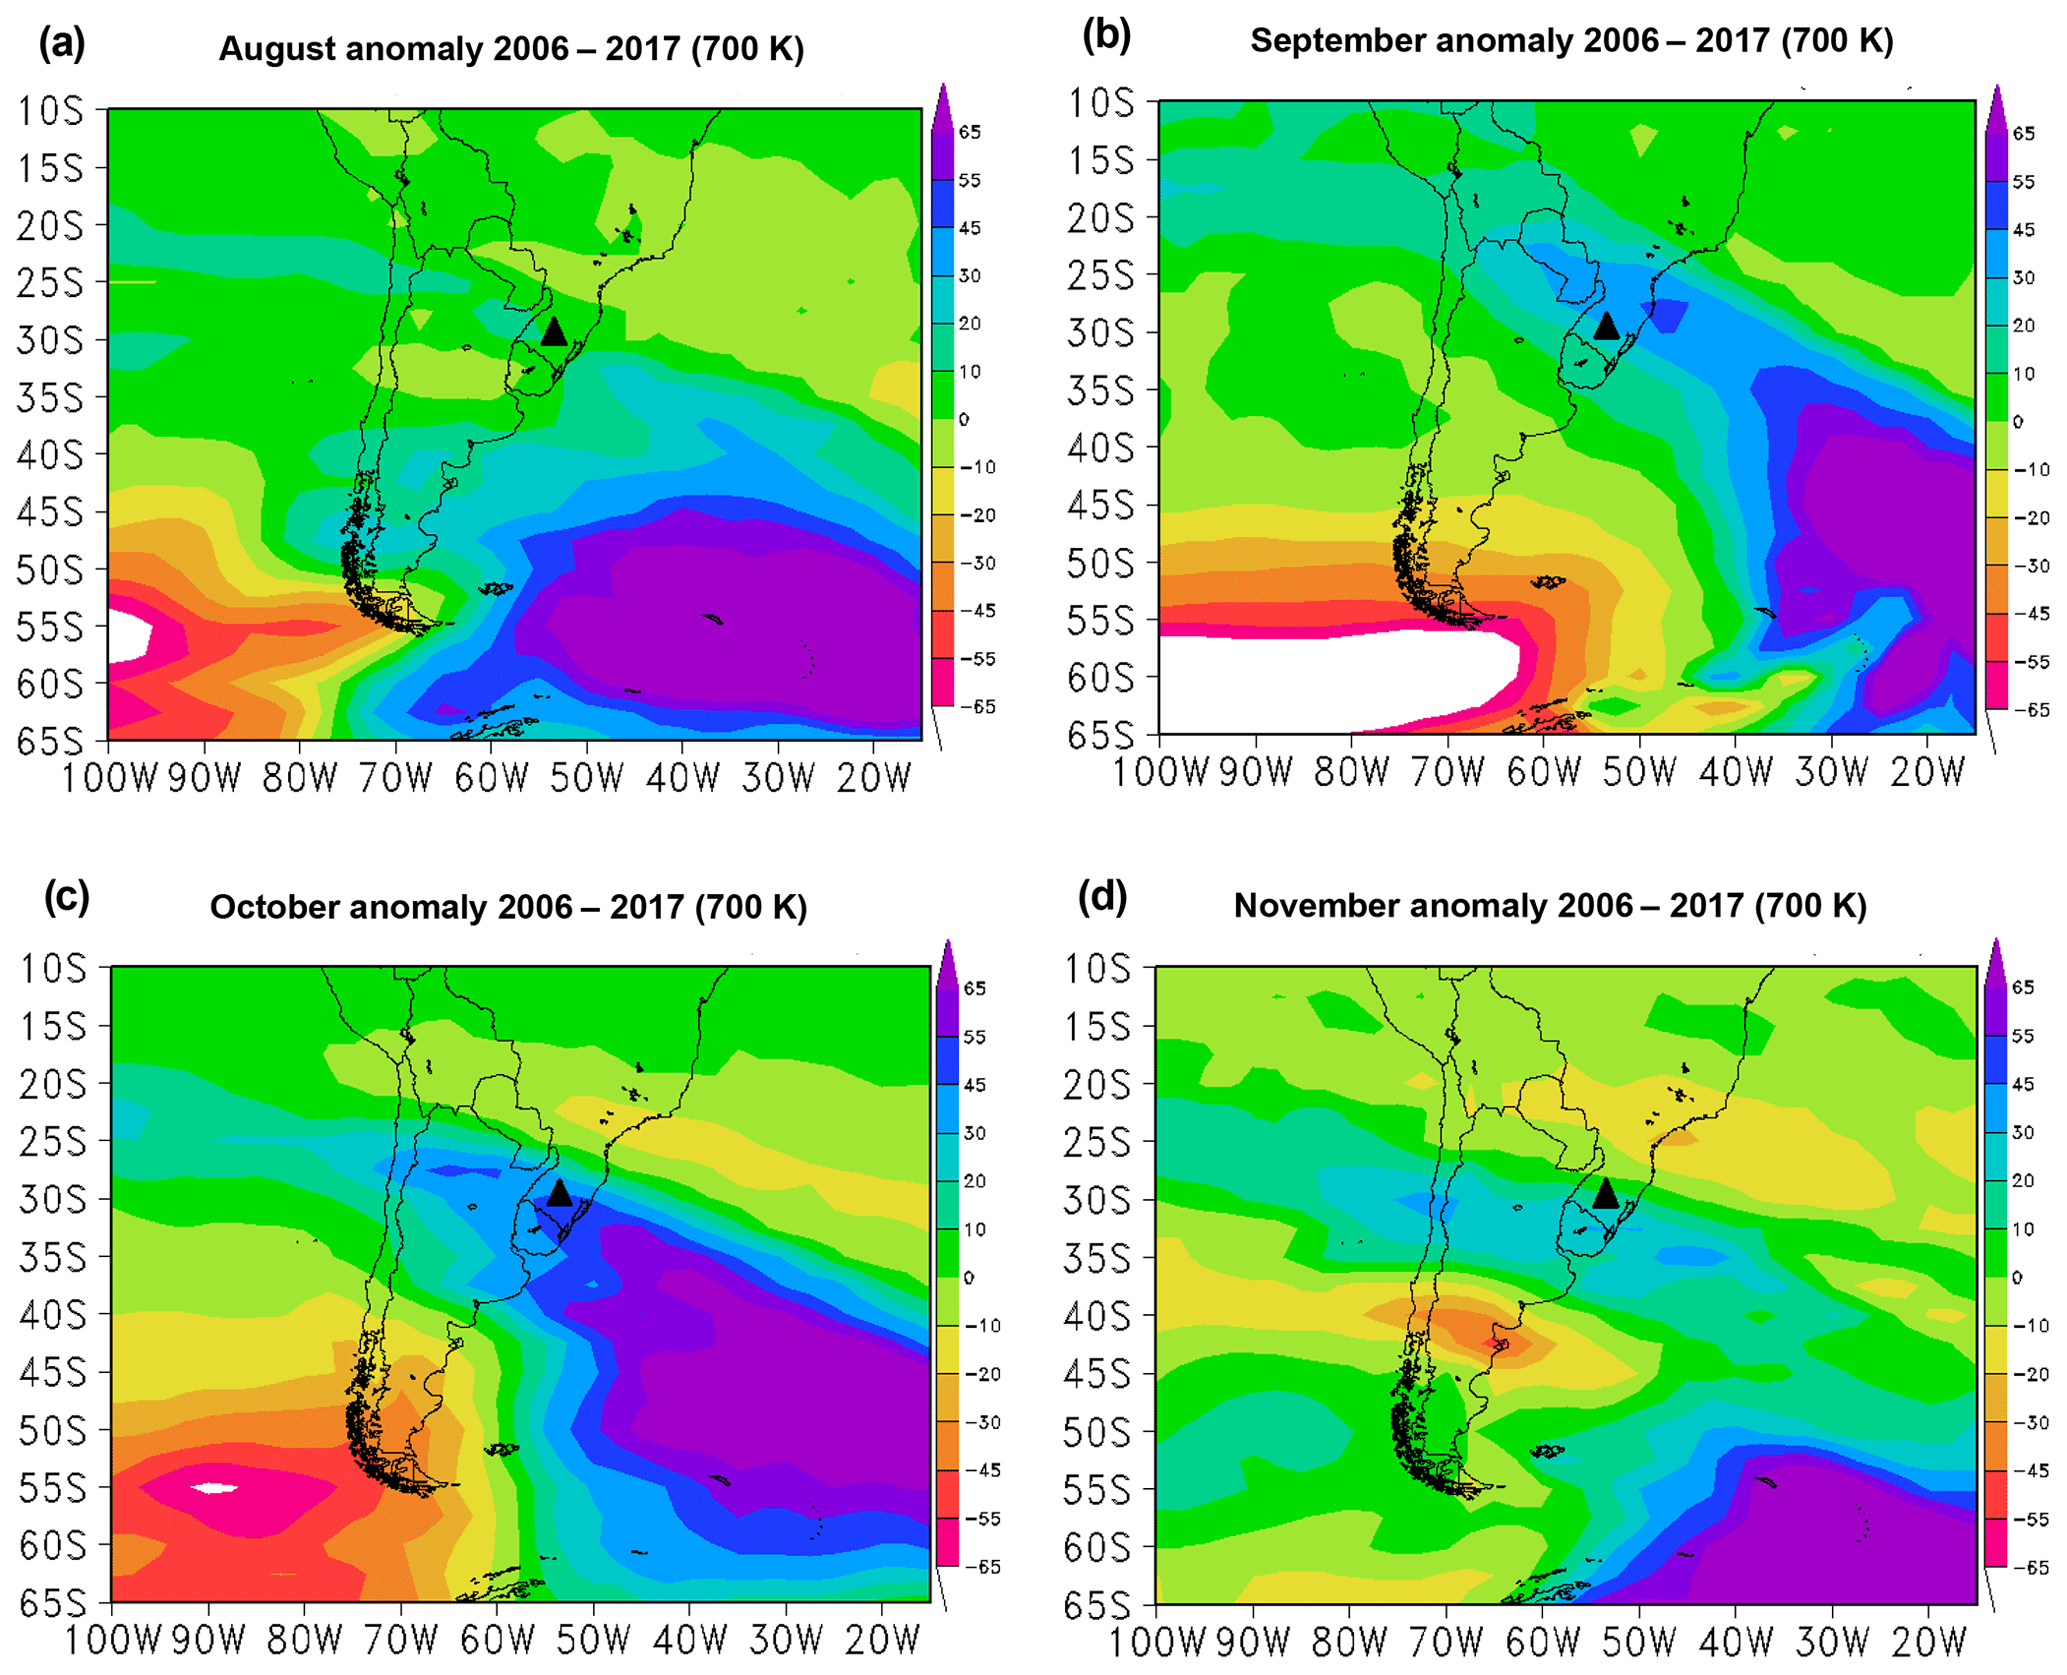
Figure 5Monthly PV anomaly fields for the period from 2006 to 2017, at the isentropic level of 700 K potential temperature.
Table 2Events of the secondary effect of the Antarctic ozone hole over southern Brazil from 2006 to 2017. Average daily TOC value and percentage of O3 reduction with respect to the climatological average of the month.
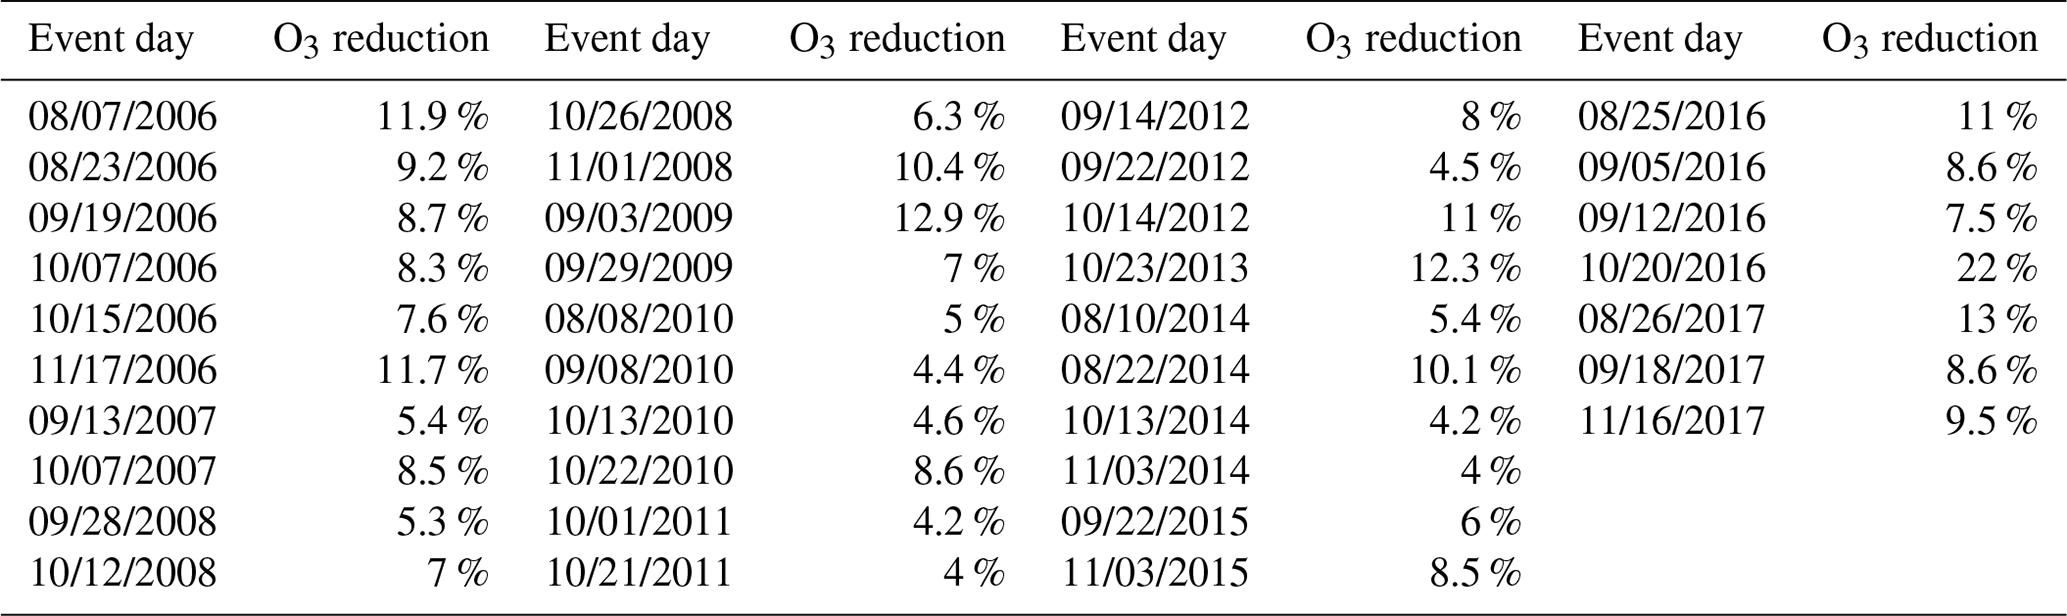
Date format: mm/dd/yyyy.
Significant increases in positive anomalies (between 10 and 50 PVU for September and from 30 to 60 PVU) are concomitant and consistent with the large number of low-ozone AOH events recorded during these months (12 events in September and 13 events in October). Physically, it is possible to confirm the importance of these months for the analysis, due to the greater number of AOH-influencing events that affect southern Brazil, as observed by Bittencourt et al. (2018), which is explained by polar filaments that are released from the ozone hole region and then bring O3 to mid-latitude regions.
For a better understanding of the tropospheric dynamics during the 37 events identified, medium fields were made for the horizontal and vertical cuts of the atmosphere. Figure 6 shows the average field for the horizontal cut (jet at 250 hPa and Omega at 500 hPa). In the mean of the 37 AOH influence events identified in this study (Table 2), the presence of the jet stream (subtropical or polar) is observed in practically all identified events. Fig. 6 confirms this where the presence of the jet stream is observed mainly in the southern region of Brazil. However, there is a predominance of a center with negative values of Omega at 500 hPa, indicating surface convergence, which explains the majority of events identified after the passage of frontal systems over the southern region of Brazil. Therefore, the jet stream is important for the vertical distribution of O3 in the atmosphere and also in air exchanges from the stratosphere to the troposphere (Bukin et al., 2011; Santos, 2016) in the southern region of Brazil.
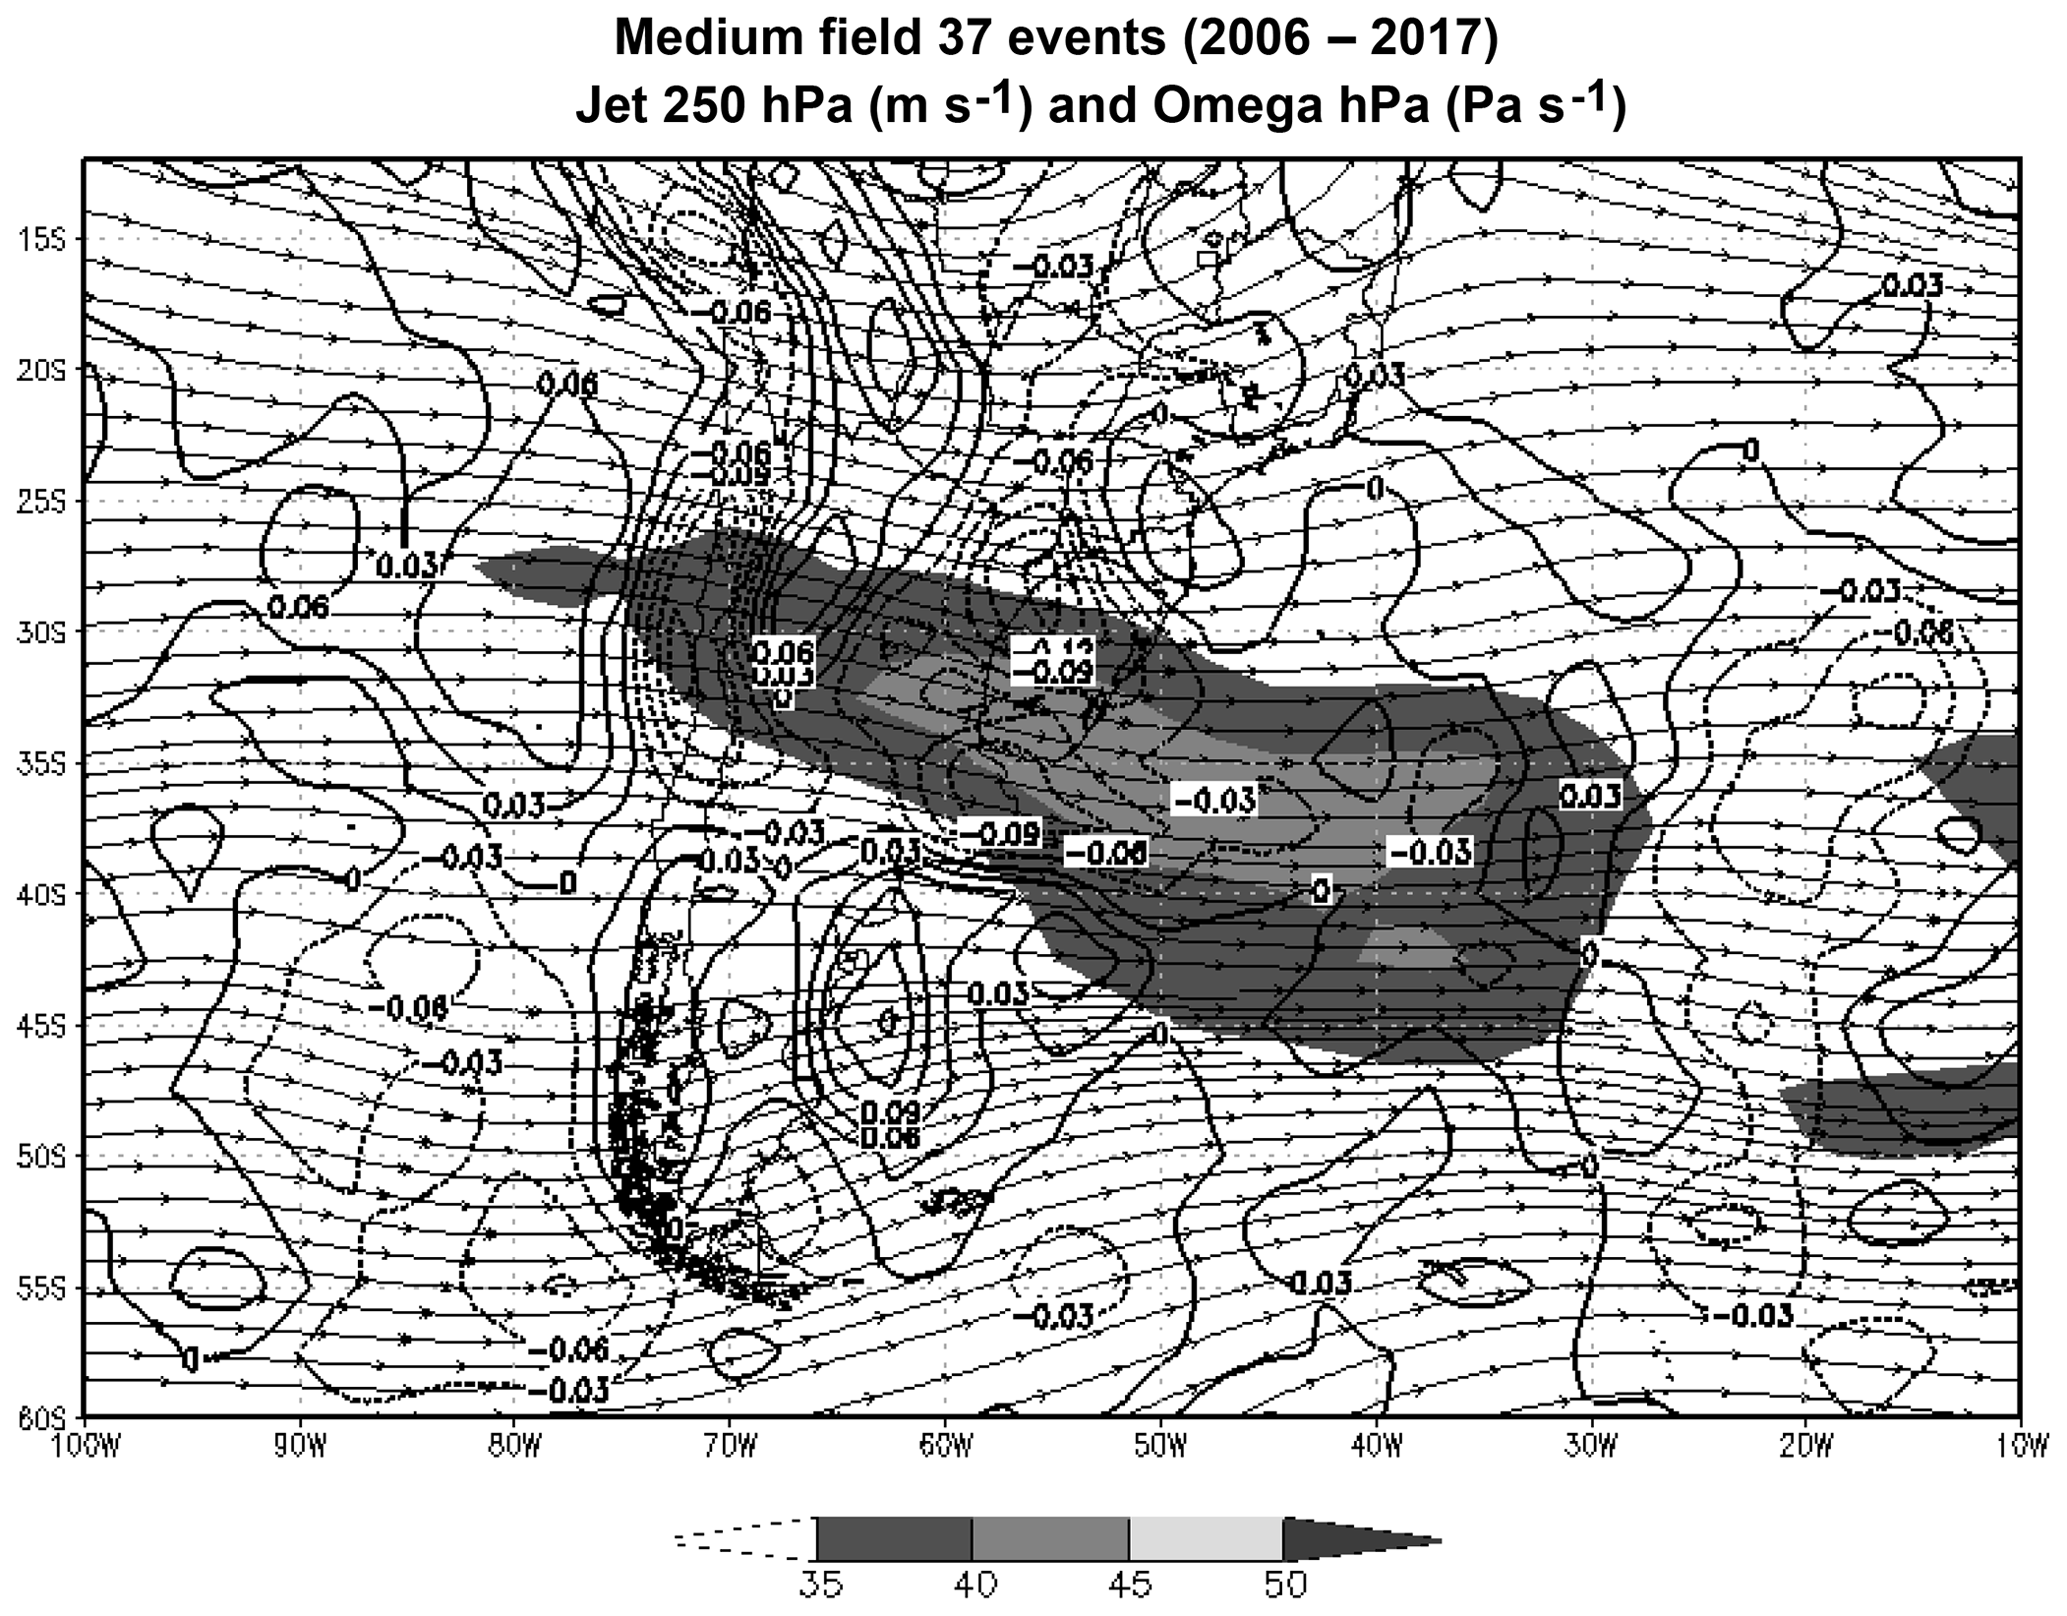
Figure 6Mean field for the 37 AOH side-effect events in the analysis period with the jet at 250 hPa (shaded) and Omega at 500 hPa (Omega positive solid lines, Omega negative dotted lines).
Finally, Fig. 7 presents the average for the 37 AOH influence events identified in southern Brazil of the vertical cut of the atmosphere between 1000 and 30 hPa. Similar to Fig. 6, the presence of the jet stream with an intense nucleus (∼45 to 50 m s−1) near the latitude and longitude of the study region, besides the presence of a jet near 30 hPa, indicates the probable presence of the polar jet current in the average of the events. However, it is confirmed that the jet stream (subtropical and/or polar, depending on the case) was also present at higher levels of the atmosphere. Therefore, analyzing the average tropospheric dynamics of the 37 events of influence of the AOH on the southern region of Brazil, the presence of the polar jet stream, at higher levels of the atmosphere, as well as the presence of the subtropical jet stream, probably explains the transport of O3-poor air masses from polar regions to mid-latitude regions like southern Brazil.
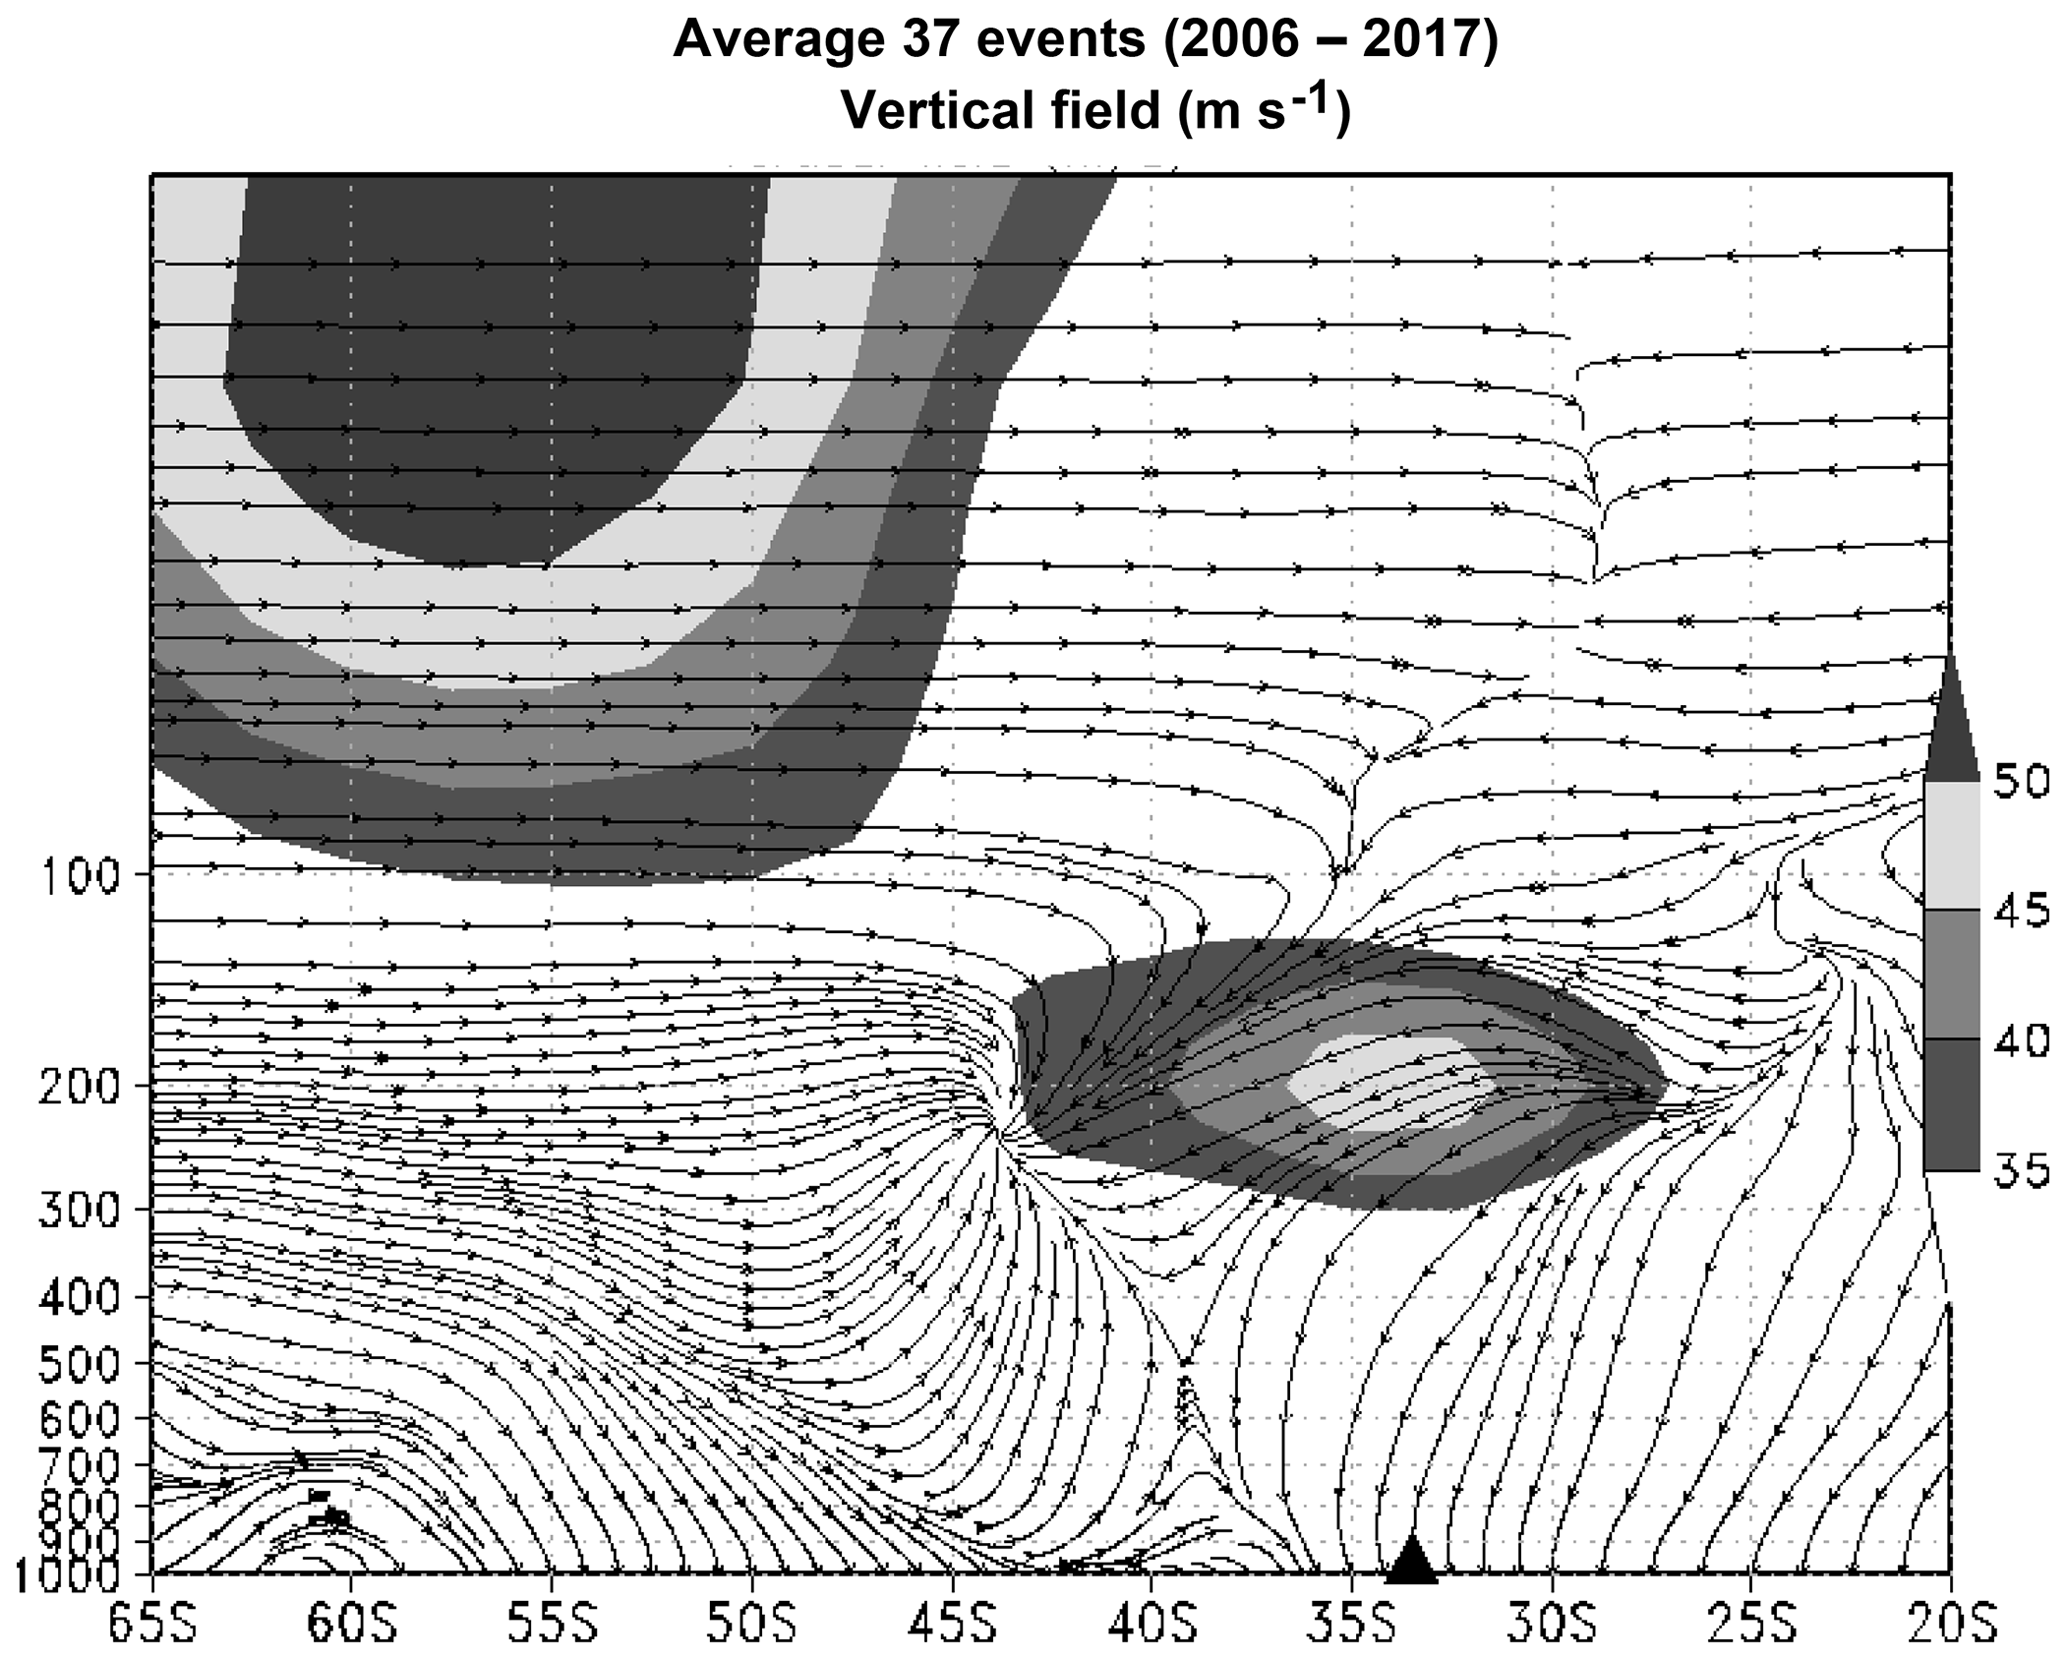
Figure 7Average for the 37 events of the vertical field between 1000 and 30 hPa, showing the jet current (shaded gray) in m s−1.
In this work, we analyzed daily TOC measured by the Brewer Spectrophotometer operational at the SSO site in the south of Brazil and by the OMI from 2006 to 2017. Analysis of TOC datasets revealed 37 low-ozone events that have occurred and extended during the austral spring period (August–September–October–November) over the SSO site. Moreover, examination of potential vorticity fields in the stratosphere (on the 700 K isentropic level) and of back-trajectories obtained by the Lagrangian HYSPLIT model showed that the 37 low-ozone events resulted from the transport of air masses from polar regions to mid-latitudes and correspond therefore to the secondary effect of the AOH. In addition, it has been shown from PV anomaly fields that the detected events have spread over a large region, covering northern Chile, Argentina, Uruguay, and southern Brazil, and they can last and affect this subregion for at least 4 d. In accordance with the period of development of the AOH and with previous published works, we found that most of the events took place in September (35 %) and October (39 %), while 17.6 % of them were identified in August and 12.7 % in November.
The analysis of tropospheric dynamics confirmed the importance of the jet as the main synoptic system that assists in the exchange of air masses between the stratosphere and the troposphere. Of the 37 events, about 92 % of the cases identified the presence of the jet stream (subtropical and/or polar); in the remaining 8 % no action of the jet stream was identified or it was weak, not assisting in the exchange of air masses. In addition, on the surface, events were identified in 70 % of cases after the passage of frontal systems in southern Brazil, which together with the performance of a high-pressure system characterized by downward stabilization of the atmosphere explains the arrival of ozone-depleting air masses from the Antarctic region that can reach the mid-latitude regions. Regarding the statistical analyses of the tropospheric fields, confirmation of the importance of the jet stream was obtained. The vertical cut of the atmosphere showed the presence of the two jet streams (polar and subtropical jet) at higher levels of the atmosphere; besides, the current lines converge to regions close to 30∘ S in the southern region of Brazil. The average fields of the 37 events identified in the region show the presence of the jet stream in relation to the horizontal cut (250 hPa) and vertical cut (1000 and 30 hPa).
The results found here highlight the importance of the jet stream actuation as the main synoptic system that supports the exchange of masses of ozone-deficient air from the stratosphere to the troposphere. It is evident that the two jet streams (subtropical and polar) act together in this exchange mechanism, possibly becoming a “connection” between the two atmospheric layers during the occurrence of events of the side effect of the AOH on the southern region of Brazil.
The ozone ground-based data obtained by the Brewer spectrophotometer at the SSO are not yet available online or at any international collaborative platform, but these data, or information about it, can be obtained by contacting the corresponding author or alternatively José Valentin Bageston (jose.bageston@inpe.br). The OMI-ERS2 satellite data are available at https://aura.gsfc.nasa.gov/omi.html (OMI, 2018).
ECMWF/ERA-Interim weather data are available online (after registration) at http://apps.ecmwf.int/datasets/data/interim-full-daily/levtype=sfc/ (ECMWF/Era-Interim, 2017).
GDB obtained the results of the work and wrote most of the paper. DKP assisted with discussions about the results as well as guidance during the study. JVB helped to improve the instrument and methodology sessions, discussed the results, and also improved the writing and grammar of the text. HB contributed to improving the text in the initial draft of the paper by making suggestions throughout the text and also helped to improve the results section. LAS contributed to the initial discussions on the results of this work. LVP supported the discussions of the results, prepared some figures, and contributed to writing the paper.
The authors declare that they have no conflict of interest.
This article is part of the special issue “7th Brazilian meeting on space geophysics and aeronomy”. It is a result of the Brazilian meeting on Space Geophysics and Aeronomy, Santa Maria/RS, Brazil, 5–9 November 2018.
This work is part of the Graduate Program in Meteorology of the Federal University of Santa Maria (UFSM) in cooperation with the Southern Regional Space Research Center of the National Institute for Space Research (CRS/INPE-MCTIC), supported by the Coordination of Improvement of Higher Education Personnel (CAPES). The authors would like to express their thanks to the CAPES/COFECUB Program, process no. 88887.130176/2017-01, and the National Institute of Antarctic Science and Technology for Environmental Research, CNPq process no. 574018/2008-5 and FAPERJ process no. E-16/170.023/2008, for the financial support. The authors are also thankful for the data provided by NASA (OMI) and daily average data provided by ECMWF/Era-Interim (2017).
This research was supported by CAPES (process no. 88882.428275/2019-01) and CAPES/COFECUB (case no. 88887.350072/2019-00).
This paper was edited by Igo Paulino and reviewed by two anonymous referees.
Antón, M., López, M., Vilaplana, J. M., Kroon, M., Mcpeters, R., Bañón, M., and Serrano, A.: Validation of OMI-TOMS and OMI-DOAS total ozone column using five Brewer spectroradiometers at the Iberian Peninsula, J. Geophys. Res.-Atmos., 114, D14307, https://doi.org/10.1029/2009JD012003, 2009.
Bencherif, H., Portafaix, T., Baray, J. L., Morel, B., Baldy, S., Leveau, J., Hauchecorne, A., Keckhut, P., Moorgawa, A., Michaelis, M. M., and Diab, R.: LIDAR observations of lower stratospheric aerosols over South Africa linked to large scale transport across the southern subtropical barrier, J. Atmos. Sol.-Terr. Phy., 65, 707–715, https://doi.org/10.1016/S1364-6826(03)00006-3, 2003.
Bencherif, H., El Amraoui, L., Semane, N., Massart, S., Charyulu, D. V., Hauchecorne, A., and Peuch, V. H.: Examination of the 2002 major warming in the southern hemisphere using ground-based and Odin/SMR assimilated data: stratospheric ozone distributions and tropic/mid-latitude exchange, Can. J. Phys., 85, 1287–1300, 2007.
Bittencourt, G. D., Bresciani, C., Kirsch Pinheiro, D., Bageston, J. V., Schuch, N. J., Bencherif, H., Leme, N. P., and Vaz Peres, L.: A major event of Antarctic ozone hole influence in southern Brazil in October 2016: an analysis of tropospheric and stratospheric dynamics, Ann. Geophys., 36, 415–424, https://doi.org/10.5194/angeo-36-415-2018, 2018.
Bresciani, C., Bittencourt, G. D., Bageston, J. V., Pinheiro, D. K., Schuch, N. J., Bencherif, H., Leme, N. P., and Peres, L. V.: Report of a large depletion in the ozone layer over southern Brazil and Uruguay by using multi-instrumental data, Ann. Geophys., 36, 405–413, https://doi.org/10.5194/angeo-36-405-2018, 2018.
Brewer, A. W.: Evidence for a world circulation provided by the measurements of helium and water vapor distribution in the stratosphere, Q. J. Roy. Meteor. Soc., 75, 351–363, 1949.
Brewer Manual: available at: http://kippzonen-brewer.com/wp-content/uploads/2014/10/KippZonen_Operators_Manual_Brewer_MKIII_V1206-1.pdf, last access: 22 September 2019.
Brewer Models: available at: http://kippzonen-brewer.com/about-brewer/history-brewer/, last access: 22 September 2019.
Brewer Website: available at: https://www.esrl.noaa.gov/gmd/grad/neubrew/MkIV.jsp, last access: 22 September 2019.
Bukin, O. A., Suan, A. N., Pavlov, A. N., Stolyarchuk, S. Y., and Shmirko, K. A.: Effect that Jet Streams Have on the Vertical Ozone Distribution and Characteristics of Tropopause Inversion Layer, Izv. Atmos. Ocean. Phy., 47, 610–618, 2011.
Casiccia, C., Zamorano, F., and Hernandez, A.: Erythemal irradiance at the Magellan's region and Antarctic ozone hole 1999–2005, Atmosphere, 21, 1–12, 2008.
Chubachi, S.: Preliminary result of ozone observations at Syowa Station from February, 1982 to January, 1983, Mem. Natl. Inst. Polar Res. Jpn. Spec., 34, 13–20, 1984.
Dee, D. P., Uppala, S. M., Simmons, A. J., Berrisford, P., Poli, P., Kobayashi, S., Andrae, U., Balmaseda, M. A., Balsamo, G., Bauer, P., Bechtold, P., Van De Berg, L., Bidlot, J., Bormann, N., Delsol, C., Dragani, R., and Fuentes, M.: The ERA-Interim reanalysis: configuration and performance of the data assimilation system, Q. J. Roy. Meteor. Soc., 137, 553–597, https://doi.org/10.1002/qj.828, 2011.
Dobson, G. M. B.: Forty years research on atmospheric ozone at Oxford: A history, Appl. Optics, 7, 387–405, 1968.
ECMWF/Era-Interim: available at: http://apps.ecmwf.int/datasets/data/interim-full-daily/levtype=sfc (last access: 24 November 2018), 2017.
Farman, J. C., Gardiner, B. G., and Shanklin, J. D.: Large losses of total ozone in Antarctica reveal seasonal ClOx∕NOx interaction, Nature, 315, 207–210, 1985.
Fioletov, V. E., Kerr, J. B., Mcelroy, C. T., Wardle, D. I., Savastiouk, V., and Grajnar, T. S.: The Brewer reference triad, Geophys. Res. Lett., 32, L20805, https://doi.org/10.1029/2005GL024244, 2005.
Gettelman, A., Hoor, P., Pan, L. L., Randel, W. J., Hegglin, M. I., and Birner, T.: The Extratropical Upper Troposphere and Lower Stratosphere, Rev. Geophys., 49, RG3003, https://doi.org/10.1029/2011RG000355, 2011.
Guarnieri, R. A., Padilha, L. F., Guarnieri, F. L., Echer, E., Makita, K., Pine, D. K., Schuch, A. M., Boeira, L. S., and Schuch, N. J.: A Study Of The Anticorrelations Between Ozone And UV-B Radiation Using Linear And Exponential Fits In Southern Brazil, Adv. Space Res., 34, 764–768, 2004.
Hendrick, F., Pommereau, J.-P., Goutail, F., Evans, R. D., Ionov, D., Pazmino, A., Kyrö, E., Held, G., Eriksen, P., Dorokhov, V., Gil, M., and Van Roozendael, M.: NDACC/SAOZ UV-visible total ozone measurements: improved retrieval and comparison with correlative ground-based and satellite observations, Atmos. Chem. Phys., 11, 5975–5995, https://doi.org/10.5194/acp-11-5975-2011, 2011.
Hofmann, D. J., Oltmans, S. J., Harris, J. M., Johnson, B. J., and Lathrop, J. A.: Ten years of ozone sonde measurements at the South Pole: Implications for recovery of springtime Antarctic ozone, J. Geophys. Res.-Atmos., 102, 8931–8943, 1997.
Hoskins, B. J., Mcintyre, M. E., and Robertson, A. W.: On the use and significance of isentropic potential vorticity maps, Q. J. Roy. Meteor. Soc., 111, 877–946, 1985.
HYSPLIT: Hybrid Single Particle Lagrangian Integrated Trajectory, NOAA, available at: https://ready.arl.noaa.gov/HYSPLIT.php, last access: 15 May 2019.
Keckhut, P., Hauchecorne, A., Blanot, L., Hocke, K., Godin-Beekmann, S., Bertaux, J.-L., Barrot, G., Kyrölä, E., van Gijsel, J. A. E., and Pazmino, A.: Mid-latitude ozone monitoring with the GOMOS-ENVISAT experiment version 5: the noise issue, Atmos. Chem. Phys., 10, 11839–11849, https://doi.org/10.5194/acp-10-11839-2010, 2010.
Kerr, J. B.: New methodology for deriving total ozone and other atmospheric variables from Brewer spectrometer direct Sun spectra, J. Geophys. Res., 107, 4731, https://doi.org/10.1029/2001JD001227, 2002.
Kirchhoff, V. W. J. H., Schuch, N. J., Pinheiro, D. K., and Harris, J. M.: Evidence for an ozone hole perturbation at 30∘ south, Atmos. Environ., 33, 1481–1488, 1996.
Levelt, P., Oord, G. H. J., Dobber, M., Mälkki, A., Visser, H., Vries, J., Stammes, P., Lundell, J., and Saari, H.: The Ozone Monitoring Instrument, IEEE T. Geosci. Remote Sens., 44, 1093–1101, https://doi.org/10.1109/TGRS.2006.872333, 2006.
London, J.: Observed distribution of atmospheric ozone and its variations, in: Ozone in the free atmosphere, edited by: Whitten, R. C. and Prasad, S. S., New York, Van Nostrand Reinhold, chap. 1, 11–80, 1985.
Marchand, M., Bekki, S., Pazmino, A., Lefèvre, F., Godin-Beekmann, S., and Hauchecorne, A.: Model simulations of the impact of the 2002 Antarctic ozone hole on mid-latitudes, J. Atmos. Sci., 62, 871–884, 2005.
NASA website: available at: https://www.nasa.gov/centers/goddard/news/topstory/2007/toms_end.html, last access: 5 October 2018.
Ohring, G., Bojkov, R. D., Bolle, H. J., Hudson, R. D., and Volkert, H.: Radiation and ozone: Catalysts for advancing international atmospheric science programs for over half a century, B. Am. Meteorol. Soc., 90, 1669–1681, https://doi.org/10.1016/j.srt.2010.03.004, 2010.
OMI: OMI-ERS2/NASA – AURA Validation Data Center: available at: https://avdc.gsfc.nasa.gov/index.php?site=1593048672&id=28 (last access: 8 November 2018.
Peres, L. V., Reis, N. C. S. Dos., Santos, L. O., Bittencourt, G. D., Schuch, A. P., Anabor, V., Pinheiro, D. K., Schuch, N. J., and Leme, N. M. P.: Atmospheric Analysis of the Events of Secondary Effect of the Antarctic Ozone Hole on Southern Brazil in 2012. Part 2: Synoptic Verification of the Troposphere during the events, Science and Nature, 36, 423–433, 2014.
Peres, L. V., Pinheiro, D. K., Steffenel, L. A., Mendes, D., Bageston, J. V., Bittencourt, G. D., Schuch, A. P., Anabor, V., Leme, N. M. P., Schuch, N. J., and Bencherif, H.: Long-term Monitoring and Climatology of Stratospheric Fields when Antarctic Ozone Hole Influence Events Occur in Southern Brazil, Brazilian Journal of Meteorology, 34, 151–163, 2019.
Peres, V. L.: Monitoring of the total ozone column and the occurrence of events of influence of the Antarctic Ozone Hole over the South of Brazil, Doctoral thesis, available at: https://repositorio.ufsm.br/bitstream/handle/1/12621/TES_PPGMETEOROLOGIA_2016_PERES_LUCAS.pdf?sequence=1&isAllowed=y (last access: 18 November 2019), 2016.
Ploeger, F., Konopka, P., Mueller, R., Fueglistaler, S., Schmidt, T., Manners, J. C., Grooss, J. U., Guenther, G., Forster, P. M., and Riese, M.: Horizontal transport affecting trace gas seasonality in the Tropical Tropopause Layer (TTL), J. Geophys. Res.-Atmos., 117, D09303, https://doi.org/10.1029/2011JD017267, 2012.
Reboita, M. S., Gan, M. A., Rocha, R. P., and Ambrizzi, T.: Regimes of precipitation in South America: A Bibliographical Review, B. J. Met., 25, 185–204, 2010.
Rolph, G., Stein, A., and Stunder, B.: Real-time Environmental Applications and Display sYstem: READY, Environ. Modell. Softw., 95, 210–228, https://doi.org/10.1016/j.envsoft.2017.06.025, 2017.
Salby, M. L.: Fund. Atmos. Phys. International geophysics series, Vol. 61, Academic Press, 1996.
Santos, L. O.: Stratosphere Exchange – Troposphere and its Influence on Ozone Content in the Central Region of Rio Grande do Sul, Master's Dissertation, available at: https://repositorio.ufsm.br/bitstream/handle/1/10289/SANTOS%2C%20LETICIA%20DE%20OLIVEIRA%20DOS.pdf?sequence=1&isAllowed=y (last access: 19 November 2019), 2016.
Schoeberl, M. R.: Reconstruction of the constituent distribution and trends in the Antarctic polar vortex from ER-2 flight observations, J. Geophys. Res., 94, 16815–16845, 1989.
Schuch, P. A., Santos, M. B., Lipinski, V. M., Peres, L. V., San-Tos, C. P., Cechin, S. Z., Schuch, N. J., Pinheiro, D. K., and Loreto, E. L. S.: Identification of influential events concerning the Antarctic ozone hole over southern Brazil and the biological effects induced by UVB and UVA radiation in an endemic tree frog species, Ecotox. Environ. Safe., 118, 190–198, https://doi.org/10.1016/j.ecoenv.2015.04.029, 2015.
SCI TEC: Brewer ozone spectrophotometer, Acceptance manual, Doc. AM-BA-C05-Rev C, SCI TEC Instruments, Seoul, 1988.
Seinfeld, J. H. and Pandis, S. N.: From Air Pollution to Climate Change, Atmos. Chem. Phys., 3rd Edn., John Wiley and Sons, Inc., 2016.
Semane, N., Bencherif, H., Morel, B., Hauchecorne, A., and Diab, R. D.: An unusual stratospheric ozone decrease in the Southern Hemisphere subtropics linked to isentropic air-mass transport as observed over Irene (25.5∘ S, 28.1∘ E) in mid-May 2002, Atmos. Chem. Phys., 6, 1927–1936, https://doi.org/10.5194/acp-6-1927-2006, 2006.
Solomon, S.: Stratospheric ozone depletion: A review of concepts and history, Rev. Geophys., 37, 275–316, 1999.
Solomon, S., Ivy, D. J., Kinnison, D., Mills, M. J., Neely, R. R., and Schmidt, A.: Emergence of healing in the Antarctic ozone layer, Science, 353, 269–274, https://doi.org/10.1126/science.aae0061, 2016.
Vanicek, K.: Calibration history of the ozone spectrophotometers operated at the Solar and Ozone Observatory of CHMI in Hradec Kralove, Czech Republic, Publication of the Czech Hydrometeorological Institute, ISBN 80-86690-08-3, Prague, 2003.
Wilks, D. S.: Theoretical probability distributions, in: Statistical methods in the atmospheric sciences, Academic Press, San Diego, 102–104, 2006.
WMO (World Meteorological Organization), Scientific Assessment of Ozone Depletion: 2014, World Meteorological Organization, Global Ozone Research and Monitoring Project-Report No. 55, 416 pp., Geneva, Switzerland, 2014.
WMO (World Meteorological Organization), Scientific Assessment of Ozone Depletion: 2018, Global Ozone Research and Monitoring Project – Report No. 58, 588 pp., Geneva, Switzerland, 2018.