the Creative Commons Attribution 4.0 License.
the Creative Commons Attribution 4.0 License.
 | 10 Jul 2018
Measurements of vertical electric field in a thunderstorm in a Chinese inland plateau
Tinglong Zhang
Hai Yu
Fangcong Zhou
Jie Chen
Maohua Zhang
A balloon-borne instrument was designed to measure the electric field in thunderstorms. One case of thunderstorm was observed in the Pingliang region (35.57∘ N, 106.59∘ E; and 1620 m above sea level, a.s.l.) of a Chinese inland plateau, through penetration by the balloon-borne sounding in the early period of the mature stage. Results showed that the sounding passed through seven predominant charge regions. A negative charge region with a depth of 800 m located near the surface, and a positive charge region appeared in the warm cloud region; their mean charge densities were −0.44 ± 0.136 and 0.43 ± 0.103 nC m−3, respectively. Five charge regions existed in the region colder than 0 ∘C, and charge polarity alternated in a vertical direction with a positive charge at the lowest region. The mean charge densities for these five regions were 0.40±0.037 nC m−3 (−9.5 to −4 ∘C), nC m−3 (−18 to −14 ∘C), 0.35±0.063 nC m−3 (−27 to −18 ∘C), nC m−3 (−34 to −27 ∘C), and 0.24±0.06 nC m−3 (−38 to −34 ∘C). We speculated that the two independent positive charge regions in the lower portion are the same charge region with a weak charge density layer in the middle. The analysis showed that the real charge structure of the thunderstorm is more complex than the tripole model, and the lower dipole is the most intensive charge region in the thunderstorm.
Keywords. Meteorology and atmospheric dynamics (atmospheric electricity)


At the beginning of the 20th century, based on the observation of a field mill instrument, Wilson (1929) proposed that the charge structure of a thunderstorm is a positive dipole, i.e., a main positive charge region is located upon a main negative charge region in a thunderstorm. By using E field soundings, Simpson and Scrase (1937), and Simpson and Robison (1941) proposed a tripole charge structure, namely a negative charge region that exists in the middle with two positive charge regions at the upper and lower parts, and this model was accepted widely. More studies confirmed the existence of a lower positive charge center (LPCC) in thunderstorms (MacCready and Proudfit, 1965; Marshall and Winn, 1982; Marshall and Stolzenburg et al., 1998; Bateman et al., 1999; Mo et al., 2002). However, an increasing number of E field soundings proved that the charge structure is more complicated than the tripole model (Marshall and Rust, 1991). Stolzenburg et al. (1998a, b, c) presented a new conceptual model of charge structure that consisted of four charge regions in the updraft region and at least six charge regions in the region outside of the updraft; the lowest charge region was positive and changed polarity alternately. Some thunderstorms showed a different charge structure with those already mentioned. Rust et al. (2005) and Tessendorf et al. (2007a, b) found an inverted tripole charge structure in some thunderstorms.
Since the 1980s, Chinese researchers have found some unique electrical features of thunderstorms in a Chinese inland plateau, such as low lightning flash rate, larger-than-usual LPCC and frequent intra-cloud flashes between the LPCC and main negative charge region (Liu et al., 1987; Wang et al., 1987; Zhao et al., 2004; Zhang et al., 2004; Qie et al., 2005a, 2009, 2015). Multi-station observations on lightning flashes were employed to study the charge structure in the region (Qie et al., 2000; Zhang et al., 2009; Cui et al., 2009), and they found that some of the thunderstorms fit the model of the tripole charge structure with a larger-than-usual LPCC. Qie et al. (2005b) found that the thunderstorms with a larger-than-usual LPCC appear to begin with the lower dipole, rather than with the upper dipole followed by the development of a weaker lower positive charge. In addition, they found the larger-than-usual LPCC is unfavorable for negative cloud-to-ground flashes in the mature stage. Zhao et al. (2004) studied one case of thunderstorm with E field sounding, and they confirmed the tripole charge structure with a large LPCC, but with an additional negative screen layer below the LPCC region. By using a lightning mapping system, Li et al. (2013) found that only the main negative charge region and LPCC existed in the initial and mature stage thunderstorm. However, in the decay stage, there were four charge layers and the lowest was negative. Zhang et al. (2015) found that the charge structure also fit the tripole model in the decay stage and the LPCC is the earliest to disappear. Most of the previous studies on charge structure of thunderstorms in a Chinese inland plateau were based on the surface electric field, electric field changes, or lightning mapping system, and the charge structure retrieved by these techniques is the main charge region or charge regions that frequently participate in discharge. However, for those weak charge regions or screen layers, they cannot be observed because they hardly participate in discharge.
In the summer of 2012, a custom-designed instrument called an “E field sounding observation system” has been used to conduct field experiments on thunderstorms in the Pingliang region. One set of soundings was released into a thunderstorm that occurred on 25 August, and the vertical E field was obtained. This paper mainly introduces the characteristics of the E field in the thunderstorm.
Observations on the E field in the thunderstorm were conducted at the Pingliang station of the Chinese Academy of Science (35.57∘ N, 106.59∘ E; 1620 m a.s.l.) in a Chinese inland plateau. X-band radar at the station was used to monitor the activity of the thunderstorm, and a field mill was employed to record the surface E field of the thunderstorm. The radar was located approximately 200 m from the balloon-launching site; therefore, we considered the two sites to be the same location in this paper. The signals of balloon-borne soundings were transmitted to a ground-receiving system on a frequency of 2.4 GHz. Signals include GPS information, temperature, humidity, and corona current.
Based on the corona discharge, the electric field instrument was designed to measure the vertical component of the electric fields in the thunderstorm. Zhao et al. (2008) established the relationship between the E field and corona current in the laboratory and field test, as shown in Eq. (1). Where E is in units of kV m−1, E0 is the threshold of the E field for the corona current in kV m−1, and I (µA) is the corona current with the measurement range of ± 16 µA. Chou et al. (1965) found – under the assumption that the inclination of the corona probe is 15∘ and the wind rate is 20 m s−1, with the influence of cloud droplets on the corona current (10 %), relative humidity changes (10 %) and air pressure (10 %) – that the corona current measurement error is approximately 21 %, and in some extreme conditions, measurement error is likely to reach 50 %. As a result, the maximum errors of E field retrieved by corona current can reach 9.8 and 23 % for the corona current measurement errors of 21 and 50 %, respectively. Such an error might be too large to accurately study the electric field, but it is acceptable for discussing the charge structure of a thunderstorm. Considering the contribution of atmospheric pressure, the relationship between corona current I and E can be expressed as Eq. (2) (Chou et al., 1965). Where P0 is the air pressure at the ground, and P is the air pressure at a sounding point. The charge polarity and density along the sounding path can be calculated by the vertical component profile of the electric field. The charge density ρ can be expressed as Eq. (3), in which ε is the permittivity of air (8.86 × 10⁻¹² F m−1). Here, the electric field was deduced from the corona current whose direction is the same as the direction of the electric line of force. If the downward current is defined as positive, then the associated electric field is also defined as positive.
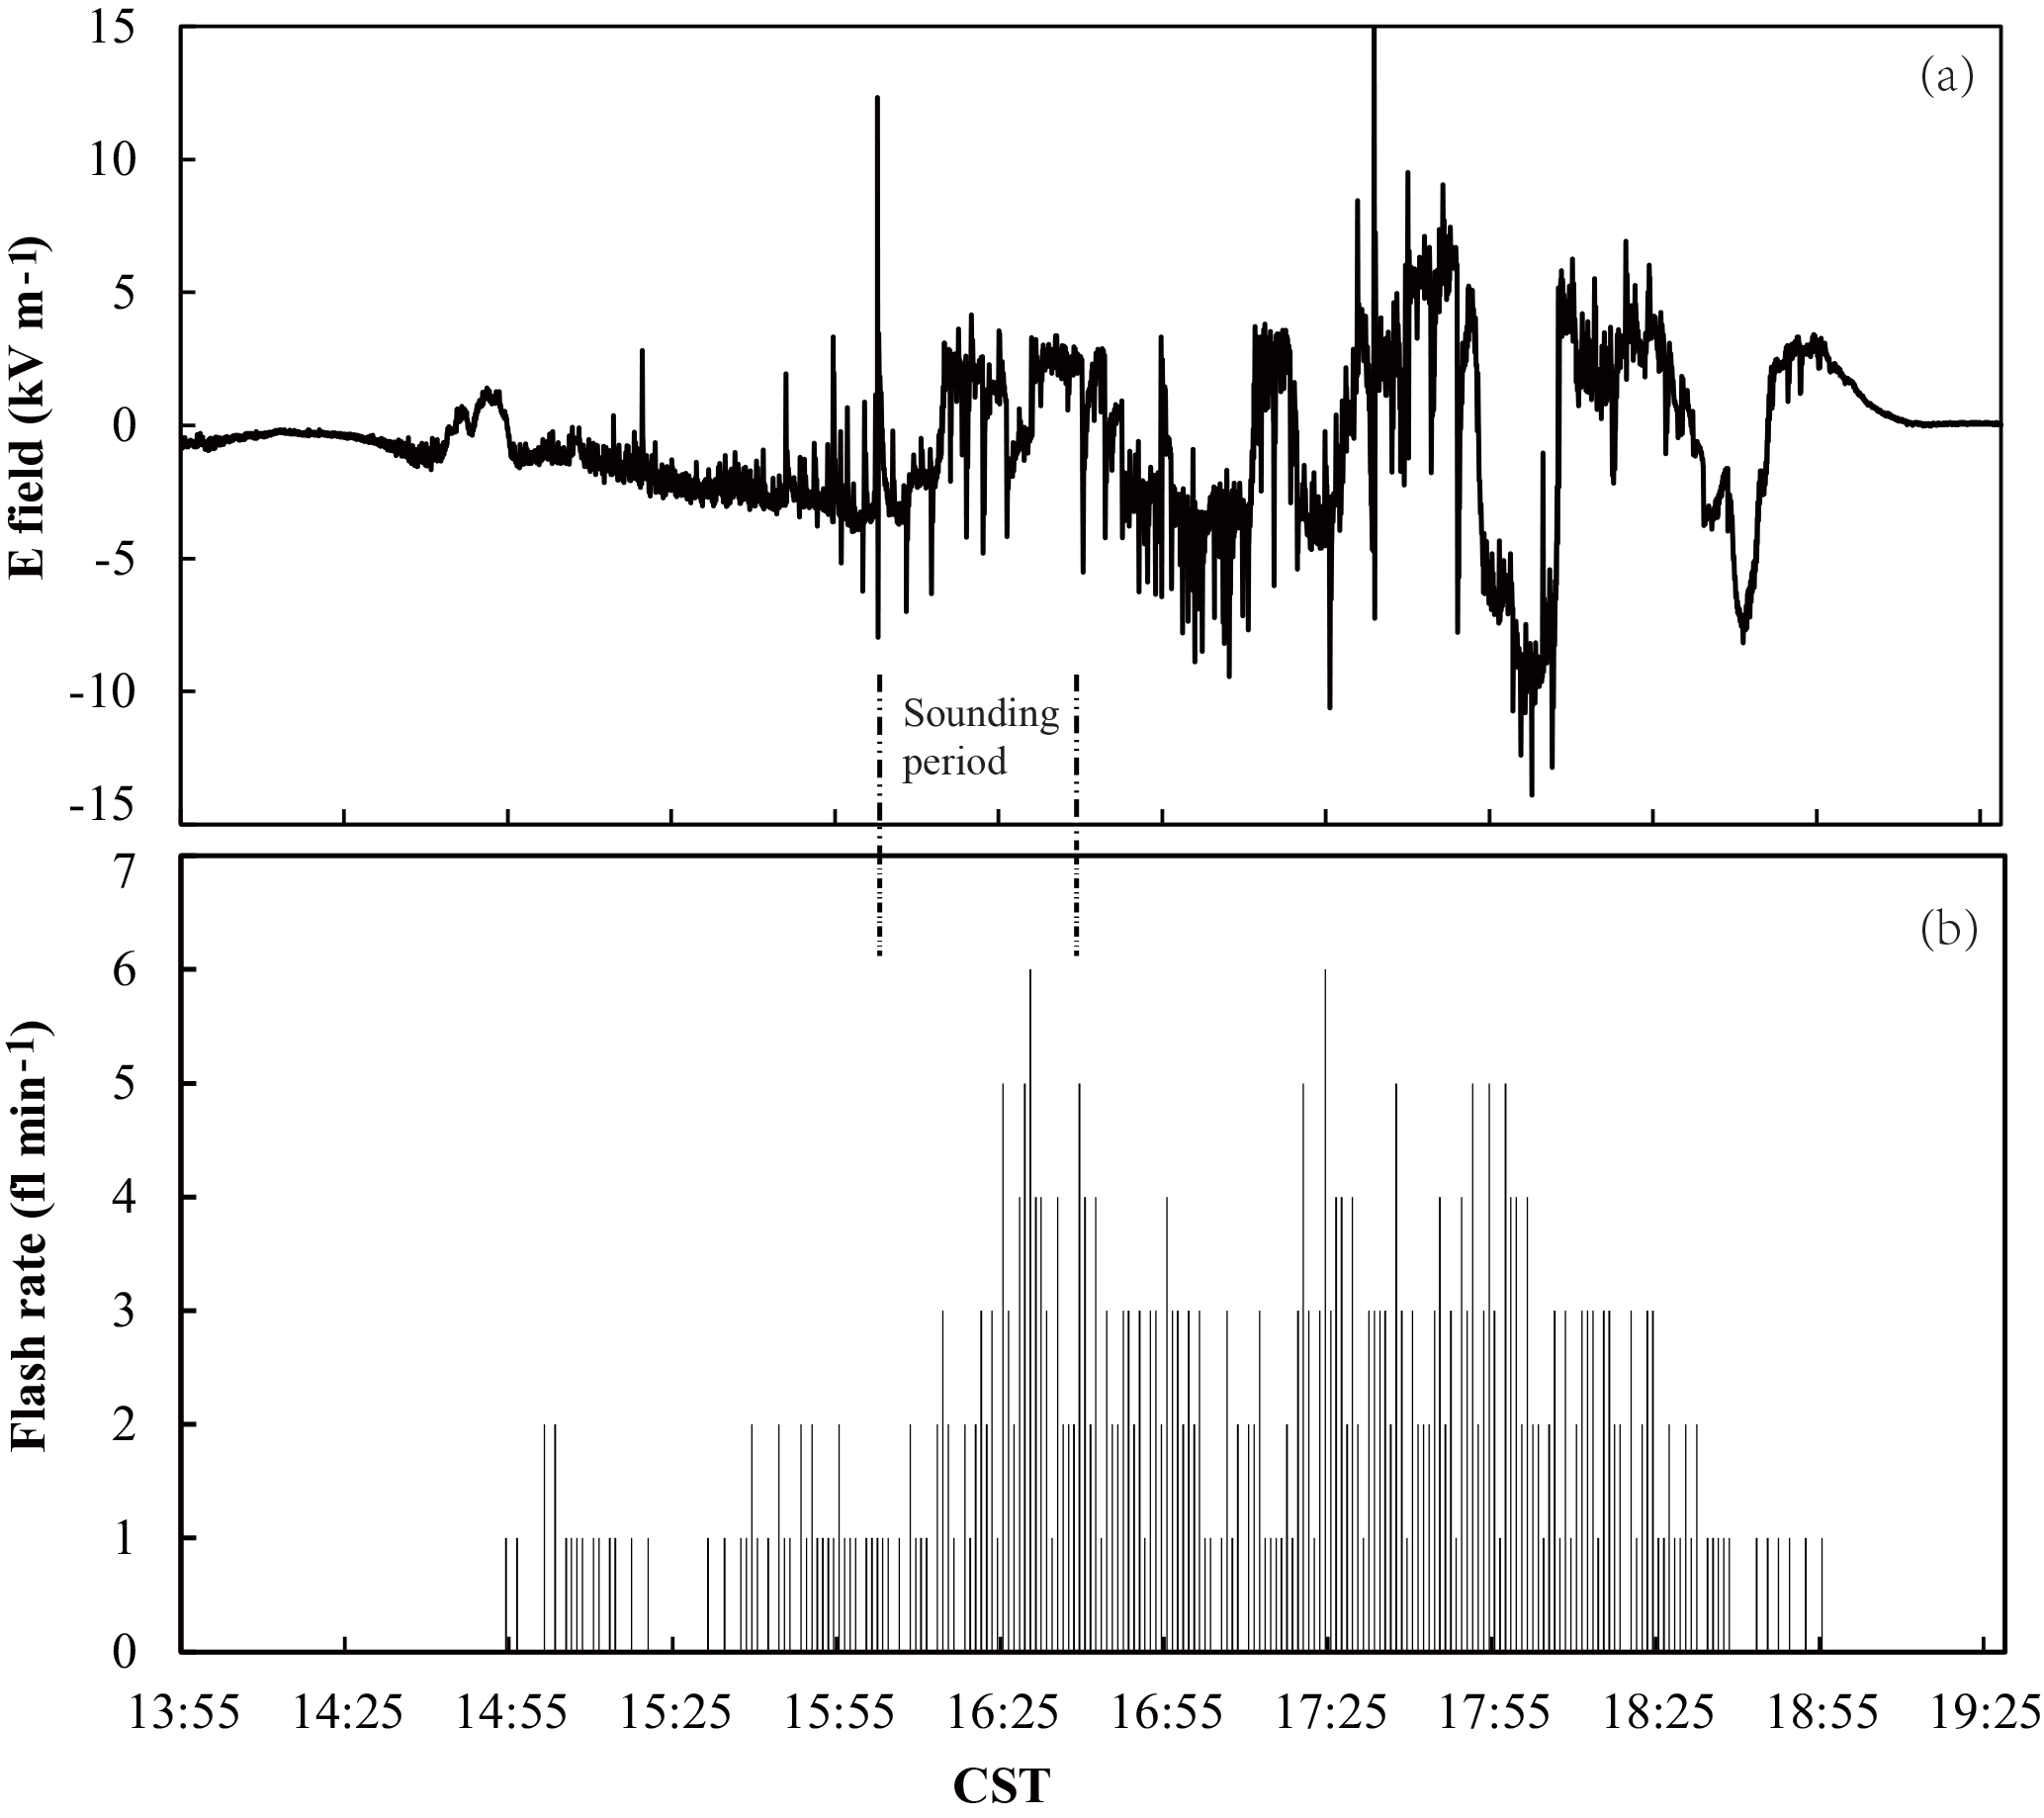
Figure 1Evolution of surface E field and lighting flash rate of the thunderstorm. (a) Surface E field; (b) Flash rate.
3.1 Evolution of thunderstorm and surface E field
In the afternoon of 25 August, at 14:00 CST (China Standard Time, UT + 8), two weak convective cells, one approximately 15 km to the southwest of the station and the other approximately 30 km away to the north, were observed by the radar. At 15:00, the cell in the southwest moved toward the station and its scale expanded. At the same time, the cell in the north remained motionless, but expanded horizontally. The radar reflectivity of both cells was weak. Half an hour later, as the two cells developed further, they connected into a curved cloud band with a cloud edge near the station. A maximum reflectivity of 40 dBZ appeared in the northwest approximately 25 km away. At 16:00, the reflectivity showed a decreasing trend as the cloud body moved closer to the station, and only a small portion of it reached 35 dBZ. Due to power failure, the radar halted at 16:15 and recovered at 17:18. During this period, the cloud body further expanded in scale and completely covered the station with a maximum reflectivity of 50 dBZ. Starting at 18:00, the thunderstorm began to recede while moving eastward and its horizontal scale also shrank gradually. At 19:00, the thunderstorm completely moved away from the station until it disappeared to the east of the station.
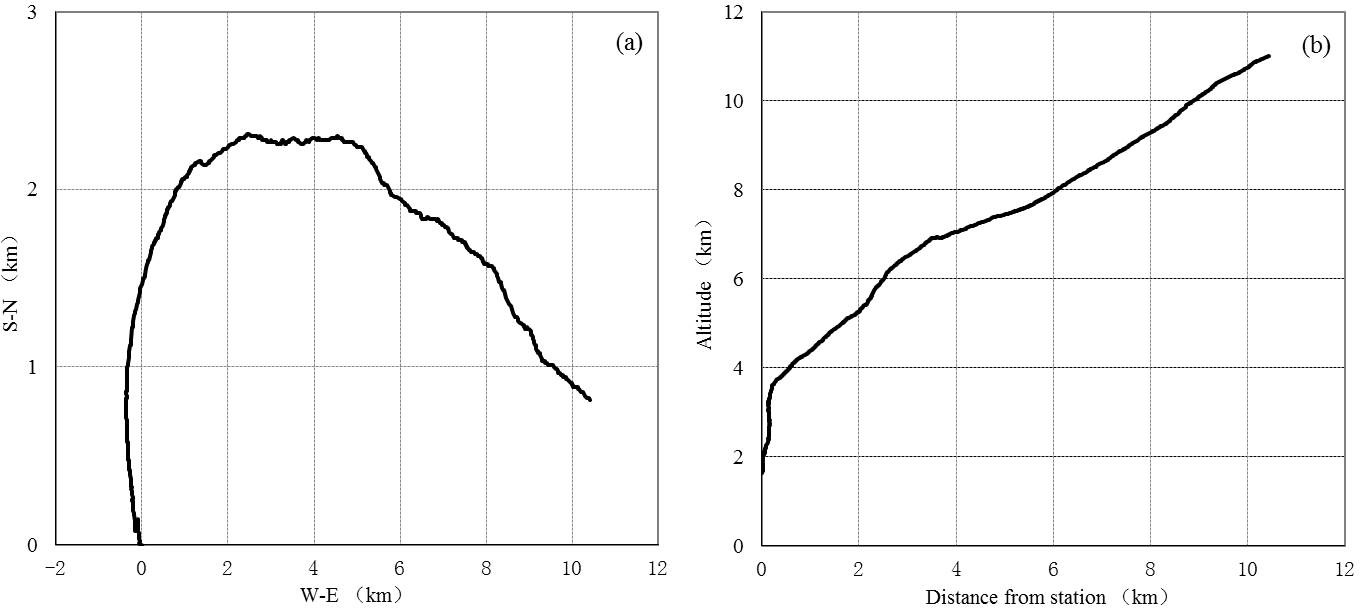
Figure 2Balloon-borne sounding path, (a) surface projection; (b) distance and altitude from the station.
The surface E field was negative and the total flash rate was 1–2 fl min−1 before the thunderstorm arrived at the station at 16:03, as shown in Fig. 1. We knew that the surface E field is positive, i.e., it is controlled by the LPCC when the thunderstorm arrived at the station. No other lightning flash data can be used to study the total lighting flash rate and to distinguish cloud-to-ground flashes from intra-cloud discharges. Therefore, the flash rate was counted from the surface E field changes caused by lightning flashes. The surface E field changed from negative to positive at 16:15 and lasted 29 min (16:44). The flash rate increased rapidly and reached a peak value of 6 fl min−1 during this period. Based on the surface precipitation at the station and time differences between sound and light of flashes, we inferred when the thunderstorm arrived at the station and that the surface E field was controlled by LPCC. A lightning flash at 16:44:58 caused the surface E field to change from positive to negative, and the negative E field was maintained for 28 min. During this period, the mean flash rate was 2 fl min−1. We speculated that the intra-cloud discharges continued to consume positive charge of the LPCC. As a result, the surface E field was controlled by the main negative charge region. The low flash rate was in favor of recovering LPCC and the E field reversed to positive at 17:12. Seven minutes later, the polarity of the surface E field reversed again to negative and lasted for 11 min. The mean flash rate increased to 3–4 fl min−1 as the value of the negative E field was enhanced. The fluctuations of the surface E field were mainly influenced by the intensity of each charge region in the thunderstorm and distance between the charge center and station. At 18:00, the flash rate began to decrease because the thunderstorm was dissipating, and continuous fluctuations of the E field occurred in the decay stage. Marshall et al. (2009) considered that the EOSO (end of storm oscillation) is related to the formation and dissipation of charge regions in the thunderstorm.
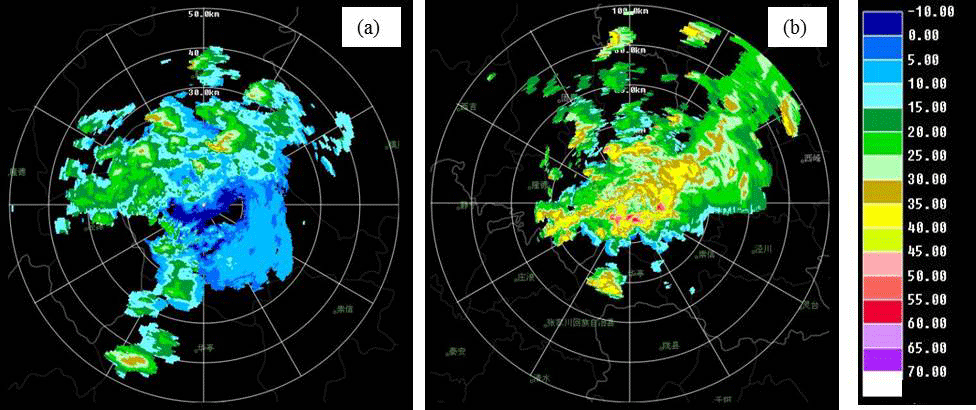
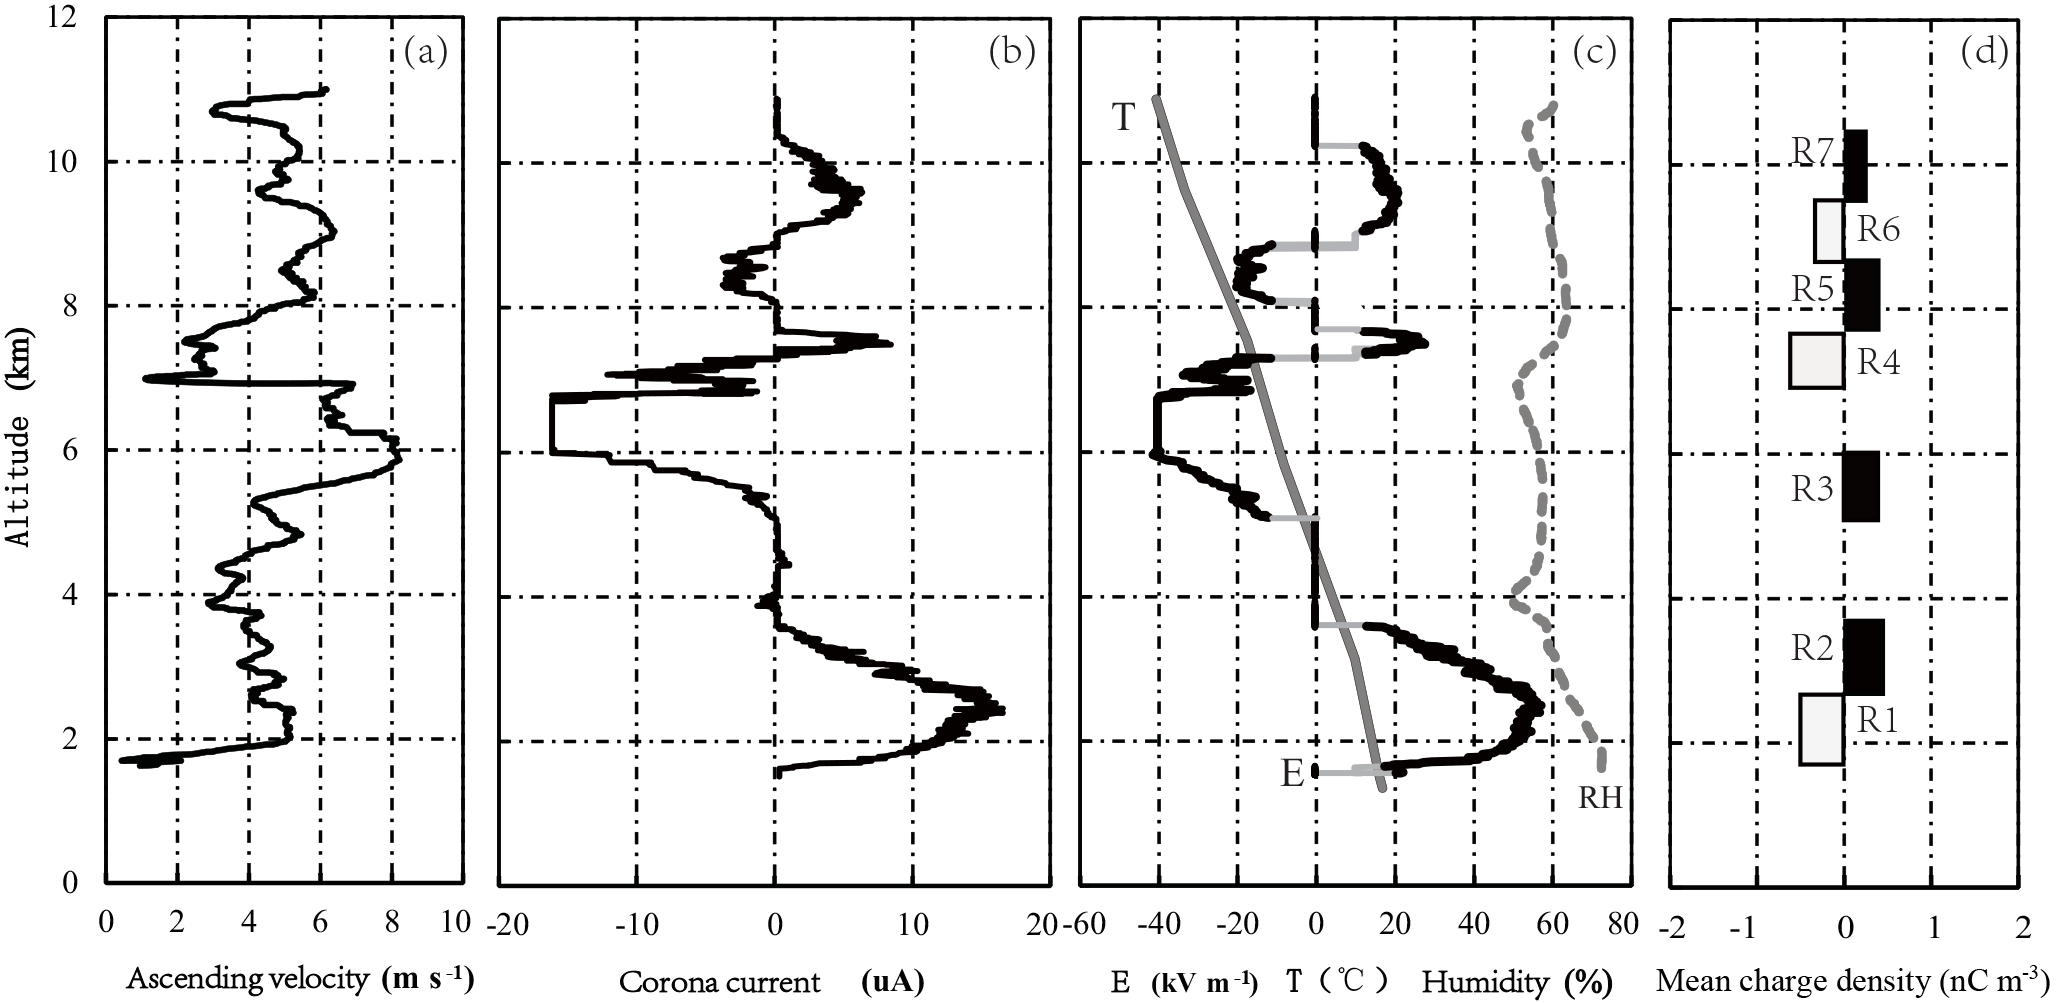
Figure 4Sounding results: (a) ascending velocity of the balloon; (b) corona current; (c) E field, temperature (T), and relative humidity (RH). Black lines are vertical E fields retrieved by corona current and they have been manually connected by light grey lines to form a complete profile; (d) mean charge density.
3.2 Vertical E field in thunderstorm
The balloon-borne sounding was launched when the thunderstorm covered the station at 16:08. Observations showed that the sounding traversed the cloud top for the duration of 33 min. Influenced by a horizontal wind, the balloon flew horizontally eastward approximately 11 km before traversing the cloud top, as shown in Fig. 2a, b. Because of electric power malfunction, the last radar volume scans occurred at 16:15 and the composite reflectivity (CR) was provided in Fig. 3a. The radar worked in a specified mode for business operation, thus its maximum elevation was 19.5∘. In addition, the launching site of the sounding was so close to the radar that the sounding path was mainly located in the dead zone of the radar. Therefore, here we chose CR as a key reference index to estimate the evolution of the thunderstorm. Compared with the CR of the thunderstorm in the mature stage at 17:25 (Fig. 3b, the first volume scan of the radar after the electric power recovery), we found that the thunderstorm had a small scale with weak CR. Moreover, the lightning flash rate was still quite low, although it increased to its peak value at 16:29. All of these facts indicated that the period of sounding was during the early period of the mature stage of the thunderstorm.
Figure 4 showed the corona current, temperature, relative humidity, balloon ascending velocity, and the mean charge density. The values of balloon ascending velocity ranged from 1 to 8 m s−1 with a mean value of 5 m s−1 and the extreme values of ascending velocity appeared in the region of 5.81–6.15 km. Balloon ascending velocity was the result of a net uplift force of the balloon and updraft in the thunderstorm; therefore, it should be larger than the velocity of the updraft. The strongest positive E field appeared at 2.3 km and the strongest negative E field appeared at 6.1–6.7 km. Comparing the balloon ascending velocity and E field, we found that the maximum value of balloon ascending velocity was located in the lower part of the saturated negative E field, and such a result is basically coincident with physical principles, i.e., when the charge regions with opposite polarity are distributed alternately, the extreme value of the vertical E field is in the transition zone between the two adjacent charge regions. When the charged particles with opposite polarity are separated rapidly by the stronger updraft in a certain region, the extreme value of the E field can be observed in the same region. As a result, the particles separated by the updraft should have different sizes or weights. This deduction basically conforms to the ice-graupel charging mechanism proposed by Takahashi (1978).
Based on a one-dimensional approximation to the Gauss law, the mean charge densities of the charge regions were retrieved by considering the E field errors caused by a corona measuring error of 50 %. The results showed that the balloon sounding completely passed through seven predominant charge regions in its path. Two charge regions located in the region warmer than 0 ∘C and the remaining five charge regions existed in the region colder than 0 ∘C. The polarity of the charge region near the surface was negative with a depth of 800 m. The other charge region was a positive one in the warm cloud. The mean charge densities of the two charge regions were −0.44 ± 0.136 nC m−3 (1.7–2.5 km) and 0.43 ± 0.103 nC m−3 (2.5–3.6 km). Such a negative corona ion layer with larger charge density and depth heavily influences the measurement of surface E field. Soula and Chauzy (1991) measured the E field near the surface at several levels up to 800 m, and they found a positive corona ion region with charge density close to 1 nC m−3 within each layer. Qie et al. (1994) simulated the corona ions beneath a thunderstorm and found the layer of corona ions can reach several hundreds of meters above the ground. Qie et al. (1998) studied the electric field and charge density under one thunderstorm in the Pingliang region, and they also found the corona ion layer was negative with its depth larger than 600 m.
In the region colder than 0 ∘C, a total of five charge regions existed and they were distributed alternately in a vertical direction with the lowest charge region being positive. From bottom to top, the mean charge densities of the five charge regions were 0.40 ± 0.037 nC m−3 (5.2–6.1 km, −9.5 to −4 ∘C), −0.63 ± 0.0107 nC m−3 (6.7–7.5 km, −18 to −14 ∘C), 0.35 ± 0.063 nC m−3 (7.5–8.6 km, −27 to −18 ∘C), −0.36 ± 0.057 nC m−3 (8.6–9.5 km, −34 to −27 ∘C), and 0.24 ± 0.06 nC m−3 (9.5–10.2 km, −38 to −34 ∘C). In the region around 0 ∘C (3.6–5.2 km), no charge layer was detected, it indicated that the electric field in this region was too weak to cause the corona current on the probe, the corona current and the retrieved E field were equal to zero as a result. In the case of the continuous evolution of the E field, it is possible that the charge regions of R2 and R3 are the same charge region with a weak charge density layer in the middle. If it was true, the mean charge density of this lower positive charge region was 0.24 ± 0.046 nC m−3 (2.5–6.1 km, 14 to −9.5 ∘C). Additionally, in the region of 6.1–6.7 km, the E field was saturated with two positive charge regions at the upper and lower parts, and the boundary of the two charge regions was unknown. So the real range of the two charge regions should be underestimated.
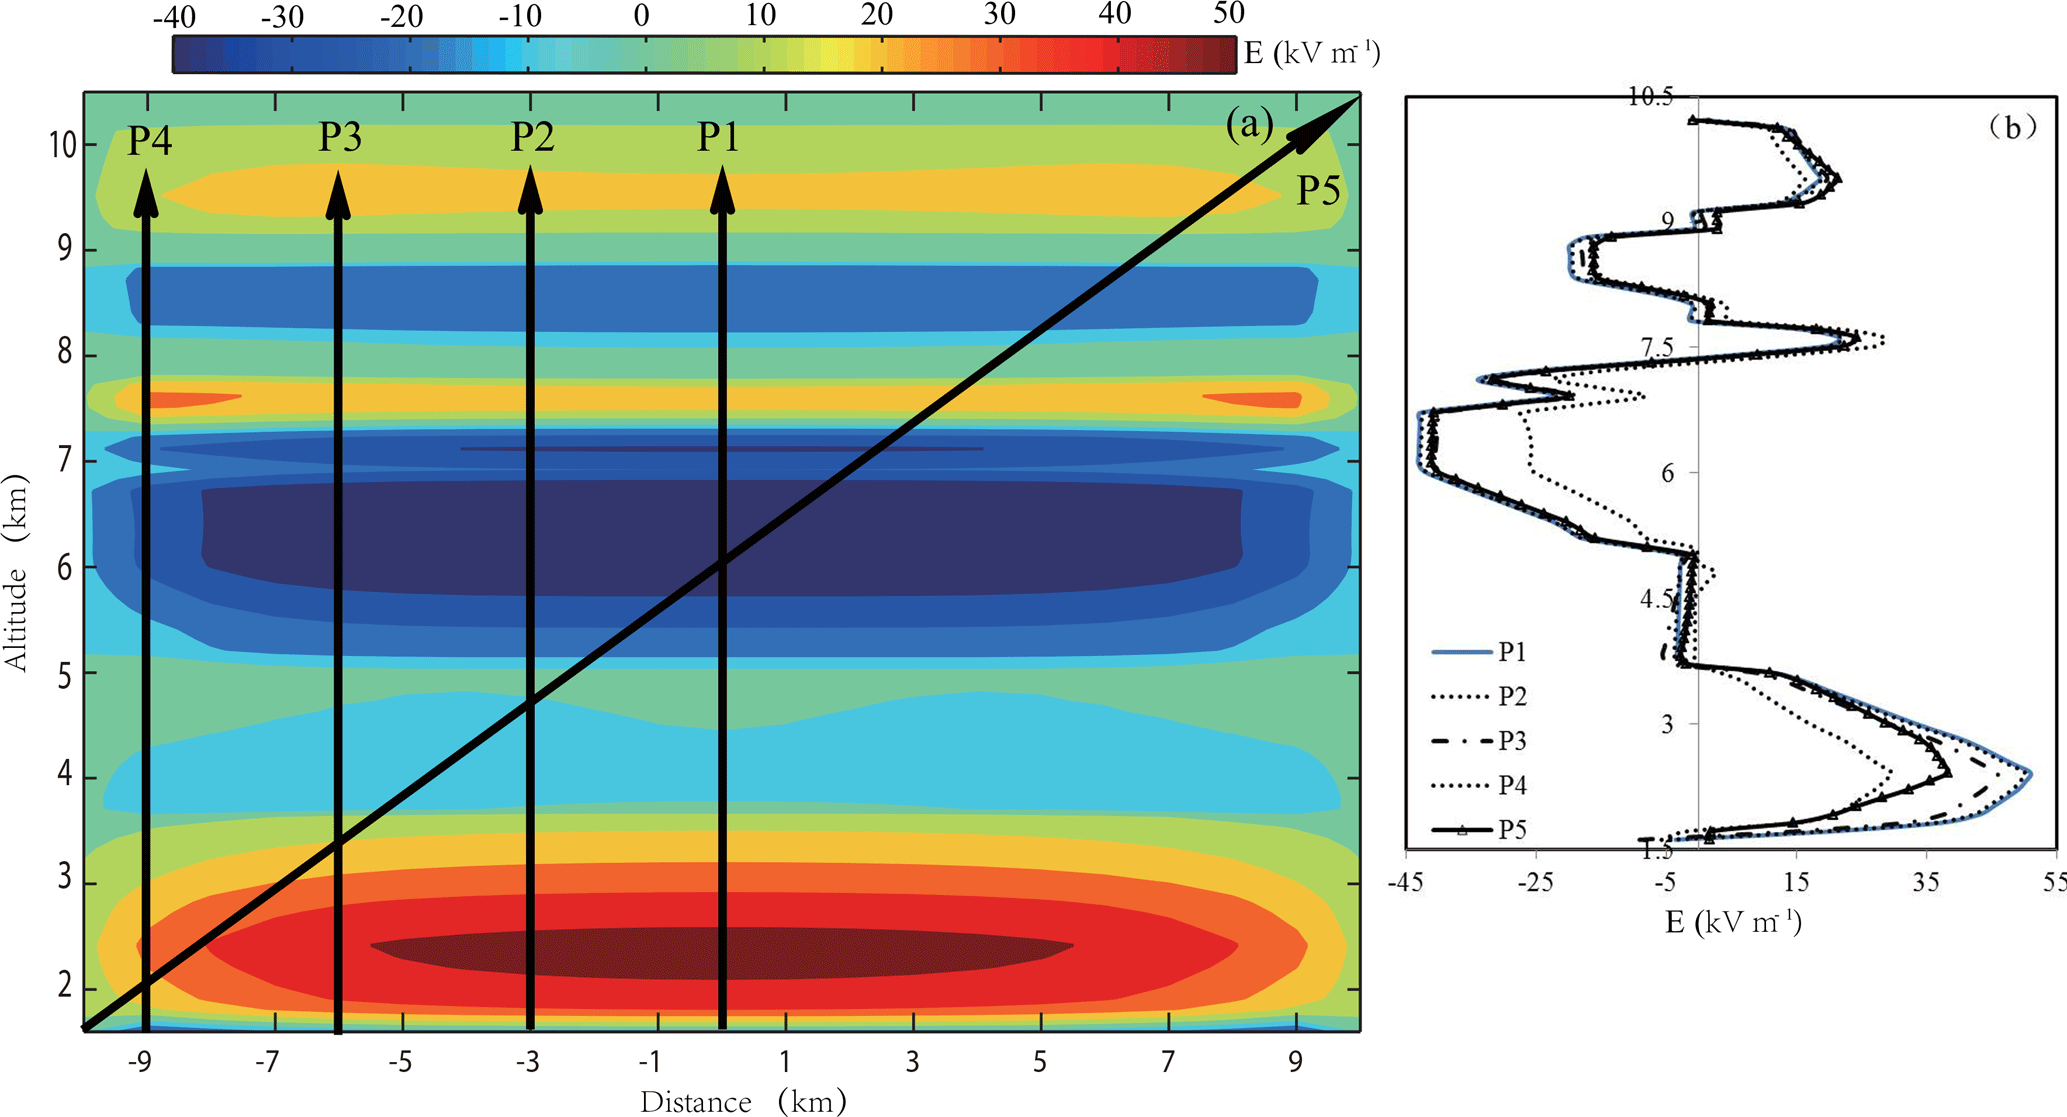
Figure 5Model results of vertical E field by using the mean charge density in Fig. 4d, (a) vertical section across model center; (b) profiles of E field at different paths.
The product term of the mean charge density ρ and thickness h was used to estimate the intensity of each charge region, and the horizontal distribution of charge density was regarded as uniform (Marshall and Rust, 1991). The values of ρh for the seven regions from surface to cloud top were −344.5 ± 109.1, 431.6 ± 113.5, 356.0 ± 68.4, −532.5 ± 85.6, 356.6 ± 69.3, −356.7 ± 52.2, and 177.9 ± 42.1 nC m−2. The results indicated that the most intensive charge region was the negative charge region at the height of 6.7–7.5 km, and the weakest was the positive charge region at the top of the cloud. The remaining three charge regions had nearly the same intensity. If the two positive charge regions of R2 and R3 are the same charge region, the value of ρh is 864 ± 165.6 nC m−2. Our calculation showed that the summation of ρh of the five charge regions in the region colder than 0 ∘C was nearly equal to zero. Therefore, the net charge in the thunderstorm is also zero if the charge density is distributed uniformly across the horizontal plane. According to the law of conservation of charge, the quantities of negative charge and positive charge produced by the charging mechanism in the cloud should be equal even if the intra-cloud discharges occur frequently. However, cloud-to-ground (CG) flashes can consume charges with particular polarity, and the equal net charge with opposite polarity will be reserved in the thunderstorm as a result. We assumed that CG flashes rarely occur in the thunderstorm because the sounding period is in the early period of the mature stage; hence, the net charges in the thunderstorm stay at zero.
The balloon drifted horizontally almost 11 km before passing through the cloud top. It was still unknown if the E fields obtained in such a path can be used to study the charge structure accurately. Here, a model was adopted to analyze the influence of the balloon path on the E field measurement.
The adopted model assumes that the charges are distributed uniformly in a disk with a radius of R and thickness of H (Burke and Few, 1978). Based on the vertical distribution of the mean charge density, the vertical E field can be calculated in each grid point of the model. Here, the charge structure of the model adopted the real sounding result of Fig. 4c to test the E field profile in the different sounding paths. The radius of the disk is another parameter that influences the vertical E field, and several values for radius were selected to compare the difference between the real E field profile and calculated results at the center of the cylinder. We found that the smaller the radius, the larger the difference between profiles and the real E field, when the disk radius is larger than 10 km, the real E field profile and the calculated results are quite similar. As a result, the spatial distribution of the vertical E field was calculated by using a disk radius of 10 km. In fact, the real radius of the thunderstorm is larger than 10 km in the mature stage. Figure 5a showed the vertical cross section through the center of the model. The vertical E fields of four vertical paths (P1, P2, P3, and P4) and one slant path (P5) were figured out in Fig. 5b. When the vertical path is closer to the center, the E profile is more accurate and there is a larger difference in the fringe region of the model. However, all E field profiles of different paths have almost the same trend and polarity. This indicated that the polarity and location of the charge regions retrieved by the E field of the five paths are consistent with each other, with the exception of the mean charge density. The real sounding path of observation is more complicated than the five cases discussed. These simulation results indicated that only observations in the fringe region can cause non-ignorable errors.
Based on observations of the vertical E field and particles in a thunderstorm that occurred on 25 August 2012, the vertical electrical field and charge structure in the thunderstorm were analyzed.
A total of seven predominant charge regions were penetrated by the balloon-borne sounding. In the region warmer than 0 ∘C, a pair of charge regions existed with a positive charge region upon a negative one. In contrast to the classic tripole model summarized by Williams (1989), there were five charge regions in the region colder than 0 ∘C and the lowest charge region and upper boundary were all positive. This result showed that the real charge structure of thunderstorms in a Chinese inland plateau is more complex than the tripole model retrieved by multi-station observation of lightning flashes in the study region (Qie et al., 2000; Zhang et al., 2009; Cui et al., 2009).
The values of ρh for the five charge regions in the mixing phase region were 356.0 ± 68.4, −532.5 ± 85.6, 356.6 ± 69.3, −356.7 ± 52.2, and 177.9 ± 42.1 nC m−2. In the region colder than 0 ∘C, the most intense charge region is the main negative charge region located at 6.7–7.5 km and the weakest is the positive charge region at the top of the cloud. The regions with saturated E field were not considered in calculating the values of ρh, the real values of ρh for the lower positive charge region (5.2–6.1 km) and main negative charge region (7.5–8.6 km) were underestimated as a result. If it is true that the two positive charge regions in the lower portion of the thunderstorm are the same charge region, then its mean charge density and intensity are 0.24 ± 0.046 nC m−3 (2.5–6.1 km, 14 to −9.5 ∘C) and 864 ± 165.6 nC m−2, respectively. The strong lower dipole can well explain the frequent intra-cloud discharge occurring between the two charge regions as reported by early observation results (Qie et al., 2005a, b). Furthermore, the charge layers near surface cannot be ignored when considering the influence of charge structure on lightning activities.
Stolzenburg et al. (1998b) proposed a conceptual model of the charge structure in isolated thunderstorms, i.e., four charge regions appear in the updraft and six in the downdraft; a common feature is that the lowest charge region is positive and the negative charge region at the upper boundary is considered a screening layer. Zhao et al. (2009) found that the charge structure for one case of a thunderstorm in the Pingliang region is similar with that of the conceptual model in the updraft shown by Stolzenburg et al. (1998b). In addition, the mean charge density of the lower positive charge region is the largest for all four charge regions. Based on observations of a three-dimensional lightning mapping system, Li et al. (2013) studied a thunderstorm in Qinghai, on eastern verge region of the Tibetan Plateau, and noted that the thunderstorm had two charge regions with a negative charge region (6–7 km a.s.l.) upon a stronger positive one (4–6 km a.s.l.) during its developing and mature stages. This sounding lasted a total of 33 min and started from the late period of the initial stage to the end of the mature stage; therefore, our study may be a good presentation of the charge structure of the thunderstorm in this transitional period. In comparison to the results of Li et al. (2013), we found that there were three additional charge regions upon the lower dipole in our case study. Li et al. (2013) found that the charge structure converted into four charge regions during the dissipating stage. However, it is unreasonable that two additional charge regions suddenly appeared in the thunderstorm. It is more likely that they had existed before and did not participate in discharging. Therefore, we speculated that more charge regions should exist upon the lower dipole of the thunderstorm studied by Li et al. (2013).
All data used in this paper can be found on the following website: https://pan.baidu.com/s/13MnvwP4Jrgee1H4TNtdIgA (Yu, 2018).
TZ organized the electric field sounding observations of thunderstorms in the Pingliang region in 2012 and obtained the key data of the study case in this paper. The raw data analysis and error estimation were finished by HY and FZ, and the model was completed by JC and MZ. Finally, based on discussions by the authors, TZ prepared the manuscript.
The authors declare that they have no conflict of interest.
The research is supported by National Natural Science Foundation (grant no:
41375011, 41775011). Special thanks are owed to Pingliang Station of
Lightning and Hail Research, Chinese Academy of Sciences for providing radar
service and technical support.
The
topical editor, Vassiliki Kotroni, thanks two anonymous referees for help in
evaluating this paper.
Bateman, M. G., Marshall, T. C., Stolzenburg, M., and Rust, W. D.: Precipitation charge and size measurements inside a New Mexico mountain thunderstorm, J. Geophys. Res., 104, 9643–9653, https://doi.org/10.1029/1998JD200118, 1999.
Burke, H. K. and Few, A. A.: Direct measurements of the atmospheric conduction current, J. Geophys. Res., 83, 3093–3098, https://doi.org/10.1029/JC083iC06p03093, 1978.
Chou, S. C., Jen, L. H., and Chen, L. H.: An experimental investigation on the point-inductor used for the strong field-radiosonde, Chinese J. Geophys.-Ch., 14, 20–32, 1965 (in Chinese).
Cui, H., Qie, X., Zhang, Q., Zhang, T., Zhang, G., and Yang, J.: Intracloud discharge and the correlated basic charge structure of a thunderstorm in Zhongchuan, a Chinese Inland Plateau region, Atmos. Res., 91, 425–429, https://doi.org/10.1016/j.atmosres.2008.06.007, 2009.
Li, Y., Zhang, G., Wen, J., Wang, D., Wang, Y., Zhang, T., Fan, X., and Wu, B.: Electrical structure of a Qinghai-Tibet Plateau thunderstorm based on three-dimensional lightning mapping, Atmos. Res., 134, 137–149, https://doi.org/10.1016/j.atmosres.2013.07.020, 2013.
Liu, X. S., Guo, C. M., and Wang, C. W.: The surface electrostatic field-change produced by lightning flashes and the lower positive charge layer of the thunderstorm, Acta Meteorol. Sin., 45, 500–504, 1987.
MacCready, P. B. and Proudfit, A.: Observations of hydrometeor charge evolution in thunderstorms, Q. J. Roy. Meteor. Soc., 91, 44–53, https://doi.org/10.1002/qj.49709239121, 1965.
Marshall, T. C. and Rust, W.: Electric field soundings through thunderstorms, J. Geophys. Res., 96, 22297–22306, https://doi.org/10.1029/91JD02486, 1991.
Marshall, T. C. and Stolzenburg, M.: Estimates of cloud charge densities in thunderstorms, J. Geophys. Res., 103, 19769–19775, https://doi.org/10.1029/98JD01674, 1998.
Marshall, T. C. and Winn, W. P.: Measurements of charged precipitation in a New Mexico thunderstorm: Lower positive charge centers, J. Geophys. Res., 87, 7141–7157, https://doi.org/10.1029/JC087iC09p07141, 1982.
Marshall, T. C., Stolzenburg, M., Krehbiel, P. R., Lund, N. R., and Maggio, C. R.: Electrical evolution during the decay stage of New Mexico thunderstorms, J. Geophys. Res., 114, D02209, https://doi.org/10.1029/2008JD010637, 2009.
Mo, Q., Helsdon Jr., J. H., and Winn, W. P.: Aircraft observations of the creation of lower positive charges in thunderstorms, J. Geophys. Res., 107, 4616, https://doi.org/10.1029/2002JD002099, 2002.
Qie, X., Soula, S., and Chauzy, S.: Influence of ion attachment on the vertical distribution of the electric field and charge density below a thunderstorm, Ann. Geophys., 12, 1218–1228, https://doi.org/10.1007/s00585-994-1218-6, 1994.
Qie, X., Liu, X., Zhang, G., Guo, C., Wang, D., Ushio, T., and Watanabe, T.: Characteristics of lightning discharging to ground in Zhongchuan area, Acta Meteorol. Sin., 56, 312–322, 1998.
Qie, X., Yu, Y., Liu, X., Guo, C., Wang, D., Watanabe, T., and Ushio, T.: Charge analysis on lightning discharges to the ground in Chinese inland plateau (close to Tibet), Ann. Geophys., 18, 1340–1348, https://doi.org/10.1007/s00585-000-1340-z, 2000.
Qie, X., Kong, X., Zhang, G., Zhang, T., Yuan T., Zhou, Y., Zhang, Y., and Wang, H.: The possible charge structure of thunderstorm and lightning discharges in north eastern verge of Qinghai Tibetan Plateau, Atmos. Res., 76, 231–246, https://doi.org/10.1016/j.atmosres.2004.11.034, 2005a.
Qie, X., Zhang, T., Chen, C., Zhang, G., Zhang, T., and Wei, W.: The lower positive charge center and its effect on lightning discharges on the Tibetan Plateau, Geophys. Res. Lett., 32, 215–236, https://doi.org/10.1029/2004GL022162, 2005b.
Qie, X., Zhang, T., Zhang, G., Zhang, T., and Kong, X.: Electrical characteristics of thunderstorms in different plateau regions of China, Atmos. Res., 91, 244–249, https://doi.org/10.1016/j.atmosres.2008.04.014, 2009.
Qie, X., Zhang, Y., Yuan, T., Zhang, Q., and Zhang, T.: A review of atmospheric electricity research in china, Adv. Atmos. Sci., 32, 169–191, https://doi.org/10.1007/s00376-014-0003-z, 2015.
Rust, W. D., MacGorman, D. R., Bruning, E. C., Weiss, S. A., Krehbiel, P. R., Thomas, R. J., Rison, W., Hamlin, T., and Harlin, J.: Inverted-polarity electrical structures in thunderstorms in the Severe Thunderstorm Electrification and Precipitation Study (STEPS), Atmos. Res., 76, 247–271, https://doi.org/10.1016/j.atmosres.2004.11.029, 2005.
Simpson, G. and Robinson, G. D.: The distribution of electricity in thunderclouds, II, P. Roy. Soc. Lond. A Mat., 177, 281–329, https://doi.org/10.1098/rspa.1941.0013, 1941.
Simpson, G. and Scrase, F. J.: The distribution of electricity in thunderclouds, P. Roy. Soc. Lond. A Mat., 161, 309–352, https://doi.org/10.1098/rspa.1937.0148, 1937.
Soula, S. and Chauzy, S.: Multilevel measurement of the electric field underneath a thundercloud 2: Dynamical evolution of ground space charge, J. Geophys. Res, 96, 22327–22336, https://doi.org/10.1029/91JD02032, 1991.
Stolzenburg, M., Rust, W., Smull, B., and Marshall, T.: Electrical structure in thunderstorm convective regions 1. Mesoscale convective systems, J. Geophys. Res., 103, 14059–14078, https://doi.org/10.1029/97JD03546, 1998a.
Stolzenburg, M., Rust, W., and Marshall, T.: Electrical structure in thunderstorm convective regions 2. Isolated storms, J. Geophys. Res., 103, 14079–14096, https://doi.org/10.1029/97JD03547, 1998b.
Stolzenburg, M., Rust, W., and Marshall, T.: Electrical structure in thunderstorm convective regions 3. Synthesis, J. Geophys. Res., 103, 14097–14108, https://doi.org/10.1029/97JD03545, 1998c.
Takahashi, T.: Riming electrification as a charge generation mechanism in thunderstorms, J. Atmos. Sci., 35, 1536–1548, https://doi.org/10.1175/1520-0469(1978)035<1536:REAACG>2.0.CO;2, 1978.
Tessendorf, S. A., Rutledge, S. A., and Wiens, K. C.: Radar and lightning observations of normal and inverted polarity multicellular storms from STEPS, Mon. Weather Rev., 135, 3682–3706, https://doi.org/10.1175/2007MWR1954.1, 2007a.
Tessendorf, S. A., Wiens, K. C., and Rutledge, S. A.: Radar and lightning observations of the 3 June 2000 electrically inverted storm from STEPS, Mon. Weather Rev., 135, 3665–3681, https://doi.org/10.1175/2006MWR1953.1, 2007b.
Wang, C. W., Chen, Q., Liu, X. S., Guo, C. M., and Ge, Z. M.: The electric field produced by the lower positive charge centre of thunderstorm, Plat. Meteo., 6, 65–74, 1987 (in Chinese).
Williams, E.: The tripole structure of thunderstorms, J. Geophys. Res., 94, 13151–13167, https://doi.org/10.1029/JD094iD11p13151, 1989.
Wilson, C. T. R.: Some thundercloud problems, J. Franklin I., 208, 1–12, 1929.
Yu, H.: data availability.rar, available at: https://pan.baidu.com/s/13MnvwP4Jrgee1H4TNtdIgA, last access: 4 July 2018.
Zhang, T., Qie, X., Yuan, T.,Zhang, G., and Zhang, T.: Charge source of cloud-to-ground lightning and charge structure of a typical thunderstorm in the Chinese Inland Plateau, Atmos. Res., 92, 475–480, https://doi.org/10.1016/j.atmosres.2009.01.020, 2009.
Zhang, T., Zhao, Z., Wei, C., Yu, H., and Zhou, F.: Electrical soundings in the decay stage of a thunderstorm in the Pingliang region, Atmos. Res., 164–165, 188–193, https://doi.org/10.1016/j.atmosres.2015.05.008, 2015.
Zhang, Y. J., Dong, W. S., Zhang, G. S., Zhang, H. F., Chen, C. P., and Zhang, T.: Study of charge structure and radiation characteristic of intracloud discharge in thunderstorms of Qinghai-Tibet Plateau, Sci. China Ser. D, 47, 108–114, https://doi.org/10.1007/BF02880986, 2004.
Zhao, Y., Zhang, Y. J., Dong, W. S., Zhang, H. F., Chen, C. P., and Zhang, T.: Preliminary analysis of characteristics of lightning in the Nagqu area of the Qinghai-Xizang plateau, Chinese J. Geophys.-Ch., 47, 405–410, 2004 (in Chinese).
Zhao, Z., Qie, X., Zhang, T., Zhang, T., Zhang, H., Wang, Y., She, Y., and Sun, B.: Electric field soundings and the charge structure within an isolated thunderstorm, Chinese. Sci. Bull., 55, 872–876, https://doi.org/10.1007/s11434-009-0471-1, 2010.
Zhao, Z. K., Qie, X. S., Zhang, G. S., Zhang, T. L., Zhang, T., Guo, F. X., and Dou, Z. Q.: The calibration of an instrument for measuring thunderstorm electric fields in open-air and first-step sounding experiments, Plateau Meteorol., 27, 881–887, 2008 (in Chinese).