the Creative Commons Attribution 4.0 License.
the Creative Commons Attribution 4.0 License.
 | 09 Apr 2018
Impact of disturbance electric fields in the evening on prereversal vertical drift and spread F developments in the equatorial ionosphere
Mangalathayil A. Abdu
Paulo A. B. Nogueira
Angela M. Santos
Jonas R. de Souza
Inez S. Batista
Jose H. A. Sobral
Equatorial plasma bubble/spread F irregularity occurrence can present large variability depending upon the intensity of the evening prereversal enhancement in the zonal electric field (PRE), that is, the F region vertical plasma drift, which basically drives the post-sunset irregularity development. Forcing from magnetospheric disturbances is an important source of modification and variability in the PRE vertical drift and of the associated bubble development. Although the roles of magnetospheric disturbance time penetration electric fields in the bubble irregularity development have been studied in the literature, many details regarding the nature of the interaction between the penetration electric fields and the PRE vertical drift still lack our understanding. In this paper we have analyzed data on F layer heights and vertical drifts obtained from digisondes operated in Brazil to investigate the connection between magnetic disturbances occurring during and preceding sunset and the consequent variabilities in the PRE vertical drift and associated equatorial spread F (ESF) development. The impact of the prompt penetration under-shielding eastward electric field and that of the over-shielding, and disturbance dynamo, westward electric field on the evolution of the evening PRE vertical drift and thereby on the ESF development are briefly examined.
Keywords. Ionosphere (ionospheric irregularities)


It is a well-recognized fact that under quiet ionospheric conditions over the equatorial region the evening prereversal enhancement in the zonal electric field (PRE) due to the F layer dynamo developing from sunset electrodynamic processes is a basic precursor requirement for the generation of post-sunset plasma bubble irregularities. The enhanced electric field driving upward the F region plasma sets the conditions for the instability growth at the bottom side of the rapidly rising F layer. By the well-known Rayleigh–Taylor interchange mechanism the instability may grow nonlinearly to the topside ionosphere as field-aligned structures of plasma depletions cascading into a hierarchy of wide-ranging scale sizes of irregularities, known as equatorial plasma bubble (EPB), or spread F (ESF) irregularities. Variability on a short-term or day-to-day basis in the PRE vertical drift is therefore an important aspect to be considered for a better understanding of the variability in the EPB/ESF occurrences widely observed in their diverse manifestations as documented in the literature (e.g., Abdu et al., 1981, 2003, 2009; Sastri et al., 1997; Fejer et al., 1999; Tsunoda, 2006; Su et al., 2008; Kil et al., 2009; Huang et al., 2012; Li et al., 2012; Carter et al., 2014a). The short-term variability in the PRE vertical drift may arise from external forcing due to (1) upward propagating atmospheric waves (gravity waves, planetary/Kelvin waves or modulated tidal modes) that can modify the evening prereversal electric field (e.g., Abdu et al., 2006; Takahashi et al., 2009), or (2) disturbance time magnetosphere–ionosphere coupling when penetration electric fields and/or disturbance dynamo electric fields may dominate the low latitude ionosphere with their polarities in phase or anti-phase with the prereversal electric field (Abdu et al., 2003, 2009). In case (2), which is of our specific concern in this paper, we consider mainly the effects arising from penetration electric fields occurring due to under-shielding or over-shielding conditions representing a substorm/storm development and recovery phases, respectively, (see, for example, Kelley, 1989). Normally a southward turning of the interplanetary magnetic field component Bz is followed by auroral electrojet intensification accompanied by establishment of the Region 1 field-aligned current (R1 FAC), marking a storm/substorm development. The magnetospheric convection electric field (that is, the interplanetary electric field mapped onto high latitude) then promptly penetrates to equatorial latitude as an under-shielding electric field (PPEF) that has its polarity directed dawn-to-dusk. The subsequent development of the Region 2 FAC at a timescale of 20–30 min then provides the shielding layer to balance the convection electric field, so that a following northward turning of the Bz marking (usually) the substorm recovery, as indicated by a decay in the auroral electrojet, results in the penetration of an over-shielding electric field (OSEF) to equatorial latitudes that has its polarity directed dusk-to-dawn. In other words, an imbalance between the R1 and R2 FACs under a substorm/storm time convection process is the main cause of the PPEF (and hence that of the OSEF). Different mechanisms operate for the propagation of these disturbance electric field to equatorial latitude (see for example, Kikuchi et al., 2000; Senior and Blanc, 1984; Tsunomura, 1999; Spiro et al., 1988). An equatorward extension of the storm/substorm current systems (such as the DP2 current system) may also contribute to the disturbance electric fields observed at equatorial latitudes (e.g., Nishida, 1968; Kikuchi et al., 1996; Abdu et al., 1998). The electric field polarity local time variation based on satellite observational data (Fejer et al., 2008) and modeling results (Senior and Blanc, 1984; Richmond et al., 2003) is characterized by its eastward and westward polarities for the day–evening sector and night sector, respectively, in the case of the PPEF, and of opposite polarity for the OSEF. Huang et al. (2010) have presented statistically a linear relationship between the dusk sector storm time zonal and vertical electric fields at 840 km altitude of the DMSP F13 satellite and the interplanetary electric field as obtained from the IMF Bz data measured by the ACE satellite. In the evening sector, which is of our present interest, (as also in the sunrise sector), in the presence of the longitudinal gradient in the E layer conductivity, the electric fields are more intense than at other local times. These electric fields can therefore enhance or suppress the PRE vertical drift in significant ways as known from some previous studies (e.g., Abdu et al., 2003, 2009). The previous results based on case studies did not, however, address the degree to which the preceding state of the disturbances and related electric fields could constrain/shape the responses to the penetration electric fields leading to the PRE vertical drift modifications. In fact, it has been noticed that the F layer height, in the hours preceding the sunset, (which by itself may be disturbed by a perturbation electric field), could be an indicator of the degree to which the evening PRE vertical drift will be modified in response to a given disturbance electric field. In this paper we address in some detail the nature of the evening vertical drift response, to disturbance electric field originating from under-shielding and over-shielding conditions, and from disturbance dynamo under different conditions of preexisting disturbances and associated electric fields. Digisonde data from the Brazilian equatorial sites of Fortaleza (3.9∘ S, 38.45∘ W; dip angle: −9∘) and Sao Luis (2.33∘ S, 44.2∘ W; dip angle: −0.5∘) are analyzed to examine the nature of the responses by F layer heights at fixed plasma frequencies, and vertical drifts derived therefrom, to penetration electric fields occurring in the evening hours and under different phases and degrees of magnetic disturbances.
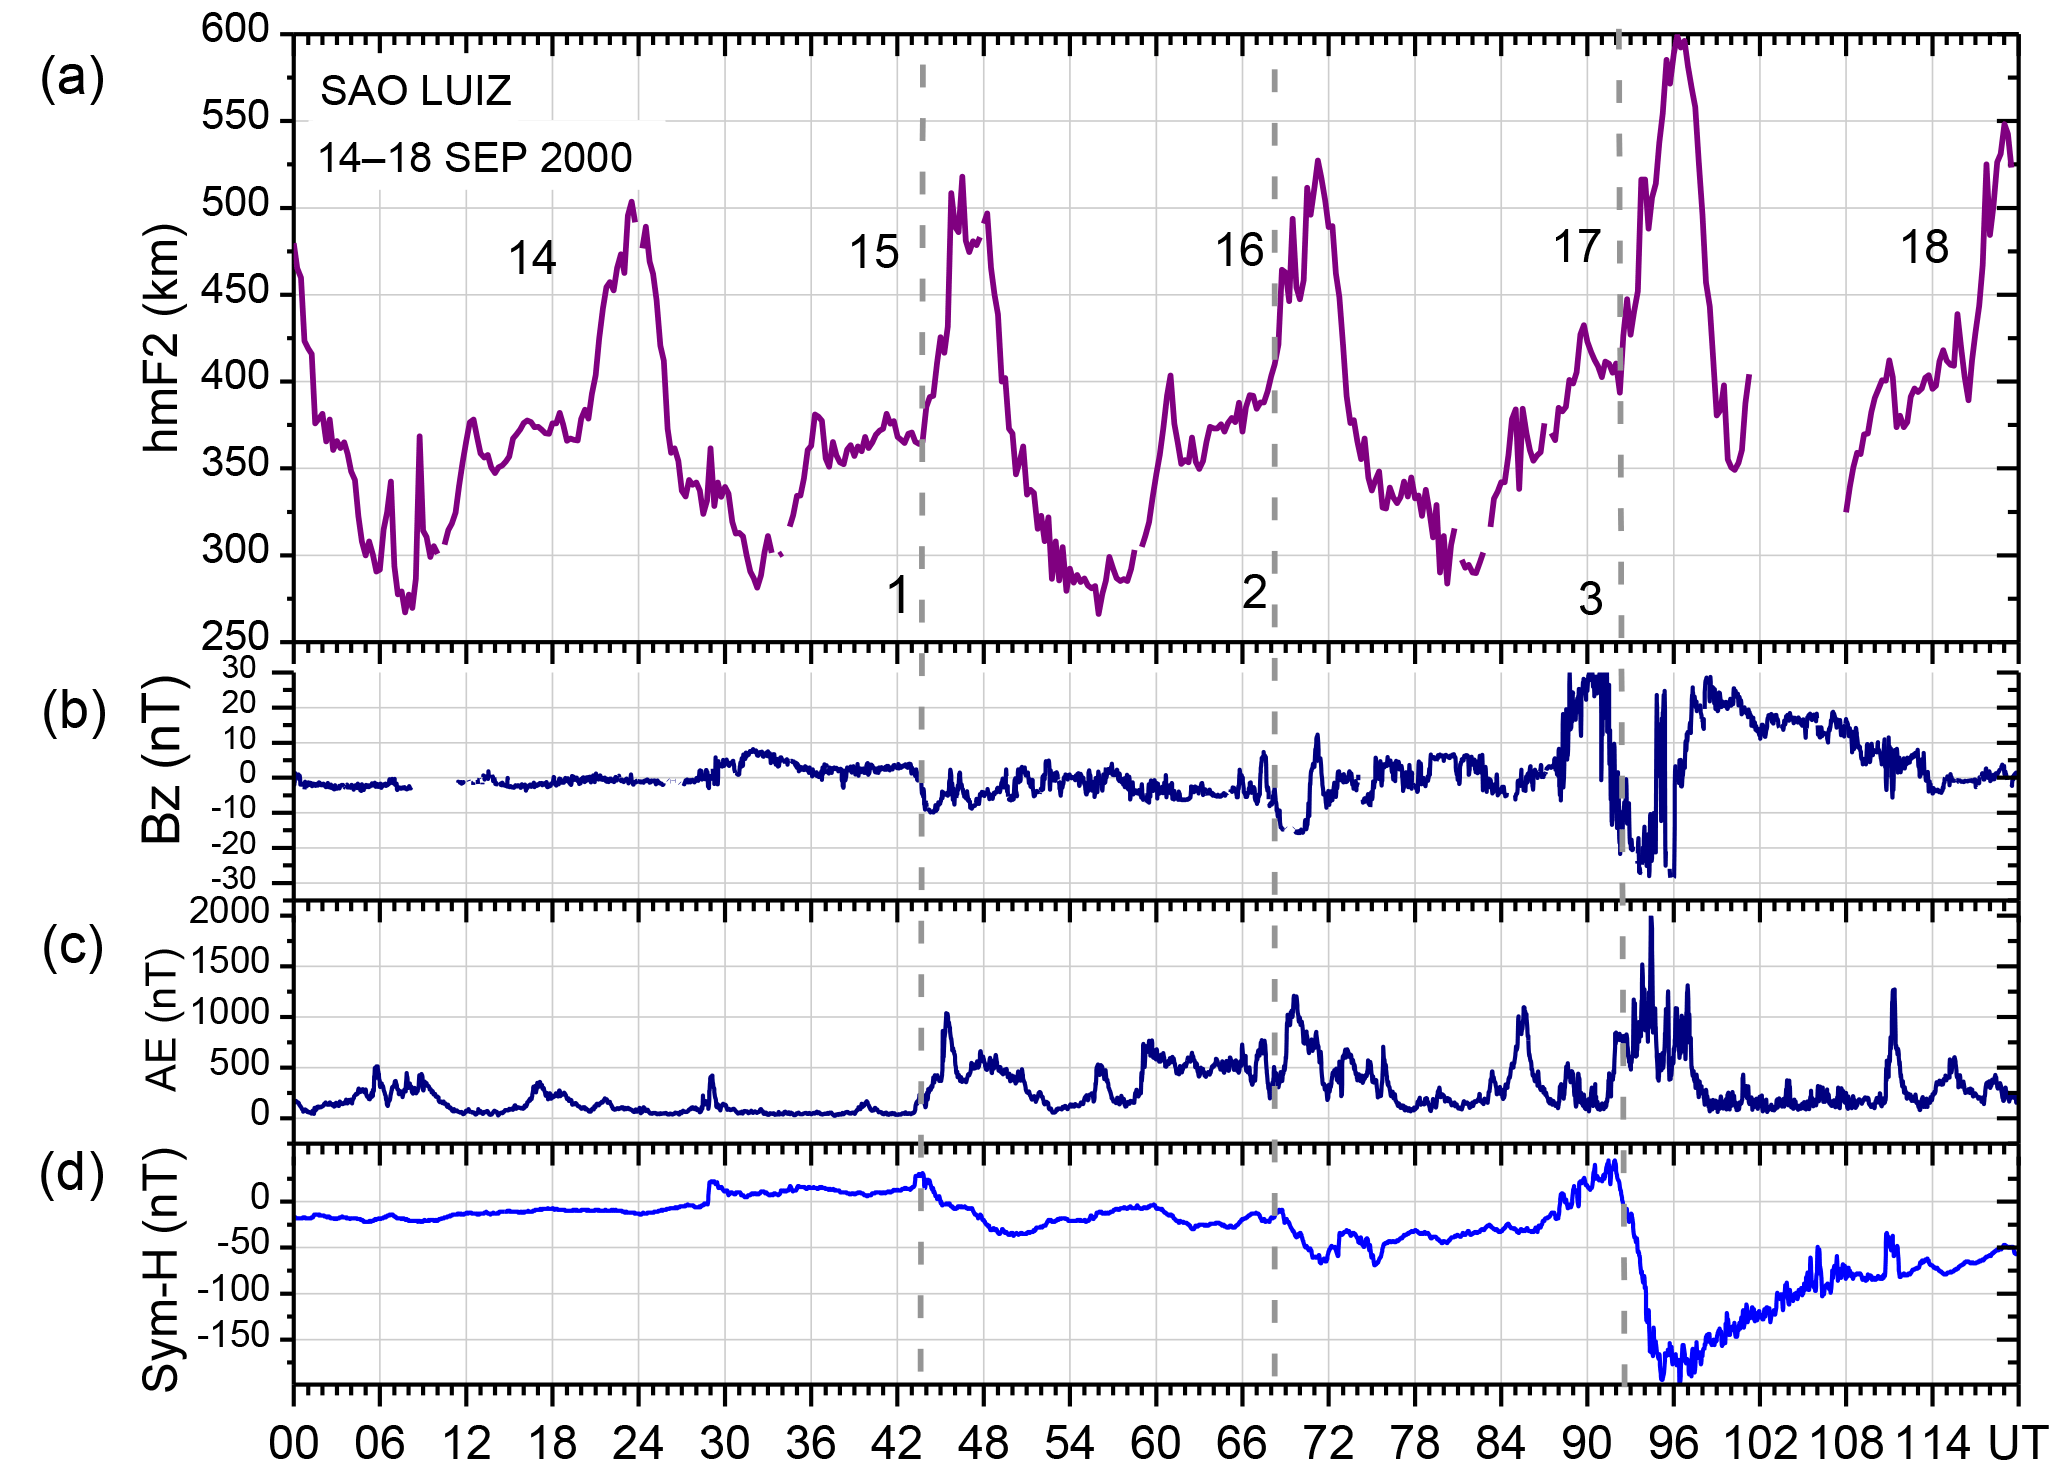
Figure 1hmF2 variations over Sao Luis on 14, 15, 16 and 17 September 2000 (a). The variations in Bz (b), AE index (c) and Asy-H/Dst (d), for the same days.
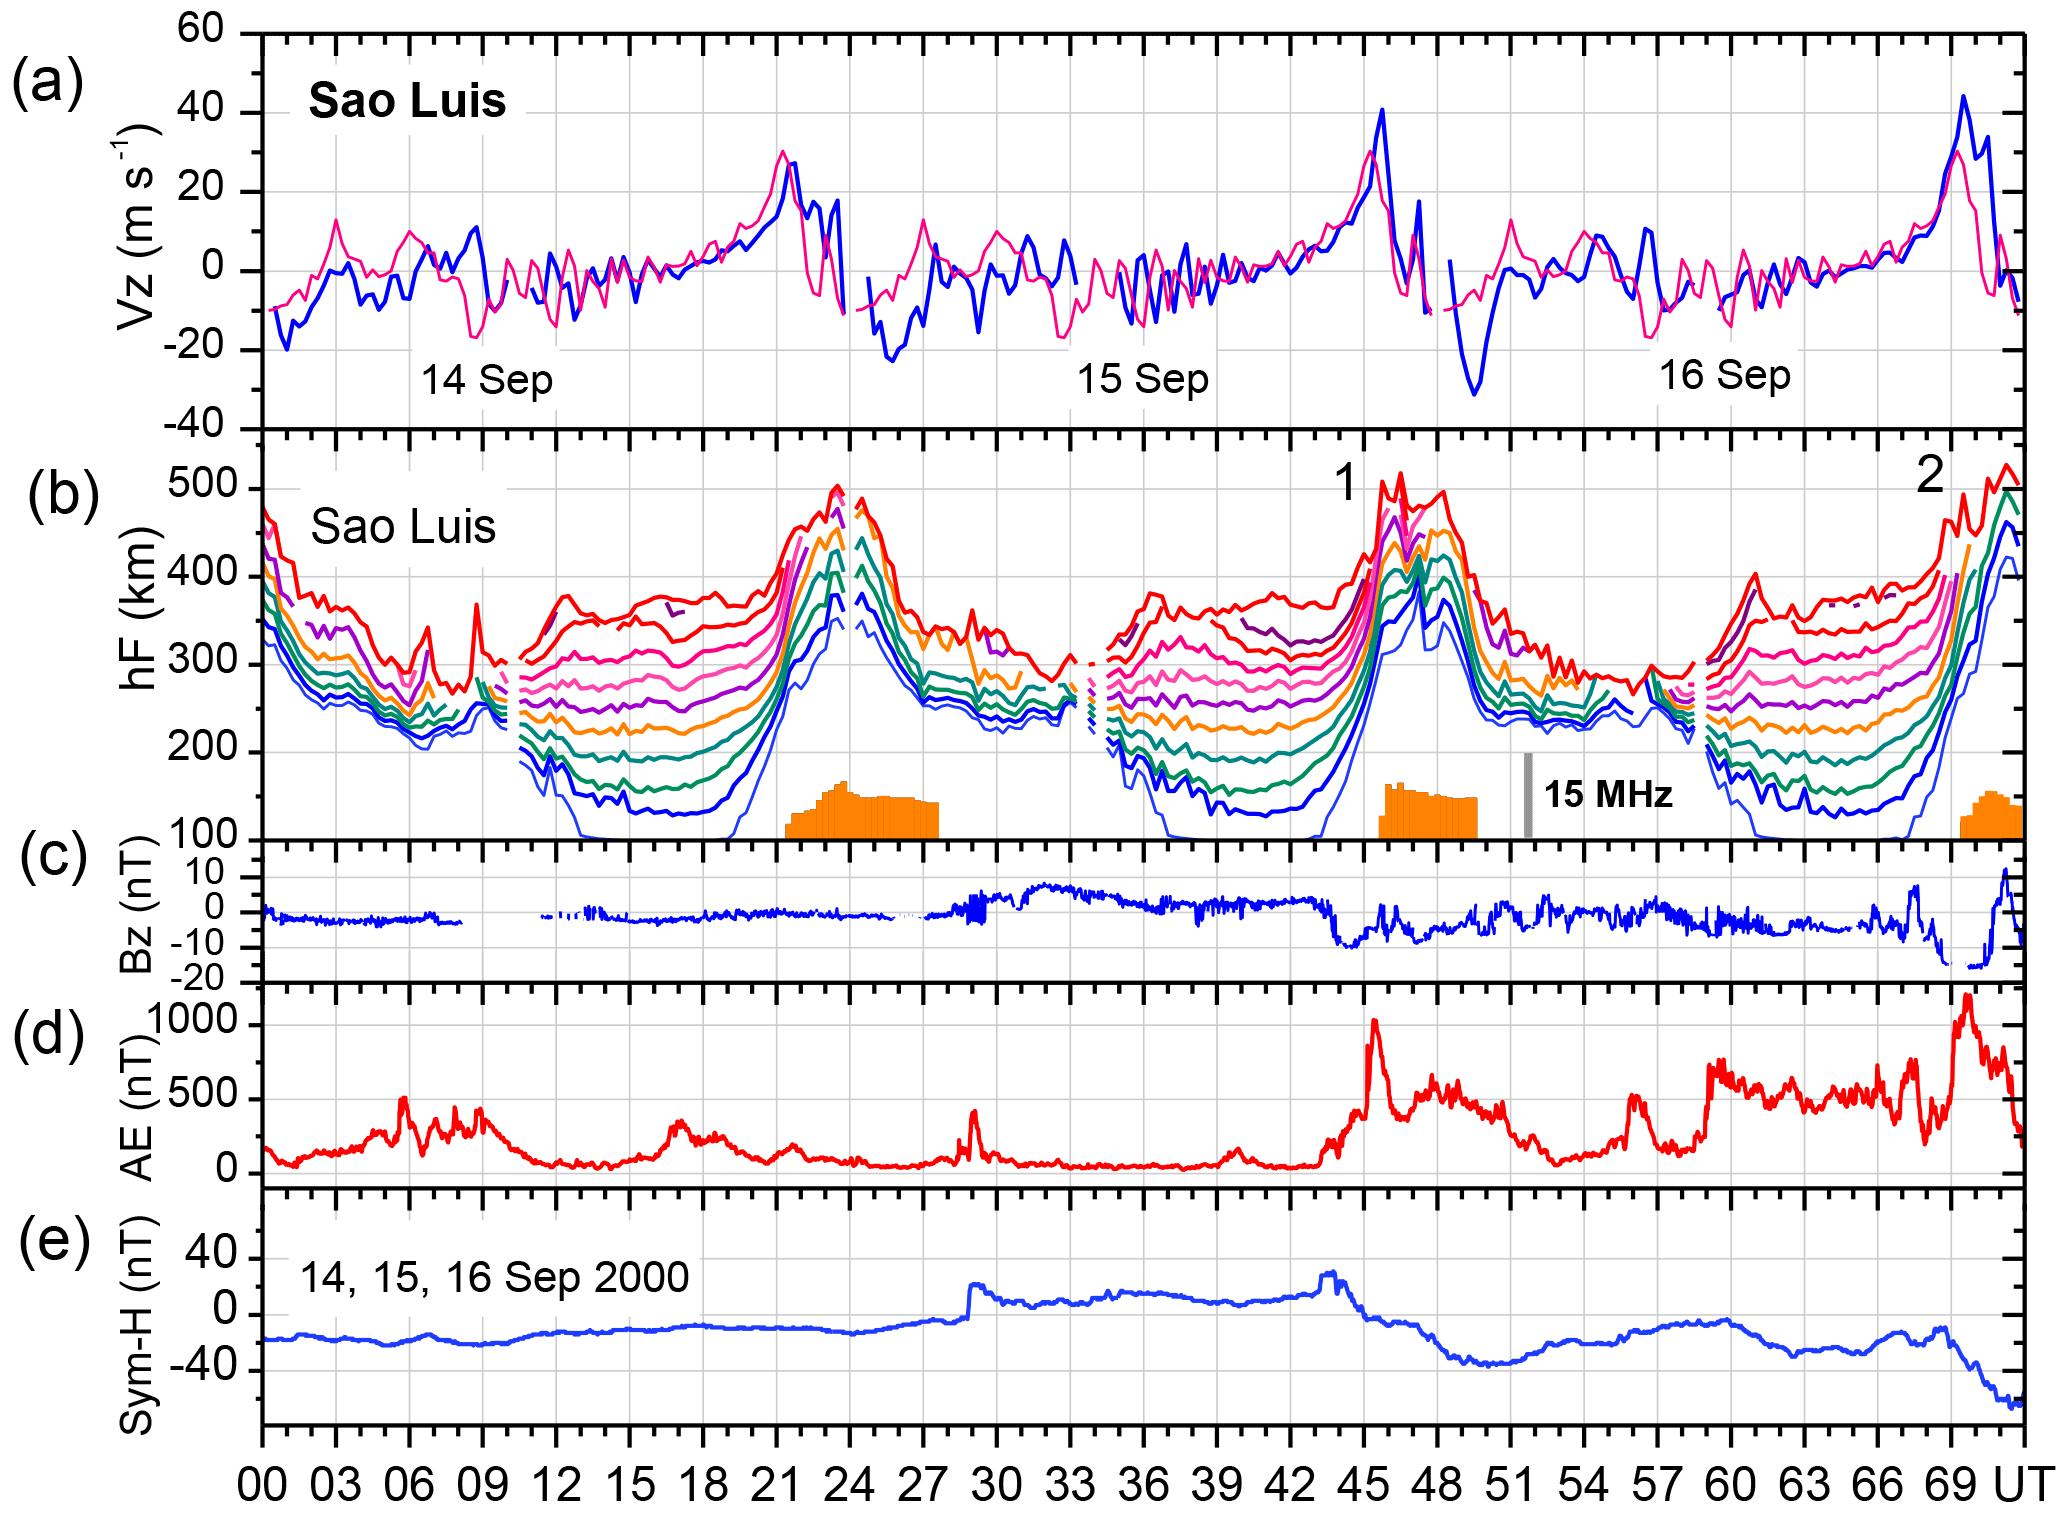
Figure 2Panels from top to bottom show variations in the following parameters during 14–16 September 2000: (a) the vertical drift (Vz) obtained as mean of those calculated as dhF∕dt at four plasma frequencies, 4 MHz, 5, 6, and 7 MHz (blue curve) and a representative quiet day Vz variation (pink curve); (b) the F layer heights at fixed plasma frequencies at 1 MHz interval from 3 to 12 MHz (color coded), and the fop parameter (in orange) indicative of the spread F intensity, in MHz (scale inset); and (c) Interplanetary magnetic field component Bz, (d) the auroral activity index AE; and (e) the Sym-H/Dst index at 1 min interval. Please note that the UT on the x axis is cumulative with increasing number of days.
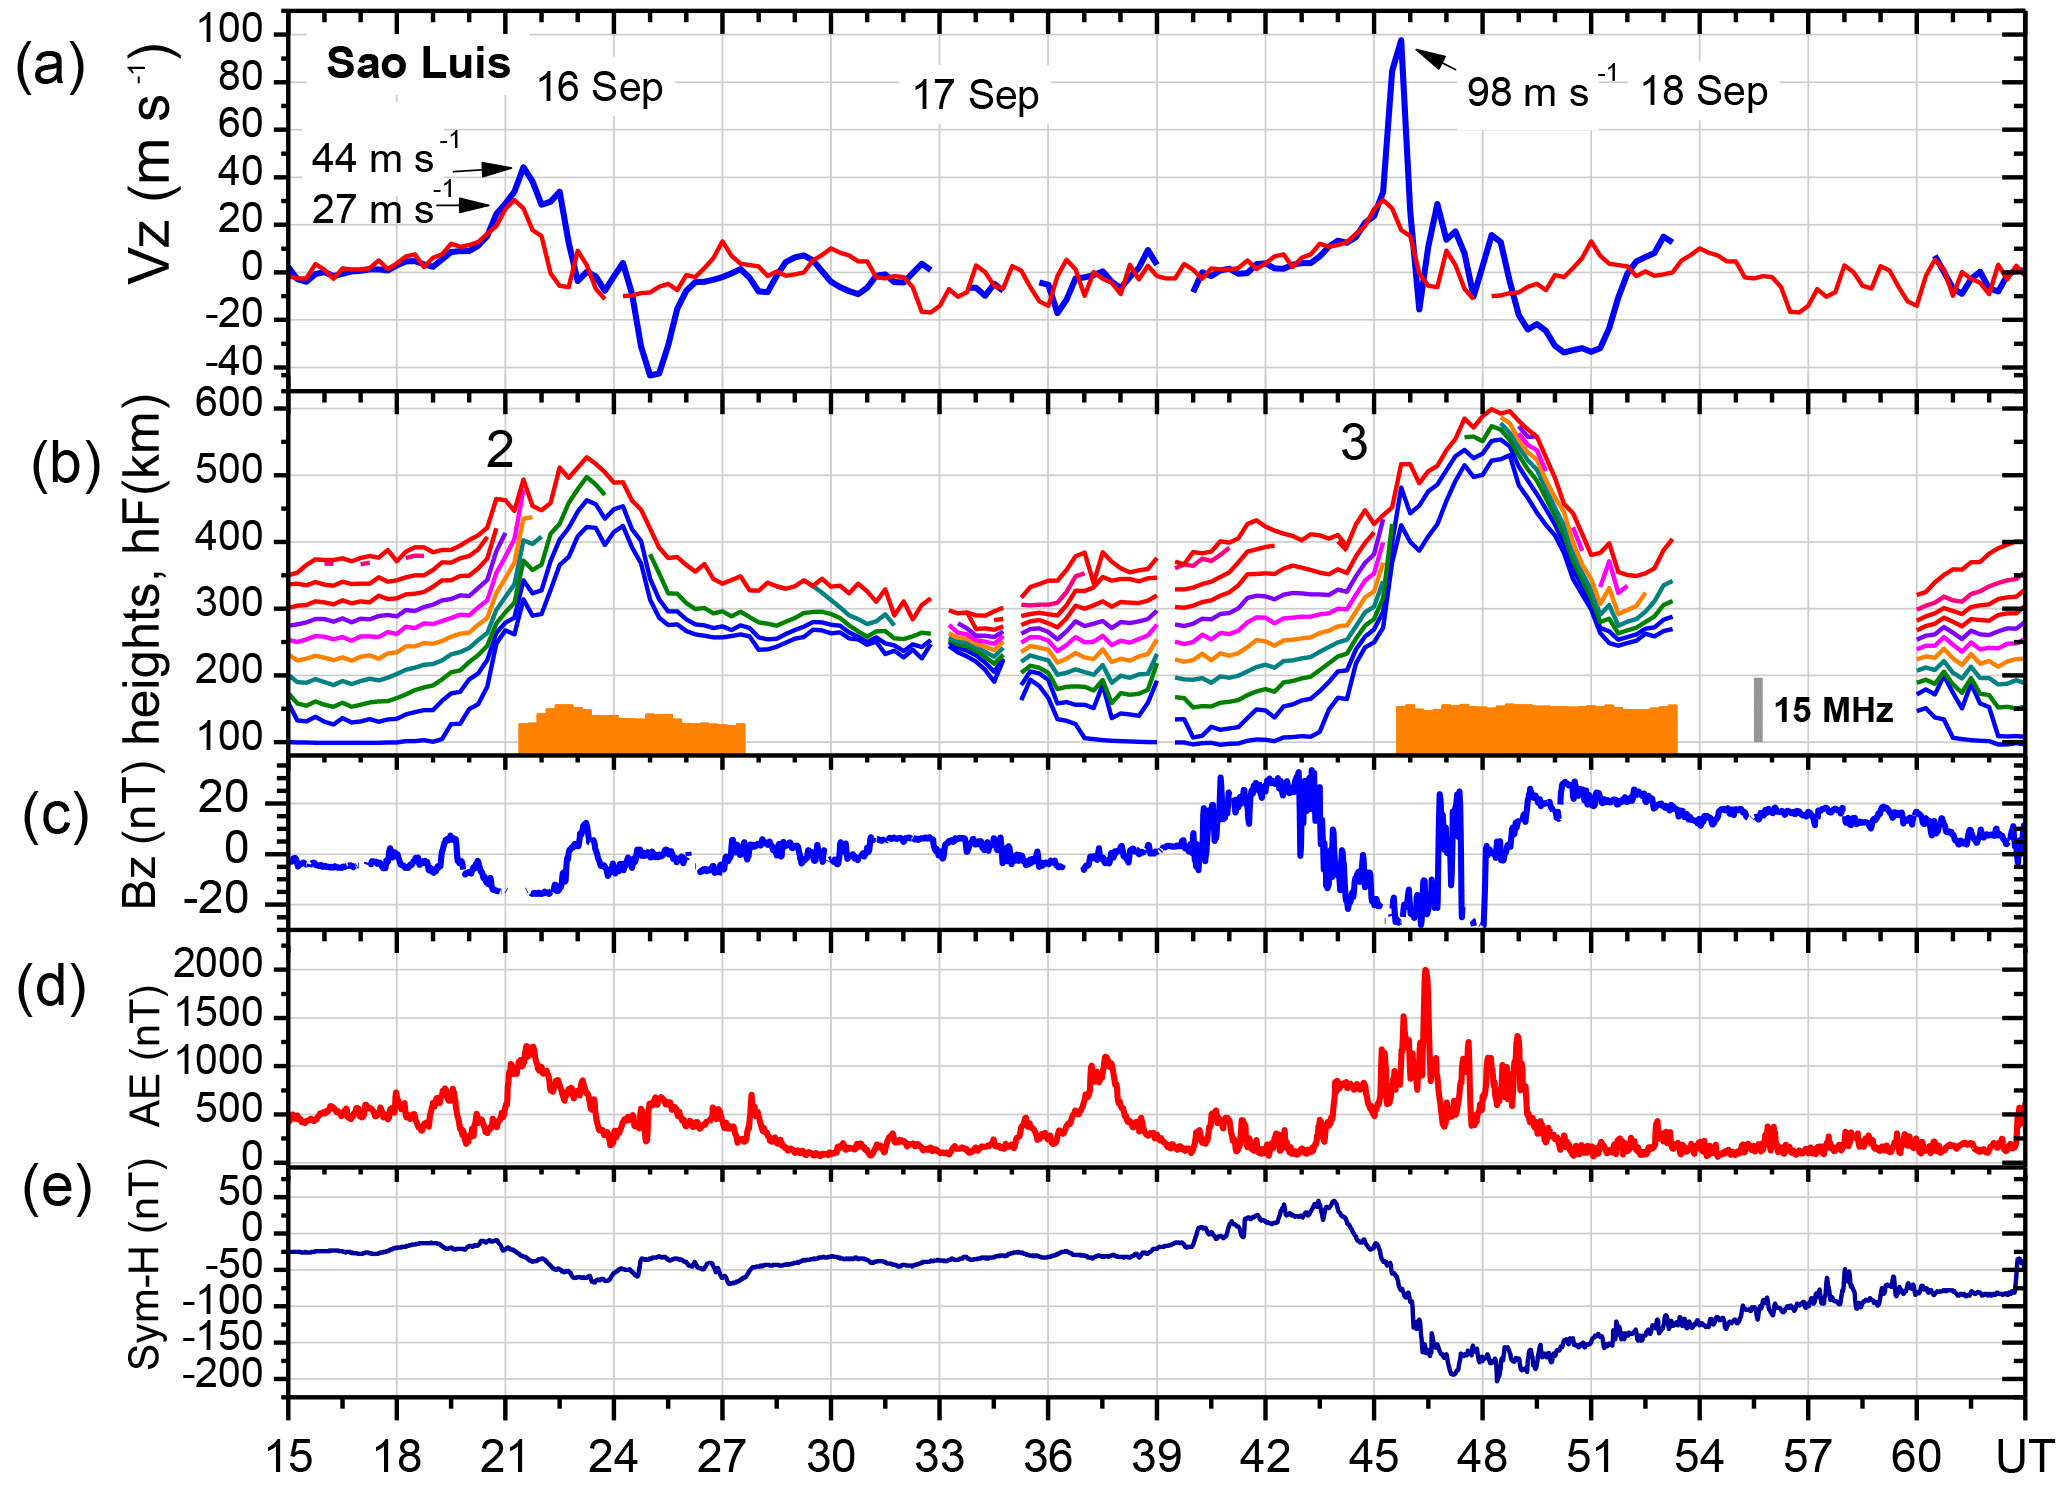
Figure 3Panels from top to bottom show variations in the following parameters during 16–18 September 2000: (a) the vertical drift (Vz; blue curve) obtained as mean of those calculated at four plasma frequencies, 4, 5, 6, and 7 MHz, with the quiet day reference curve shown in pink. The digisonde data are taken at 15 min cadence. The Vz values (blue curve) plotted are smoothed values representing 4-point running mean. There is a break in the data between 02:30 and 09:00 LT; (b) the F layer heights at fixed plasma frequencies at 1 MHz interval from 3 to 12 MHz (color coded) and the fop parameter (in orange) indicative of the spread F intensity in MHz (scale inset); (c) The interplanetary magnetic field z component, Bz; (d) the auroral activity index AE; (e) the Sym-H/Dst index at 1 min interval. Please note that the UT on the x axis is cumulative with increasing number of days.
2.1 PRE vertical drift enhancement due to under-shielding E field
In order to understand the nature of the effect of the PPEF on the evening PRE vertical drift, we will examine some cases of the relationship between them for varying intensity of the PPEF. In Fig. 1 we present an interesting sequence of events to illustrate the connection between penetration electric field occurring in the evening sector and its impact on the PRE to be discussed in more detail also using Figs. 2 and 3 to follow. Figure 1 shows the hmF2 variation during a 5-day interval that begins with a quiet day, 14 September 2000. The corresponding variations in the interplanetary magnetic field (Bz), the auroral electrojet (AE) and the Sym-H indices are shown in the lower three panels (respectively descending from the top). The Sym-H is the high-resolution (1 min values) version of the Dst index (Wanliss and Showalter, 2006), which we have used everywhere. The Bz turned south, accompanied with corresponding onsets of activities in AE and Sym-H, just preceding the sunset time (that is, the PRE development time) interestingly, at about the same local time in all three evenings (of 15, 16 and 17 September). It may be noted that the Bz south intensity (immediately after its southward turning) was around −10, −15 and −25 nT, respectively, on the successive evenings, with correspondingly more intense activity levels in the AE and Sym-H indices as well. The vertical lines 1, 2 and 3 on 15, 16 and 17 September, respectively, indicate these features. The substorm/storm developments represented by these onset phases should be associated with equatorward penetration of under-shielding electric field of eastward polarity, (see for example, Kikuchi et al., 2000) and as a gross indicator of the effect of this eastward PPEF we may note that post-sunset hmF2 peaks are systematically larger on these successive days (going from 15 to 17 September). This may be reckoned as the consequence of the fact that the post-sunset hmF2 peak reflects the intensity of the PRE vertical drift.
For further details, we show in Fig. 2 the relationships among the PRE vertical drift, the F layer heights, and spread F, under the presence of any PPEF indicated by the Bz, AE and Sym-H activities, during the interval 14–16 September. The F layer height variations are shown using isolines of heights at a number of sequential plasma frequencies (from 3 to 12 MHz), and the spread F occurrence is plotted using the parameter fop, the top frequency of the spread F (SF) trace in the ionogram, which is indicative of the SF intensity (Abdu et al., 2012). We may point out that the F layer vertical drift was calculated as from the digisonde data, which is a valid representation of the true vertical drift when the hF values are near and above 300 km (Bittencourt and Abdu, 1981). On 14 September, a quiet day, the PRE vertical drift reached a peak of 27 m s−1 at 18:30 LT (21:30 UT), and post-sunset spread F developed on this evening. As compared to this, on the evening of 15 September, magnetic activity set in, with Bz turning south at ∼ 20 UT (17 LT; see also, Fig. 1). A rapid intensification of the AE (to 1000 nT) at 18:00 LT (21:00 UT), under the Bz south condition, was a clear indicator of a PPEF of eastward polarity that caused a more rapid F layer rise, with correspondingly larger PRE vertical drift on this evening (than on the previous evening), indicated by “1”. This occurred at the time of the development of the normal PRE vertical drift, which therefore is seen enhanced by about 13 m s−1 compared to its value on the previous evening, the PRE vertical drift on this evening peaking at 40 m s−1. Spread F developed promptly and appears to have grown faster in intensity, but its duration was shorter (than on the previous evening), which was perhaps the result of a faster decrease in the PRE drift (from its peak), arising from a rapid decay in the AE activity.
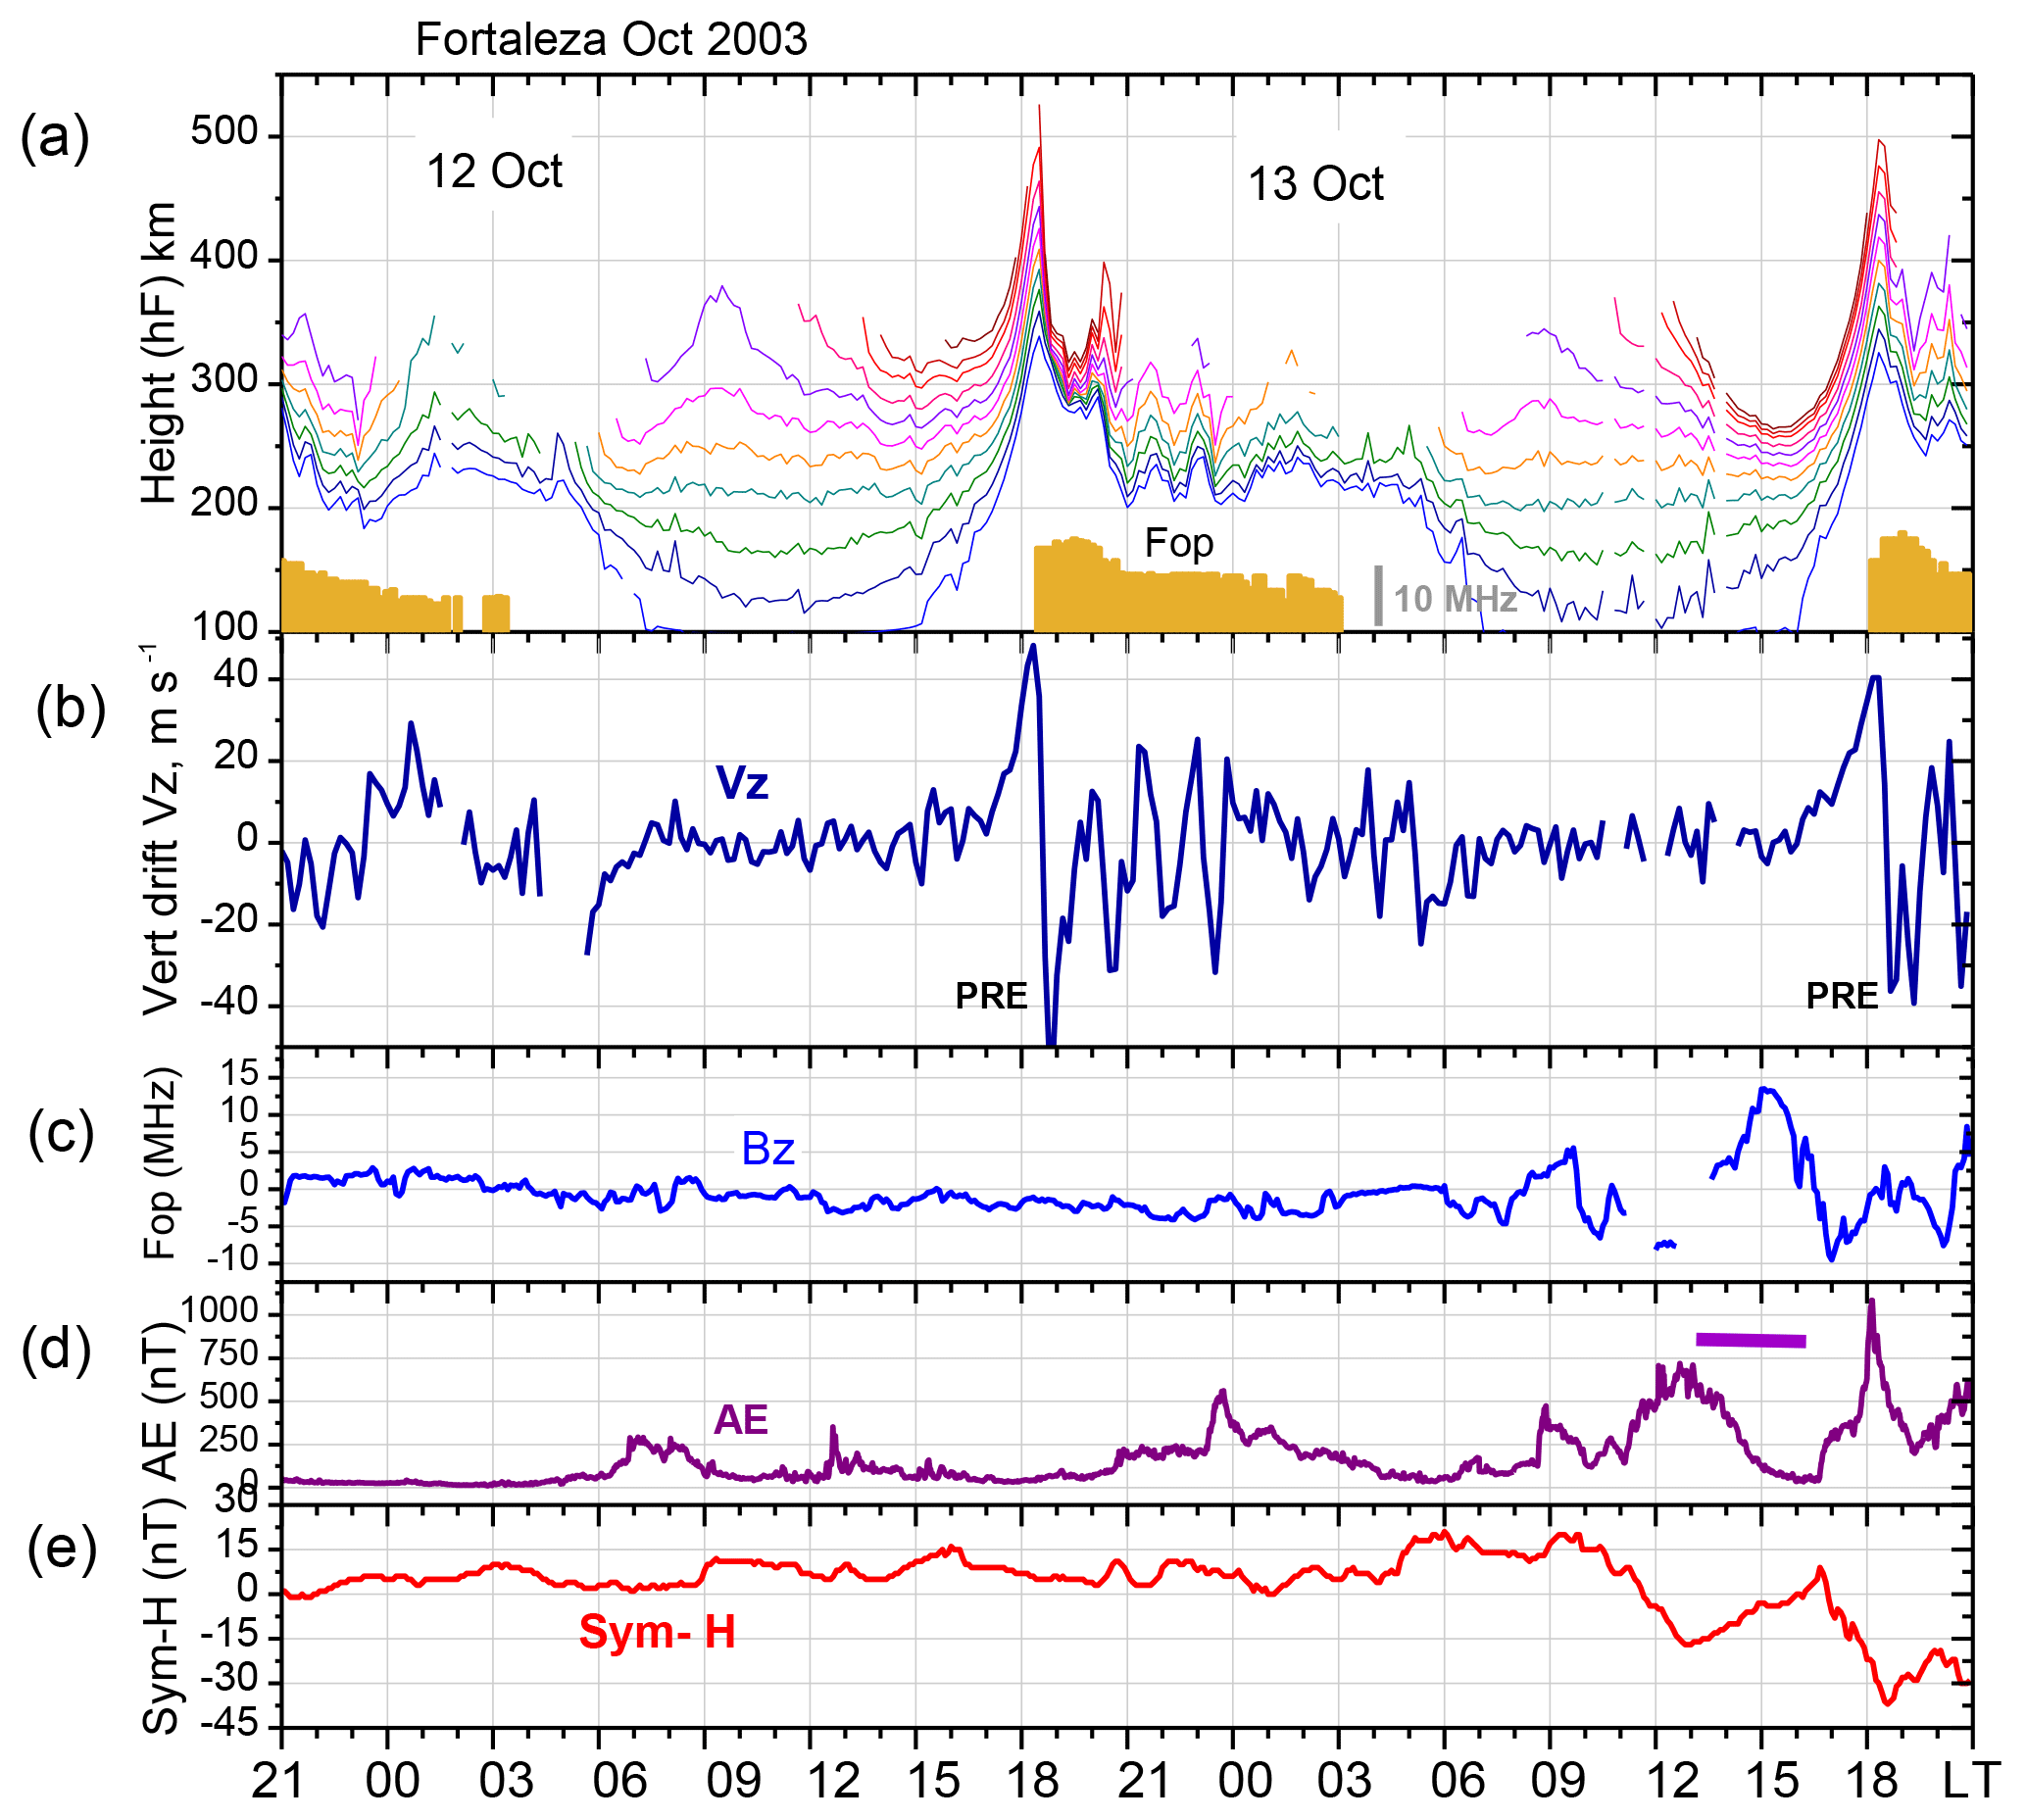
Figure 4Variations during 12–13 October 2003 in the ionospheric parameters over Fortaleza and magnetic field/indices variations in panels from top to bottom: (a) F layer heights at fixed plasma frequencies, from 3 to 13 MHz, and Spread F index fop, the top frequency of the spread F trace in the ionogram in MHz with scale shown inset; (b) Vertical drift as mean of the drifts calculated at 4, 5, 6 and 7 MHz; (c) the interplanetary magnetic field component Bz; (d) Auroral electrojet activity index AE; (e) The Sym-H representing 1 min Dst values.
Moderate disturbances as indicated by Bz southward fluctuations, with AE intensifications and a mild decrease in Sym-H, indicative of a very weak magnetic storm (although marginally qualified to be characterized as such in most part) continued through 16 September, the last day in Fig. 2, and shown also in the beginning of Fig. 3. We may note that Bz south was more intense (−15 nT) on this evening, with the corresponding AE intensification also being larger. This occurred at the time of the normal PRE development, and therefore the associated under-shielding PPEF of eastward polarity contributed to an enhanced PRE vertical drift, which peaked at 44 m s−1, that is, 17 m s−1 higher than its quiet time value of 27 m s−1; this increase in the PRE corresponded to a PPEF of 0.4 mV m−1. Compared to this, the PPEF that contributed to the enhanced PRE on the previous evening (15 September) was 0.3 mV m−1 when the Bz south was only ∼ 10 nT.
Relatively low-to-moderate intensity disturbance continued on to the next day until about 19:00 UT (on 17 September) when an intense storm began to develop with the Bz turning south accompanied by AE activity intensification and rapid Sym-H decrease starting at ∼ 20 UT (17 LT) just prior to the development of the normal PRE vertical drift (in a sequence very similar to that of the previous two evenings). On this evening the Bz south reached a minimum of ∼ −20 nT, with the Sym-H decreasing to ∼ −180 nT). A strong under-shielding PPEF of eastward polarity associated with the storm development contributed to a large increase in PRE vertical drift that attained a peak value of about 100 m s−1. The intensity of the eastward PPEF in this case was ∼ 1.8 mV m−1. The spread F intensity represented by the parameter fop is also shown in the figure (second panel from top). We note that the spread F is more intense and longer lasting (though interrupted by data break) following the disturbance-induced and extremely large PRE vertical drift that marked this evening (17 September).
A comparison of these unique results on the three evenings in Figs. 2 and 3 reveals an important behavioral feature of the disturbance time PRE/ESF development, that is, the larger the intensity of the magnetic disturbance (as judged from the magnitudes of the Bz south, AE intensification and Sym-H decrease the more intense is the PPEF with associated larger increase in the evening vertical drift. This is the first time that a positive control of the PRE vertical by increasing intensity of under-shielding PPEF of eastward polarity (in the post-sunset hours) is being presented. Corresponding to the increased PRE intensity the spread F was also generally more intense although a clear proportionality between them could not be established, which is to be expected since the ESF instability growth would depend also upon factors other than vertical drift, such as the precursor background conditions and seed perturbations in the form of wave structure in the plasma density and polarization electric field (Tsunoda, 2012; Abdu et al., 2015).
It may be noted further that during the pre-sunset hours, that is, during the hours immediately preceding the occurrence of the PPEF, the F layer height variations represented by the isolines at fixed plasma frequencies were very similar on all five days. We will show below that a notable difference in the F layer heights (on a day-to-day basis) during hours preceding the PRE, especially around 15:00 to 18:00 LT, can be an indicator of a corresponding difference in amplitude of the PRE vertical drift to follow under the influence of a disturbance electric field.
Figure 4 shows the variations in F layer heights at fixed plasma frequencies (from 3 to 13 MHz), the spread F parameter fop, the vertical drift Vz (similar to that presented in Figs. 2 and 3) over Fortaleza, the auroral activity index AE, the IMF-Bz, and the Sym-H index during 12 and 13 October 2003. We may note that 12 October was practically a quiet day, with only very weak auroral activity (the AE intensifications not exceeding 250 nT). The evening PRE vertical drift peaked at ∼ 45 m s−1 at 18:20 LT that was followed by intense post-sunset spread F activity (as can be noted from the fop values). In contrast to this, day 13 was fairly disturbed with moderate AE activity, the Bz showing only very weak southward excursions and positive Sym-H fluctuations until about 09:00 LT. The Bz turned south at ∼ 10 LT that was promptly accompanied by AE intensification and Sym-H decrease, indicating the onset of a substorm that soon recovered with Bz turning north followed by AE and Sym-H recovering by ∼ 15–16 LT. Then a further Bz turning south (by −10 nT) at ∼ 16:30 LT was followed by rapid intensifications in both the AE and Sym-H that reached their peak intensities near 18 LT, close to the time of the normal PRE vertical drift peak. A PPEF of eastward polarity should be associated with these rapid increases in AE and Sym-H intensities, which in turn should have contributed to enhance the amplitude of the PRE vertical drift. However, we note that the PRE peak on this evening was smaller, by 10 m s−1, than on the previous day (that was a quiet day). In this context we note that the AE activity that peaked near 13 LT (at 750 nT) decayed rapidly to reach zero by ∼ 16–17 LT, which was accompanied by Bz increasing north and Sym-H recovery as well (indicated by a horizontal bar), a situation that indicates the presence of an over-shielding electric field of westward polarity. This westward electric field was responsible for the lowering of the F layer heights during this period, clearly noticeable in comparison with their values on the previous day (in top panel). (For example, at ∼ 16 LT the F layer height at the plasma frequency of 12–13 MHz was less by 80 km on the 13 October as compared to the corresponding value on the 12 October.) The reduction in the PRE drift might appear to be related to the over-shielding westward E field that prevailed in the preceding interval. However, since the over-shielding decay time is around 30 min from the substorm recovery (as shown by Abdu et al., 2017) and the PRE drift peak occurred at ∼ 18 LT, which is about 1.5 h after the completion of AE recovery by around 16 LT, (and therefore later than the expected over-shielding decay time), we need to consider another possible cause for the reduced zonal electric field/vertical drift on this evening. One strong candidate is the disturbance dynamo electric field that may have originated from the AE activity that had started at 07:00 LT (10:00 UT) on this day. The precedence of about 11 h to the PRE peak in this case does meet the requirement for the DDEF development to affect the equatorial region (Blanc and Richmond, 1980; Scherliess and Fejer, 1997), although the intensity of the storm may appear to be marginal for generating DDEF compared to the storm intensities for the cases discussed in the literature (for example see, Scherliess and Fejer, 1997). The rapid AE recovery from its peak at 18:00 LT (when Bz was also recovering from its southward excursion), with associated over-shielding westward electric field, appears to have caused a slightly faster reversal of the vertical drift (than on the previous evening). The effect on the SF (spread F) on the two nights due to the different intensities of PRE vertical drift is not very well defined except that on the night of 12–13 the SF persisted into post-midnight hours till 03:00 LT, whereas on the night of 13–14 it ended near midnight (not shown here).
The above scenario of the response sequence appears to be a good demonstration of how the occurrences of under-shielding electric fields associated with rapid intensification of AE under Bz south conditions and variable Sym-H decreases, all occurring near sunset, can shape the intensity of the evening PRE vertical drift.
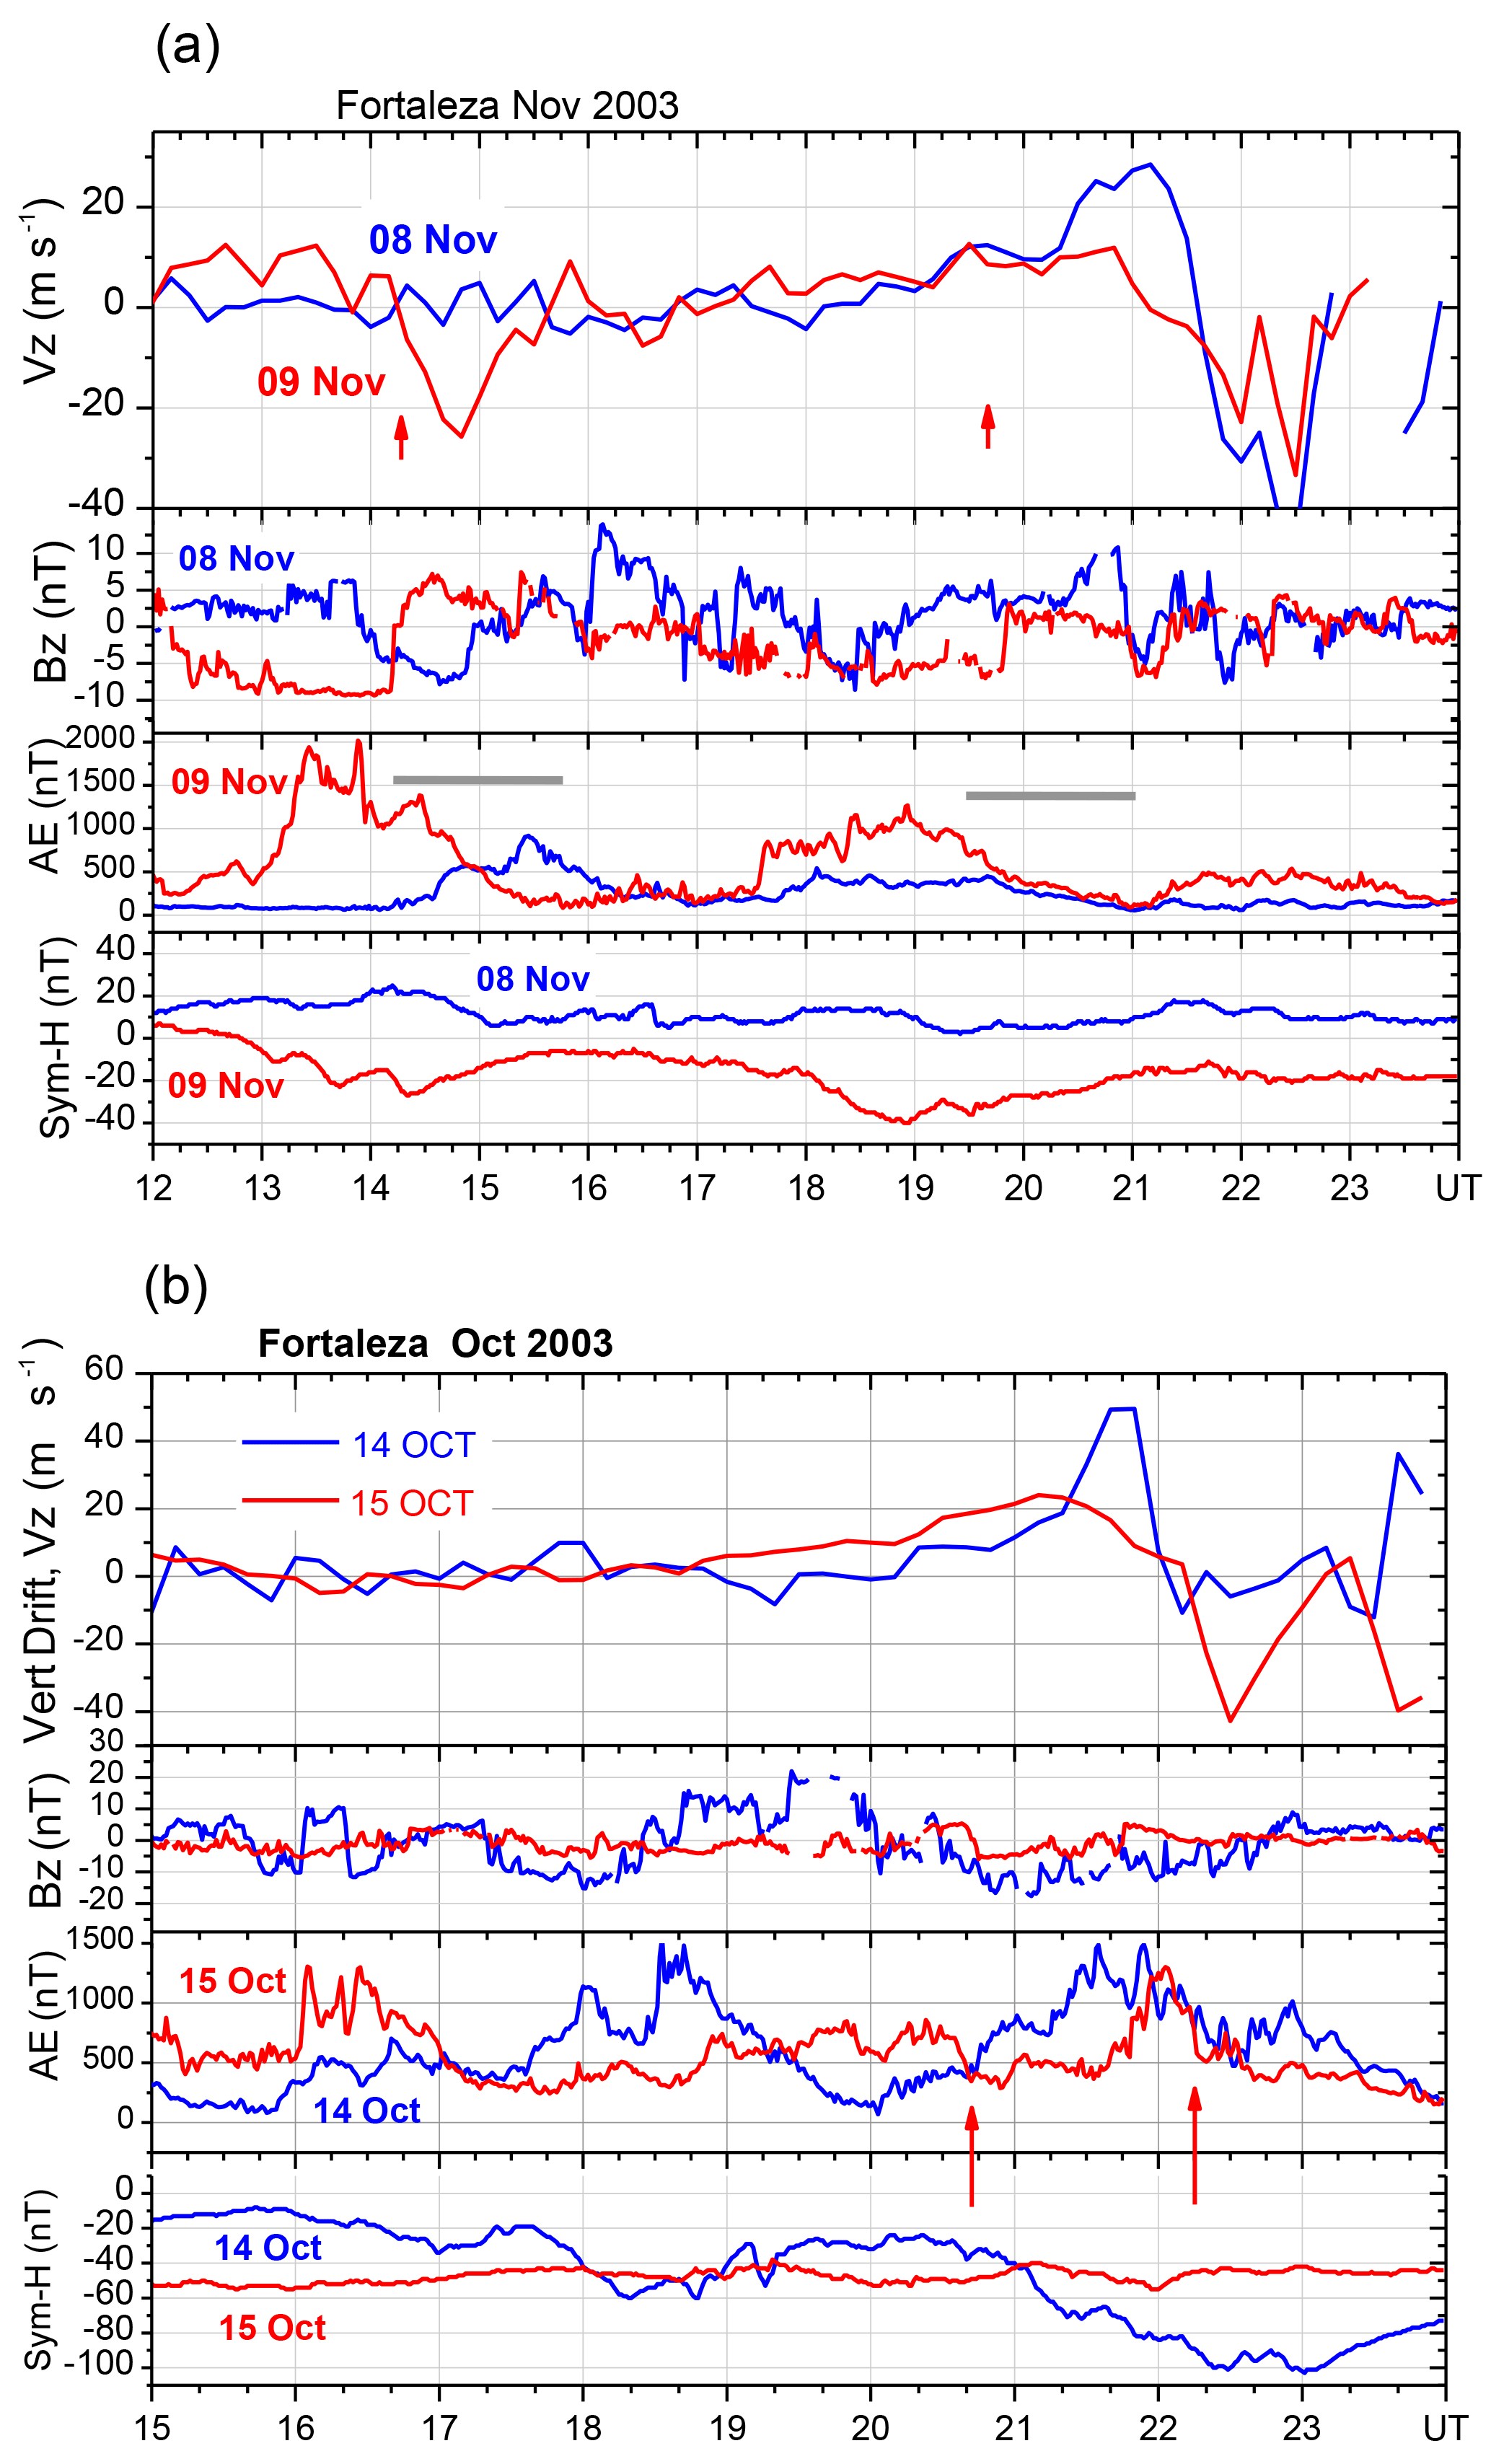
Figure 5(a) The variations during 8 (blue curve) and 9 (red curve) November 2003 in the vertical drift over Fortaleza (top panel); the interplanetary magnetic field component Bz (panel 2); the AE activity index (panel 3); and the Sym-H/Dst index (bottom panel). The dark horizontal bars in panel 3 indicate the approximate durations of the two cases of over-shielding effects on 9 November. (b) The variations during 14 (blue curve) and 15 (red curve) October 2003 in the vertical drift over Fortaleza and the Bz, AE index, and Sym-h/Dst indices, in the same format as in (a). Here the two vertical red arrows indicate the onsets of over-shielding effects on the evening of 15 October.
2.2 PRE vertical drift suppression due to over-shielding E field
The PRE vertical drift velocity may also be modified by over-shielding electric field that may occur at the time of its evening development, which therefore is an important source of its short-term variability. Figure 5 shows two examples of the response of the PRE vertical drift in contrasting situations of over-shielding and under-shielding electric field present at sunset. In Fig. 5a the variations in vertical drift, the Bz, the auroral activity index AE and the Sym-H are compared on two days, 8 and 9 November 2003. On both days, weak to moderate activities in Bz, AE and Sym-H were present in varying degrees during the hours preceding the sunset. The possibility of disturbance dynamo electric field in the evening hours may or may not be present since the intensity of the Sym-H variations (with the required antecedence) was small on one of the days. We note that on 8 November, a quieter day, the PRE vertical drift peaked at close to 30 m s−1 (at 21:15 UT/18:15 LT) that was followed by spread F onset at 21:20 UT (18:20 LT; not shown here). On 9 November, magnetic activity of weak to moderate intensity preceded the sunset hours. Just prior to sunset, the AE activity and the Sym-H presented a recovery during 19:00 UT to 21:00 UT, accompanied by Bz turning north. The over-shielding westward electric field associated with this activity recovery that ended at 21:00 UT (during the PRE development period) appears to have contributed to a near-total suppression of the PRE, in which a possible contribution from disturbance dynamo cannot be completely ruled out. We may note that post-sunset spread F did not develop on this evening. Just for comparison, an example of a rather clear case of a vertical drift reversal to downward due to an over-shielding electric field of westward polarity (associated with the Bz turning north accompanied by recoveries in AE and Sym-H) may be noted near midday (14:00–15:00 UT) on 9 November, indicated by the first vertical red arrow in the top panel of Fig. 5a. The second red arrow marks the beginning of the pre-sunset over-shielding electric field effect explained above.
In the example of Fig. 5b, we note that on 14 October 2003 the PRE vertical drift attained a peak value of 50 m s−1 at 21:50 UT, which was ∼ 30 min later than on a normal (quiet) day as can be verified by comparing with 8 November (Fig. 5a) when the PRE vertical drift peaked at 21:15 UT. It may be noticed that the increase in Vz during the PRE followed, somewhat closely, the form and shape of the AE intensification during the same period (panel 3) that was under (fluctuating) Bz south condition. The larger amplitude of the PRE vertical drift peak, and its 30 min delay, are therefore strong evidence that the PRE was modified by a PPEF of eastward polarity associated with the AE intensification when Bz was southward. In contrast to this, on 15 October, the AE variation presented a decay/recovery starting at 20:40 UT (indicated by an arrow) that was preceded by a weak Bz turning north, but fluctuating as well, just prior to the normal peak time of the PRE. As a result, an associated westward electric field appears to have caused a reduction in the PRE vertical drift that peaked at a significantly smaller value, being close to 25 m s−1 at 21:15 UT on this evening. In this case the post-sunset Spread F had a slightly delayed onset, at 22:00 UT. Additionally we notice that Vz presented an enhanced negative departure centered at 22:30 UT, which appears to be caused by a second episode of over-shielding westward electric field possibly indicated by the AE decrease that occurred at this time (also indicated by an arrow), but without being accompanied by any clear corresponding Bz signature.
The example of the PRE suppression by over-shielding electric field so far discussed above, including some results earlier presented by Abdu et al. (2009), were based on some limited case studies. For further verification we present below the result obtained from a statistical analysis of this effect. Figure 6 shows, in the bottom panel, the variation in the mean of the superposed vertical drifts for a set of 18 days (pink curve) selected on the basis of the AE variation presenting a decay phase in the period immediately preceding the PRE development (just before 20:00 UT/17:00 LT). The corresponding AE variation, obtained as the mean for the selected days, is shown in the middle panel of Fig. 6. The corresponding variation in the SYM-H (also as mean for the 18 days) is shown in the top panel. The quiet time variation in the Vz, as mean of 10 quietest days of the same period (October–December 2003), is also plotted in the figure (blue curve, bottom panel), which shows that the average PRE vertical drift peaked at 35 m s−1. In comparison to this, we note that the average of the PRE vertical drift under the influence of AE decay was only 20 m s−1, showing a decrease by 15 m s−1 from its quiet time value. This result shows that the AE recovery in these cases occurred (before the PRE development) just in time for the associated over-shielding westward electric field to prevail close enough to affect, in anti phase, the growth of the eastward electric field enhancement that characterize the PRE development. The possibility of a disturbance dynamo electric field, also directed westward at this local time, contributing negatively to the PRE vertical drift can be practically ruled out in this case, since we note that the Sym-H value that preceded the sunset hours (of the order of 25 nT) did not represent disturbances intense enough to produce such an electric field.
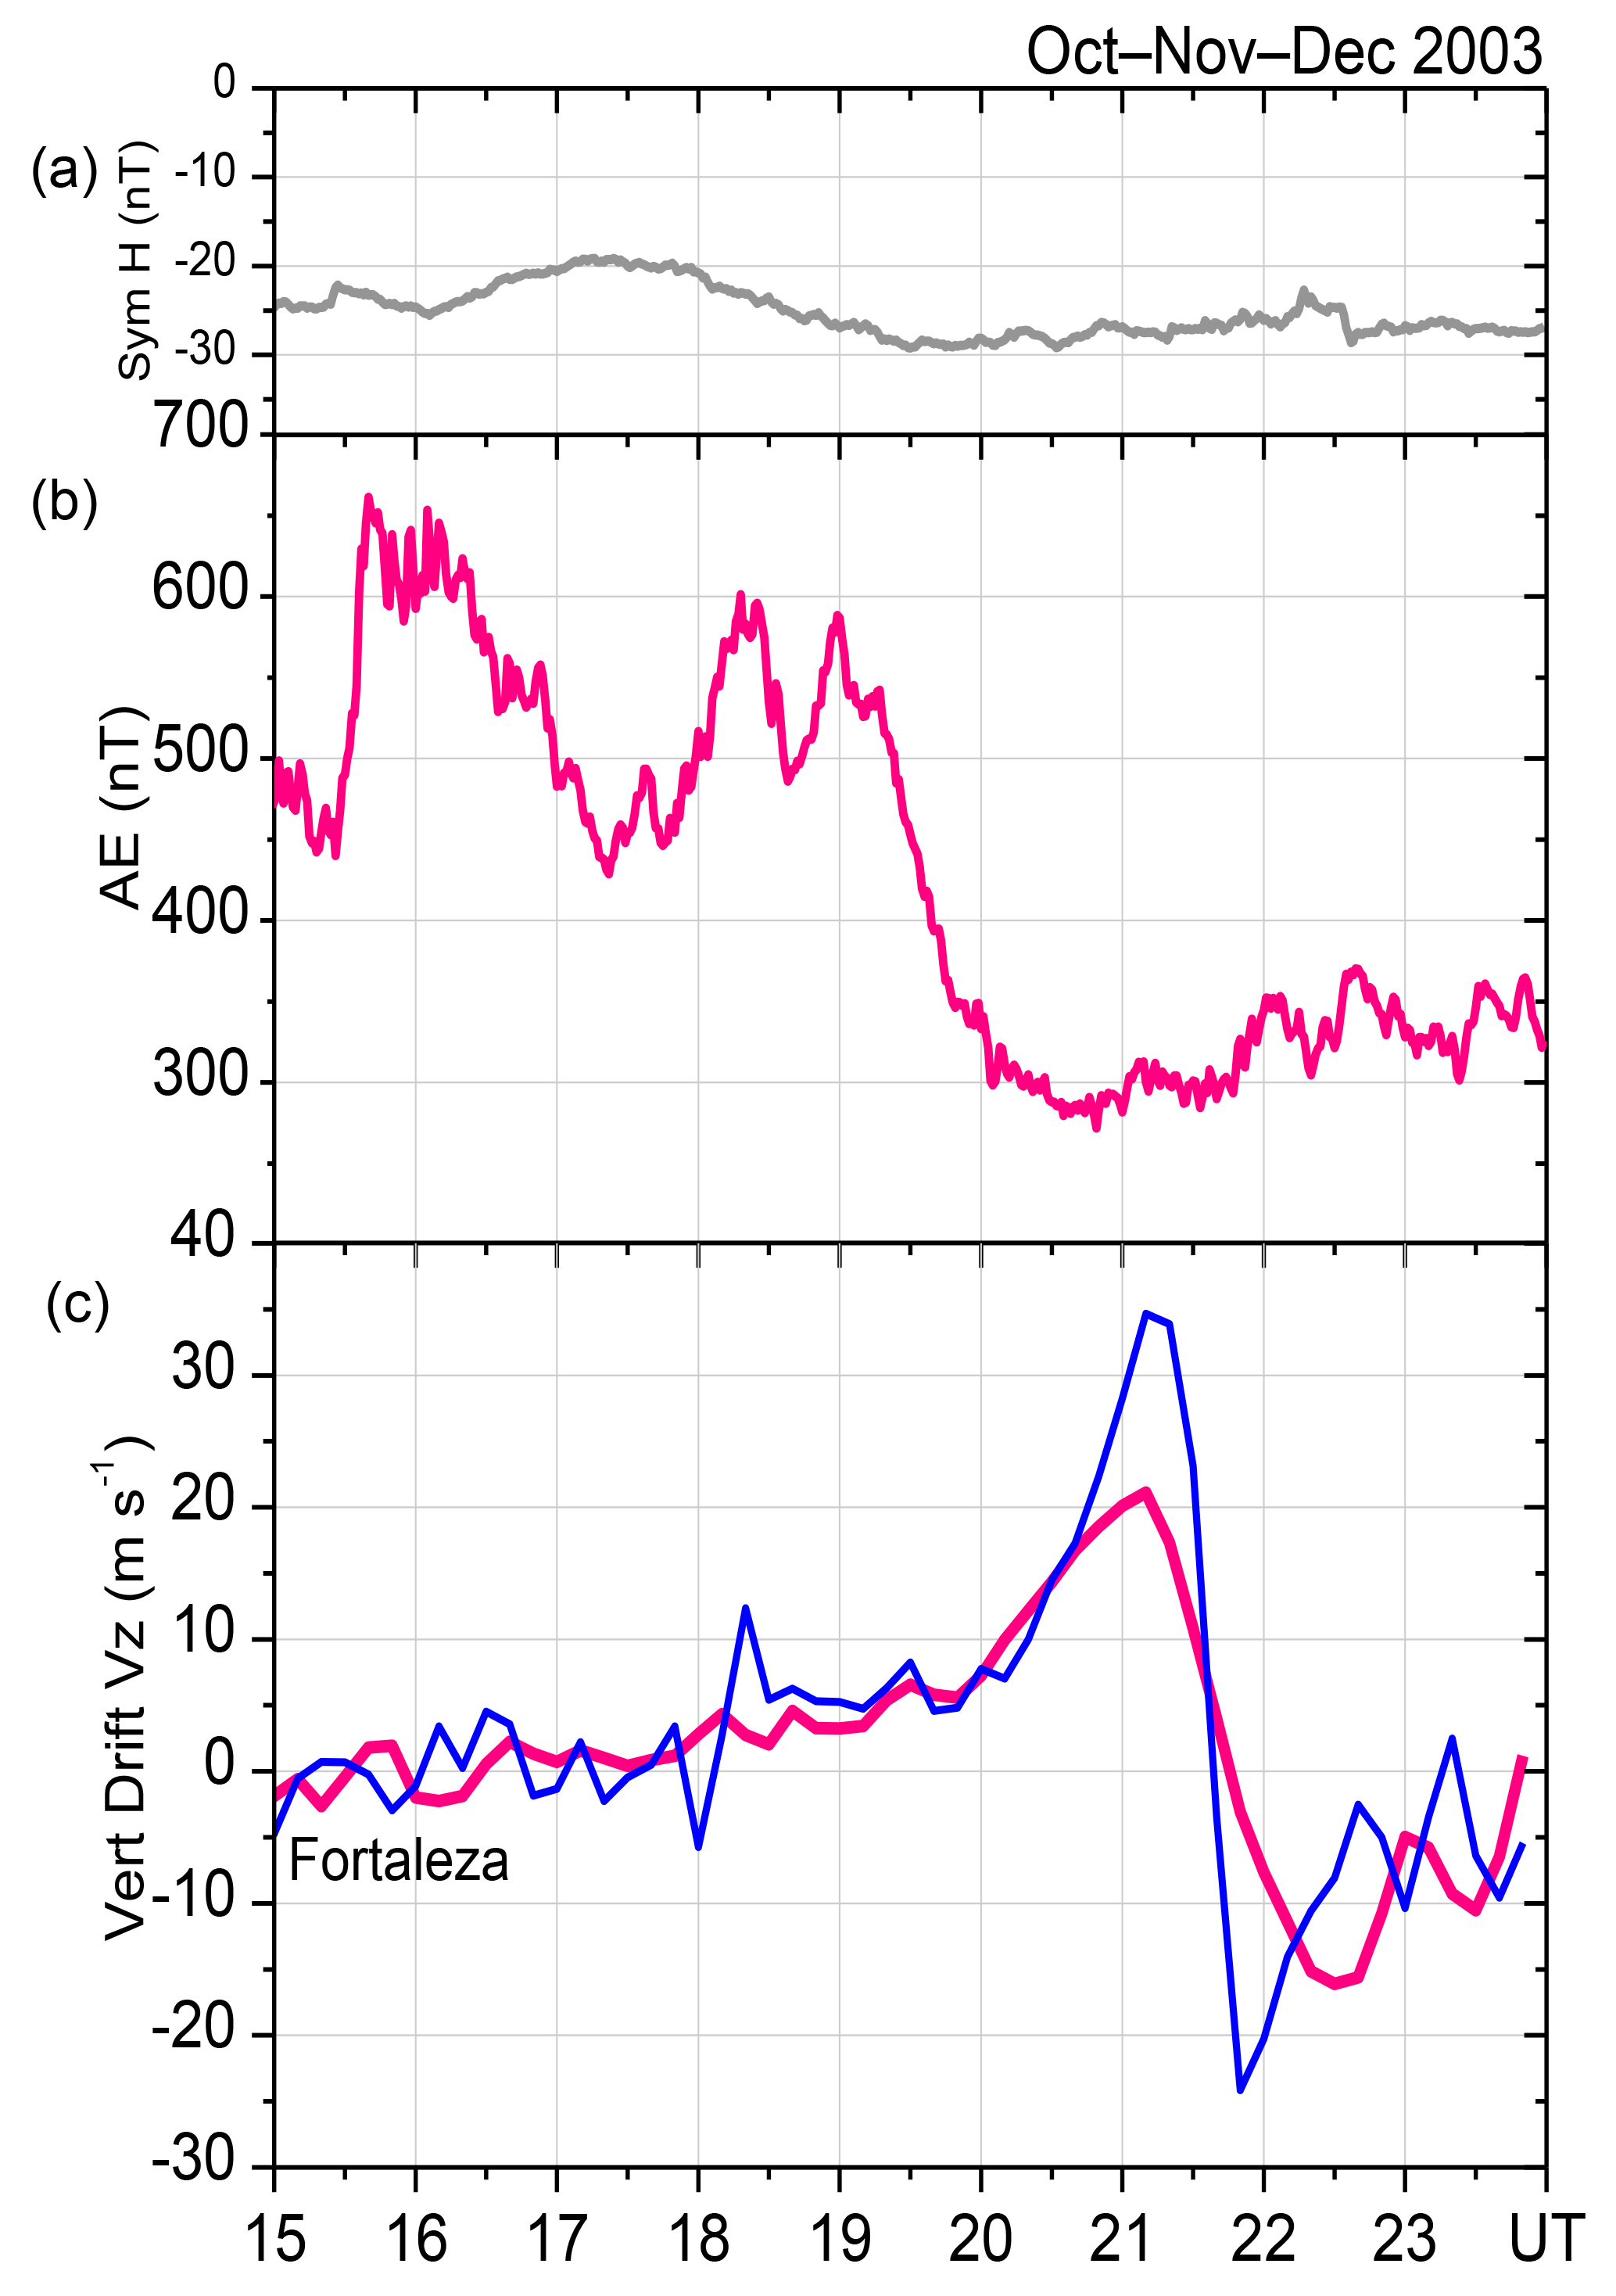
Figure 6The variations in the mean of the superposed values based on 18 days of Vz data over Fortaleza and the corresponding magnetic indices during the periods October, November and December 2003 in: (1) the Sym-H/Dst (a), (2) the AE index (b), and the vertical drift Vz as mean of 18 days (red curve) and mean of 10 quiet days (blue curve) (c).
The PRE vertical drift is known to be the most basic requirement for the initiation of the post-sunset R–T instability process leading to development of the equatorial plasma bubble/spread F irregularities. Vertical drift enhancements that may occur later in the night are also key (in varying degrees) for such irregularity developments. Therefore a detailed understanding of the sources contributing to the day-to-day variability in the nighttime vertical drift, and in the PRE in particular, is an important requirement for improving our knowledge on the day-to-day or short-term variability of the ESF/EPB irregularities. The PRE vertical drift can suffer modification during “quiet” as well as magnetically disturbed conditions. The modifications that occur under magnetic quiet conditions are mainly due to vertical (dynamic and electro-dynamic) coupling processes involving upward propagating atmospheric waves, such as the planetary/Kelvin waves through their modulation of the tidal wind modes whereby the E layer winds can modify the longitudinal gradient in the E layer conductivity at sunset that in turn may control the amplitude and phase of the PRE vertical drift (see, for example, Abdu et al., 2006). Under magnetic quiet condition the PRE vertical drift and the ESF development can suffer modification also during stratospheric warming events (de Paula et al., 2015; Lijo et al., 2017). The variability in PRE (and associated ESF) that we discuss here concerns magnetic disturbance conditions. Such disturbances include magnetic storms of wide-ranging intensities, from weak to moderate, to intense, to severe and to super storms. A few papers have discussed the responses of the PRE (and ESF) to such storm time disturbances (e.g., Abdu et al., 2003, 2009; Martinis et al., 2005; Ckakrabarty et al., 2006; Li et al., 2009; Tulasi Ram et al., 2015; Joshi et al., 2016). The cases of PRE responses to disturbance electric field that we discuss here are mainly those concerning very weak or non-storm conditions, being based mainly on the AE variation preceding/ surrounding the PRE that may or may not be accompanied by any significant disturbances in Sym-H. (Only one case of an intense storm was discussed to show how the PRE vertical drift enhancement by under-shielding PPEF can gain intensity with increasing intensity of the magnetic disturbance.) The occurrence of low-intensity disturbances is expected to be quite frequent, much more than that of higher-intensity disturbances. For example, it is known (see Abdu, 2012) that manifestation of penetration electric fields can be observed over the equator (in the form of EEJ plasma irregularity development) for AE activities of intensity of the order of 100 nT (and higher), and the occurrence statistics of disturbances of such intensity during 17:00–20:00 local time interval (relevant to the PRE) can vary on average from 20 % of the days during low solar flux epoch to 60 % of the days during high solar flux epoch (in the Brazilian longitude). It is not clear from the present analysis what could be the minimum threshold level of the AE activity (as an indicator of the PPEF) that can impact the PRE development. Such a threshold level is expected to also be longitude dependent, based on the local time/longitude variation in PPEF induced vertical drift obtained from analysis of ROCSAT data by Fejer et al. (2008). The model by Fejer et al. (2008) showed that the largest positive and negative vertical drifts (zonal penetration electric field) occurred after sunset and before sunrise, respectively, suggesting the influence of E layer conductivity longitudinal gradient in the intensity of the PPEF. The smallest positive vertical drift was found to be occurring during 15:00–17:00 LT, which, as we may note in Fig. 6, corresponds to the hours of the AE activity that contributed to the over-shielding electric field that suppressed the PRE vertical drift. During this local time window the required threshold level for AE activity to cause a given PPEF intensity could be higher than at other local times. Even so, we note in the statistical result in Fig. 6 that 18 cases of over-shielding effects occurred in a period of 3 months (October–December 2003), which corresponds to 20 % of the days. Therefore it appears that the occurrences of over-shielding electric field indicated by the cases of AE recovery (with inexpressive changes in Sym-H variations as can be noted in the top panel of Fig. 6) may constitute an important component of the short-term variability in the PRE. It may be pointed out that the cases analyzed in Fig. 6 were selected taking care to avoid the possibility of the simultaneous presence of disturbance dynamo electric field in suppressing the PRE vertical drift, that is, avoiding cases of longer duration (and moderate to high intensity) activity preceding the sunset. It should be commented here that with the increase in the AE activity, in terms of the intensity and duration, the contribution arising from the disturbance dynamo electric field to the EPB variability should increase also (e.g., Carter et al., 2014b).
Another notable aspect of the disturbance electric field impact on PRE concerns that indicated by AE intensifications, whether being part of storm/substorm developments or otherwise, occurring near sunset, when under-shielding PPEF of eastward electric field may cause enhancement in the PRE vertical drift (an example being the case on 14 October in Fig. 5b). Further, the examples presented in Figs. 1, 2 and 3 are unique in the sense that the evening Bz southward turning accompanied by AE intensification and Dst decreases occurred at nearly the same local time (18:00 LT), with a systematic increase in the intensity of the events on three consecutive days. The systematic increase in the intensity of the disturbances produced correspondingly increasing intensity of the PPEF, being 0.3, 0.4 and 1.8 mV m−1 on the consecutive evenings. However, as indicated by the rapid fluctuations in the AE that preceded the enhancements in the PRE vertical drifts (in some cases), it is not possible to quantify the relationship between the PPEF intensity (measured by its effect on PRE) and the AE index, or the Bz, based only on the three cases. From the present data we can only verify a gross positive relationship between them.
A slightly different (but complementary) picture emerged from the plots in Fig. 4. Here, on 13 October, the PRE vertical drift peak occurred in the presence of a large and rapid enhancement in AE (under Bz south) accompanied by Sym-H decrease, which suggested the presence of PPEF of eastward polarity. However, a consequent enhancement in the PRE vertical drift did not occur; in fact the peak drift velocity was less by 10 m s−1 compared to the quiet time PRE peak of the previous evening. The F layer heights around 16:00–17:00 LT (just before the PRE development) on this day (13 October) was lower than the corresponding values on the previous day by around 80 km, with the associated vertical drift values also being smaller. This lower values are the result of the combined effects of the over-shielding westward electric field due to the immediately preceding AE/Sym-H recovery as well as by a disturbance dynamo electric field (also westward) as might be expected from the longer duration of the preceding AE activity (pointed out in Sect. 2.1). By the time the PRE vertical drift attained the peak (at ∼ 18:15 LT) the over-shielding electric field was no longer present, so that the observed drift peak could be the net result of competing influences from the PPEF and DDEF of opposing polarities (see for example, Maruyama et al., 2005). This result, thus, demonstrates the need to consider the AE/Sym-H activity history immediately prior to and during a period of (at least) several hours prior to the sunset in order to evaluate the PRE development in response to an under-shielding electric field arising from a substorm development occurring in the sunset sector.
An important question concerns the EPB/ESF response to the PRE modified by the disturbance electric field. We may note in Fig. 4 that on 13 October spread F occurred when the PRE vertical drift was at its peak, as it did on the previous day that was a quiet day. A similar sequence of spread F onset close to the PRE peak can be noticed also in Figs. 2 and 3. It is not clear how the details of the SF characteristics, such as the growth rate and intensity etc., could vary in these different cases. We may note, however, that the SF intensity growth rate over Sao Luis, (as judged from the rate at which the fop values increased from its onset) was visibly slower on the quiet day of 14 September (Fig. 2) with the PRE peaking at 28 m s−1 as compared to the next evening when the PRE vertical drift increased faster to reach its peak value of 40 m s−1, under the influence of a PPEF. This was accompanied by a more rapid growth in SF intensity (compared to the previous evening). The consistency of such a trend appears to be clear in the remaining cases extending to Fig. 3. We may note further that on 9 November (in Fig. 5a) when the PRE vertical drift was limited to ∼ 10 m s−1, due to an over-shielding westward electric field, the post-sunset spread F did not develop, whereas it did occur on 8 November (a quiet day) with PRE peaking at ∼ 30 m s−1. We further note in Fig. 5b that the post-sunset spread F occurred in the evenings of both 14 and 15 October even though the PRE vertical drift peaks were widely different on these days, being 50 and 25 m s−1, respectively. In the limited samples analyzed here the minimum value of Vzp for which SF occurred was ∼ 20 m s−1. Although the close relationship between the PRE vertical drift and SF development is a well-established fact, a quantitative evaluation of this relationship is not possible without also considering the role of the instability seed perturbation in terms of its amplitude and phase in any given case (see, for example, Abdu et al., 2009). Such a study requires more detailed data analysis supported by modeling, which is beyond the scope of this paper.
The main conclusions from the present study can be summarized as follows. (1) The equatorial evening prereversal enhancement in zonal electric field/vertical drift velocity can suffer large modifications due to penetration electric field associated with magnetic disturbances occurring in the sunset sector, or due to disturbance dynamo electric field arising from preexisting disturbances. (2) An under-shielding electric field of eastward polarity associated with Bz turning south with AE/Sym-H intensification occurring at the time of the PRE development, can contribute to enhance the vertical drift, often also with a time shift in the drift peak depending upon the precise timing of the peak intensity of the PPEF. (3) The amplitude of the PRE vertical drift increases with increase in the intensity of the magnetic activity; however, a quantification of the proportionality of this dependence is not easily done due to the possibility of the simultaneous presence of opposing electric fields arising from the preceding state of activity. (4) The PRE vertical drift can be weakened, or suppressed (partially or totally) by over-shielding electric field of westward polarity arising from Bz turning north with AE/Sym-H recovery taking place immediately prior to the PRE development; the probability of such occurrences being about 20 % of the evenings during a period of 3 months analyzed here. (5) The DDEF and/or over-shielding electric field, both of westward polarity, if present near sunset, can set back the response of the PRE vertical drift to an under-shielding eastward electric field. (6) ESF/EPB development can be expedited by PRE enhancement due to under-shielding electric field, and its onset time can be advanced, or delayed, with respect its normal quiet time occurrence time depending upon the phase of the PPEF modifying the vertical drift. (7) ESF/EPB can be suppressed through the PRE weakening by an over-shielding or disturbance dynamo electric field arising from sub-storm/storm activity that prevailed before sunset. Quantitative evaluations of these effects will require considerations of other factors, such as the characteristics of the gravity wave seeding, as well.
The digisonde data were obtained from the data banks of the INPE's ionospheric observatories at Fortaleza and Sao Luis. The Interplanetary Magnetic Field IMF data were obtained from the website http://omniweb.gsfc.nasa.gov/form/omni_min.html. The Sym-H and AE indices were downloaded from World Data Center for Geomagnetism (WDC), Operated by the Graduate School of Science, Kyoto University Kyoto, Japan; available at: http://WDC.kugi.kyoto-u.ac.jp (last access:).
The authors declare that they have no conflict of interest.
This article is part of the special issue “Space weather connections to near-Earth space and the atmosphere”. It is a result of the 6∘ Simpósio Brasileiro de Geofísica Espacial e Aeronomia (SBGEA), Jataí, Brazil, 26–30 September 2016.
This work was supported by the Conselho Nacional de Desenvolvimento
Científico e Tecnológico (CNPq) through the process: CNPq
300883/2008-0. The Dst/Sym-H data were downloaded from the WDC/Kyoto site. The
IMF data were obtained from the website http://omniweb.gsfc.nasa.gov/form/omni_min.html. The Sao Luis and Fortaleza
digisonde data were obtained from an ionospheric observatory operated by INPE.
Mangalathayil A. Abdu acknowledges the support received from the Coordenação de
Aperfeiçoamento de Pessoal de Nível Superior (Capes) for a senior
visiting professorship at ITA/DCTA. Angela M. Santos acknowledges the
Fundação de Amparo à Pesquisa do Estado de São Paulo –
FAPESP for the financial support under grant 2015/25357-4 and
the CAPES.
The topical editor, Dalia Buresova, thanks Brett Carter and one anonymous referee for help in evaluating this paper.
Abdu, M. A.: Equatorial spread F/plasma bubble irregularities under storm time disturbance electric fields, J. Atmos. Sol.-Terr. Phy., 75–76, 44–56, 2012.
Abdu, M. A., Bittencourt, J. A., and Batista, I. S.: Some characteristics of spread F at magnetic equatorial station, Fortaleza, J. Geophys. Res., 86, 6836–6842, 1981.
Abdu, M. A., Sastri, J. H., Luhr, H., Tachihara, H., Kitamura, I., Trivedi, N. B., and Sobral, J. H. A.: DP 2 Electric Field Fluctuations In The Dusk-Time Equatorial Ionosphere, Geophys. Res. Lett., 25, 1511–1514, 1998.
Abdu, M. A., Batista, I. S., Takahashi, H., MacDougall, J., Sobral, J. H. A., Medeiros, A. F., and Trivedi, N. B.: Magnetospheric Disturbance Induced Equatorial Plasma bubble Development and Dynamics: A Case Study in Brazilian Sector, J. Geophys. Res., 108, A12, https://doi.org/10.1029/2002JA009721, 2003.
Abdu, M. A., Batista, P. P., Batista, I. S., Brum, C. G M., and Carrasco, A.: Reinisch, B. W., Planetary wave oscillations in mesospheric winds, equatorial evening prereversal electric field and spread F, Geophys. Res. Lett., 33, L07107, https://doi.org/10.1029/2005GL024837, 2006.
Abdu, M. A., Kherani, E. A., Batista, I. S., and Sobral, J. H. A.: Equatorial evening prereversal vertical drift and spread F suppression by disturbance penetration electric fields, Geophys. Res. Lett., 36, L19103, https://doi.org/10.1029/2009GL039919, 2009.
Abdu, M. A., Batista, I. S., Reinisch, B. W., MacDougall, J. W., Kherani, E. A., and Sobral, J. H. A.: Equatorial range spread F echoes from coherent backscatter, and irregularity growth processes, from conjugate point digital ionograms, Radio Sci., 47, RS6003, https://doi.org/10.1029/2012RS005002, 2012.
Abdu, M. A., de Souza, J. R., Kherani, E. A., Batista, I. S., MacDougall, J. W., and Sobral, J. H. A.: Wave structure and polarization electric field development in the bottomside F layer leading to postsunset equatorial spread F, J. Geophys. Res.-Space Phys., 120, 6930–6940, https://doi.org/10.1002/2015JA021235, 2015.
Abdu, M. A., Nogueira, P. A. B., Souza, J. R., Batista, I. S., Dutra, S. L. G., and Sobral, J. H. A.: Equatorial electrojet responses to intense solar flares under geomagnetic disturbance time electric fields, J. Geophys. Res.-Space Phys., 122, 3570–3585, https://doi.org/10.1002/2016JA023667, 2017.
Bittencourt, J. A. and Abdu, M. A.: Theoretical comparison between apparent and real vertical ionization drift velocities in the equatorial F region, J. Geophys. Res., 86, 2451–2455, 1981.
Blanc, M. and Richmond, A. D.: The ionospheric disturbance dynamo, J. Geophys. Res., 85, 1669–1686, 1980.
Carter, B. A., Yizengaw, E., Retterer, J. M., Francis, M., Terkildsen, M., Marshall, R., Norman, R., and Zhang, K.: An analysis of the quiet time day-to-day variability in the formation of postsunset equatorial plasma bubbles in the Southeast Asian region, J. Geophys. Res.-Space Phys., 119, 3206–3223, https://doi.org/10.1002/2013JA019570, 2014a.
Carter, B. A., Retterer, J. M., Yizengaw, E., Groves, K., Caton, R., McNamara, L., Bridgwood, C., Francis , M., Terkildsen, M., Norman, R., and Zhang, K.: Geomagnetic control of equatorial plasma bubble activity modeled by the TIEGCM with Kp, Geophys. Res. Lett., 41, 5331–5339, https://doi.org/10.1002/2014GL060953, 2014b.
Chakrabarty, D., Sekar, R., Narayanan, R., Patra, A. K., and Devasia, C. V.: Effects of interplanetary electric field on the development of an equatorial spread F event, J. Geophys. Res., 111, A12316, https://doi.org/10.1029/2006JA011884, 2006.
De Paula, E. R., Jonah, O. F., Moraes, A. O., Kherani, E. A., Fejer, B. G., Abdu, M. A., Muella, M. T. A., Batista, I. S., Dutra, S. L. G., and Paes, R. R.: Low-latitude scintillation weakening during sudden stratospheric warming events, J. Geophys. Res.-Space Phys., 120, 2212–2221, https://doi.org/10.1002/2014ja020731, 2015.
Fejer, B. G., Scherliess, L., and de Paula, E. R.: Effects of the vertical plasma drift velocity on the generation and evolution of equatorial spread F, J. Geophys. Res., 104, 19859–19869, https://doi.org/10.1029/1999JA900271, 1999.
Fejer, B. G., Jensen, J. W., and Su, S.-Y.: Seasonal and longitudinal dependence of equatorial disturbance vertical plasma drifts, Geophys. Res. Lett., 35, L20106, https://doi.org/10.1029/2008GL035584, 2008.
Huang, C.-S., Rich, F. J., and Burke, W. J.: Storm time electric fields in the equatorial ionosphere observed near the dusk meridian, J. Geophys. Res., 115, A08313, https://doi.org/10.1029/2009JA015150, 2010.
Huang, C.-S., de La Beaujardiere, O., Roddy, P. A., Hunton, D. E., Ballenthin, J. O., and Hairston, M. R.: Generation and characteristics of equatorial plasma bubbles detected by the C/NOFS satellite near the sunset terminator, J. Geophys. Res., 117, A11313, https://doi.org/10.1029/2012JA018163, 2012.
Joshi, L. M., Sripathi, S., and Singh, R.: Simulation of low-latitude ionospheric response to 2015 St. Patrick's Day super geomagnetic storm using ionosonde-derived PRE vertical drifts over Indian region, J. Geophys. Res.-Space Phys., 121, 2489–2502, https://doi.org/10.1002/2015JA021512, 2016.
Kelley, M. C.: The Earth's Ionosphere: Plasma Physics and Electrodynamics, Academic, San Diego, California, 1989.
Kil, H., Paxton, L. J., and Oh, S.-J.: Global bubble distribution seen from ROCSAT-1 and its association with the evening prereversal enhancement, J. Geophys. Res., 114, A06307, https://doi.org/10.1029/2008JA013672, 2009.
Kikuchi, T., Luhr, H., Kitamura, T., Saka, O., and Schlegel, K.: Direct penetration of the polar electric field to the equator during a DP 2 event as detected by the Auroral and equatorial magnetometer chains and the ElSCAT radar, J. Geophys. Res., 101, 17161–17173, 1996.
Kikuchi, T., Luhr, H., Schlegel, K., Tachihara, H., Shinohara, M., and Kitamura, T. L.: Penetration of auroral electric fields to the equator during a substorm, J. Geophys. Res., 105, 23251–23252, 2000.
Li, G., Ning, B., Zhao, B., Liu, L., Wan, W., Ding, F., Xu, J. S., Liu, J. Y., and Yumoto, K.: Characterizing the 10 November 2004 storm-time middle-latitude plasma bubble event in Southeast Asia using multi-instrument observations, J. Geophys. Res., 114, A07304, https://doi.org/10.1029/2009JA014057, 2009.
Li, G., Ning, B., Abdu, M. A., Wan, W., and Hu, L.: Precursor signatures and evolution of post-sunset equatorial spread-F observed over Sanya, J. Geophys. Res., 117, A08321, https://doi.org/10.1029/2012JA017820, 2012.
Lijo, J., Vineeth, C., and Pant, T. K.: Impact of Stratospheric Sudden Warming on the occurrence of the Equatorial Spread-F, J. Geophys. Res., 122, 12544–12555, https://doi.org/10.1002/2017JA024652, 2017.
Martinis, C. R., Mendillo, M. J., and Aarons, J.: Toward a synthesis of equatorial spread F onset and suppression during geomagnetic storms, J. Geophys. Res., 110, A07306, https://doi.org/10.1029/2003JA010362, 2005.
Maruyama, N., Richmond, A. D., Fuller-Rowell, T. J., Codrescu, M. V., Sazykin, S., Toffoletto, F. R., Spiro, R. W., and Millward, G. H.: Interaction between direct penetration and disturbance dynamo electric fields in the storm-time equatorial ionosphere, Geophys. Res. Lett., 32, L17105, https://doi.org/10.1029/2005GL023763, 2005.
Nishida, A.: Coherence of geomagnetic DP 2 fluctuations with interplanetary magnetic variations, J. Geophys. Res., 73, 5549–5559, https://doi.org/10.1029/JA073i017p05549, 1968.
Richmond, A. D., Peymirat, C., and Roble, R. G.: Long-lasting disturbances in the equatorial ionospheric electric field simulated with a coupled magnetosphere-ionosphere-thermosphere model, J. Geophys. Res., 108, 1118, https://doi.org/10.1029/2002JA009758, 2003.
Sastri, J. H., Abdu, M. A., and Sobral, J. H. A.: Response of equatorial ionosphere to episodes of asymmetric ring current activity, Ann. Geophys., 15, 1316–1323, https://doi.org/10.1007/s00585-997-1316-3, 1997.
Scherliess, L. and Fejer, B. G.: Storm time dependence of equatorial disturbance dynamo zonal electric field, J. Geophys. Res., 102, 24037–24046, 1997.
Senior, C. and Blanc, M.: On the control of magnetospheric convection by the spatial distribution of ionospheric conductivities, J. Geophys. Res., 89, 261–284, 1984.
Spiro, R. W., Wolf, R. A., and Fejer, B. G.: Penetration of high latitude electric fields effects to low latitudes during SUNDIAL 1984, Ann. Geophys., 6, 39–50, 1988.
Su, S.-Y., Chao, C. K., and Liu, C. H.: On monthly/seasonal/longitudinal variations of equatorial irregularity occurrences and their relationship with the post sunset vertical drift velocities, J. Geophys. Res., 113, A05307, https://doi.org/10.1029/2007JA012809, 2008.
Takahashi, H., Abdu, M. A., Wrasse, C. M., Fechine, J., Batista, I. S., Pancheva, D., Lima, L. M., Batista, P. P., Clemesha, B. R., Shiokawa, K., Gobbi, D., Mlynczak, M. G., and Russel, J. M.: Possible influence of ultra-fast Kelvin wave on the equatorial ionosphere evening uplifting, Earth Planet. Space, 61, 455–462, 2009.
Tsunoda, R. T.: Day-to-day variability in equatorial spread F: Is there some physics missing?, Geophys. Res. Lett., 33, L16106, https://doi.org/10.1029/2006GL025956, 2006.
Tsunoda, R. T.: A simple model to relate ionogram signatures to large-scale wave structure, Geophys. Res. Lett., 39, L18107, https://doi.org/10.1029/2012GL053179, 2012.
Tsunomura, S.: Numerical analysis of global ionospheric current system including the effect of equatorial enhancement, Ann. Geophys., 17, 692–706, https://doi.org/10.1007/s00585-999-0692-2, 1999.
Tulasi Ram, S., Yokoyama, T., Otsuka, Y., Shiokawa, K., Sripathi, S., Veenadhari, B., Heelis, R., Ajith, K. K., Gowtam, V. S., Gurubaran, S., Supnithi, P., and Le Huy, M.: Dusk side enhancement of equatorial zonal electric field response to convection electric fields during the St. Patrick's Day storm on 17 March 2015, J. Geophys. Res.-Space Phys., 120, 538–548, https://doi.org/10.1002/2015JA021932, 2015.
Wanliss, J. A. and Showalter, K. M.: High-resolution global storm index: Dst versus SYM-H, J. Geophys. Res., 111, A02202, https://doi.org/10.1029/2005JA011034, 2006.