the Creative Commons Attribution 4.0 License.
the Creative Commons Attribution 4.0 License.
 | 16 Mar 2018
Report of a large depletion in the ozone layer over southern Brazil and Uruguay by using multi-instrumental data
Caroline Bresciani
Gabriela Dornelles Bittencourt
José Valentin Bageston
Damaris Kirsch Pinheiro
Nelson Jorge Schuch
Hassan Bencherif
Neusa Paes Leme
Lucas Vaz Peres
Ozone is one of the chemical compounds that form part of the atmosphere. It plays a key role in the stratosphere where the “ozone layer” is located and absorbs large amounts of ultraviolet radiation. However, during austral spring (August–November), there is a massive destruction of the ozone layer, which is known as the “Antarctic ozone hole”. This phenomenon decreases ozone concentration in that region, which may affect other regions in addition to the polar one. This anomaly may also reach mid-latitudes; hence, it is called the “secondary effect of the Antarctic ozone hole”. Therefore, this study aims to identify the passage of an ozone secondary effect (OSE) event in the region of the city of Santa Maria – RS (29.68∘ S, 53.80∘ W) by means of a multi-instrumental analysis using the satellites TIMED/SABER, AURA/MLS, and OMI-ERS. Measurements were made in São Martinho da Serra/RS – Brazil (29.53∘ S, 53.85∘ W) using a sounding balloon and a Brewer Spectrophotometer. In addition, the present study aims to describe and analyse the influence that this stratospheric ozone reduction has on temperatures presented by these instruments, including data collected through the radio occultation technique. The event was first identified by the AURA/MLS satellite on 19 October 2016 over Uruguay. This reduction in ozone concentration was found by comparing the climatology for the years 1996–1998 for the state of Rio Grande do Sul, which is close to Uruguay. This event was already observed in Santa Maria/RS-Brazil on 20 October 2016 as presented by the OMI-ERS satellite and the Brewer Spectrophotometer. Moreover, a significant decrease was reported by the TIMED/SABER satellite in Uruguay. On 21 October, the poor ozone air mass was still over the region of interest, according to the OMI-ERS satellite, data from the sounding balloon launched in Santa Maria/RS-Brazil, and measurements made by the AURA/MLS satellite. Furthermore, the influence of ozone on the stratosphere temperature was observed during this period. Despite a continuous decrease detected in height, the temperature should have followed an increasing pattern in the stratospheric layer. Finally, the TIMED/SABER and OMI-ERS satellites showed that on 23 October, the air mass with low ozone concentration was moving away, and its layer, as well as the temperature, in the stratosphere was re-established.
Keywords. Atmospheric composition and structure (middle atmosphere – composition and chemistry; instruments and techniques)


The atmospheric ozone (O3) is a trace chemical compound in the stratosphere (between the altitudes of 20 and 35 km), where it forms the “ozone layer” with maximum concentration at 25 km. Ozone plays a key role in life on Earth, energy balance and water vapour. This compound acts as a shield for type B ultraviolet radiation emitted by the Sun and its UV-B absorption capacity benefits human health since this radiation is harmful to living beings (Salby, 1996).
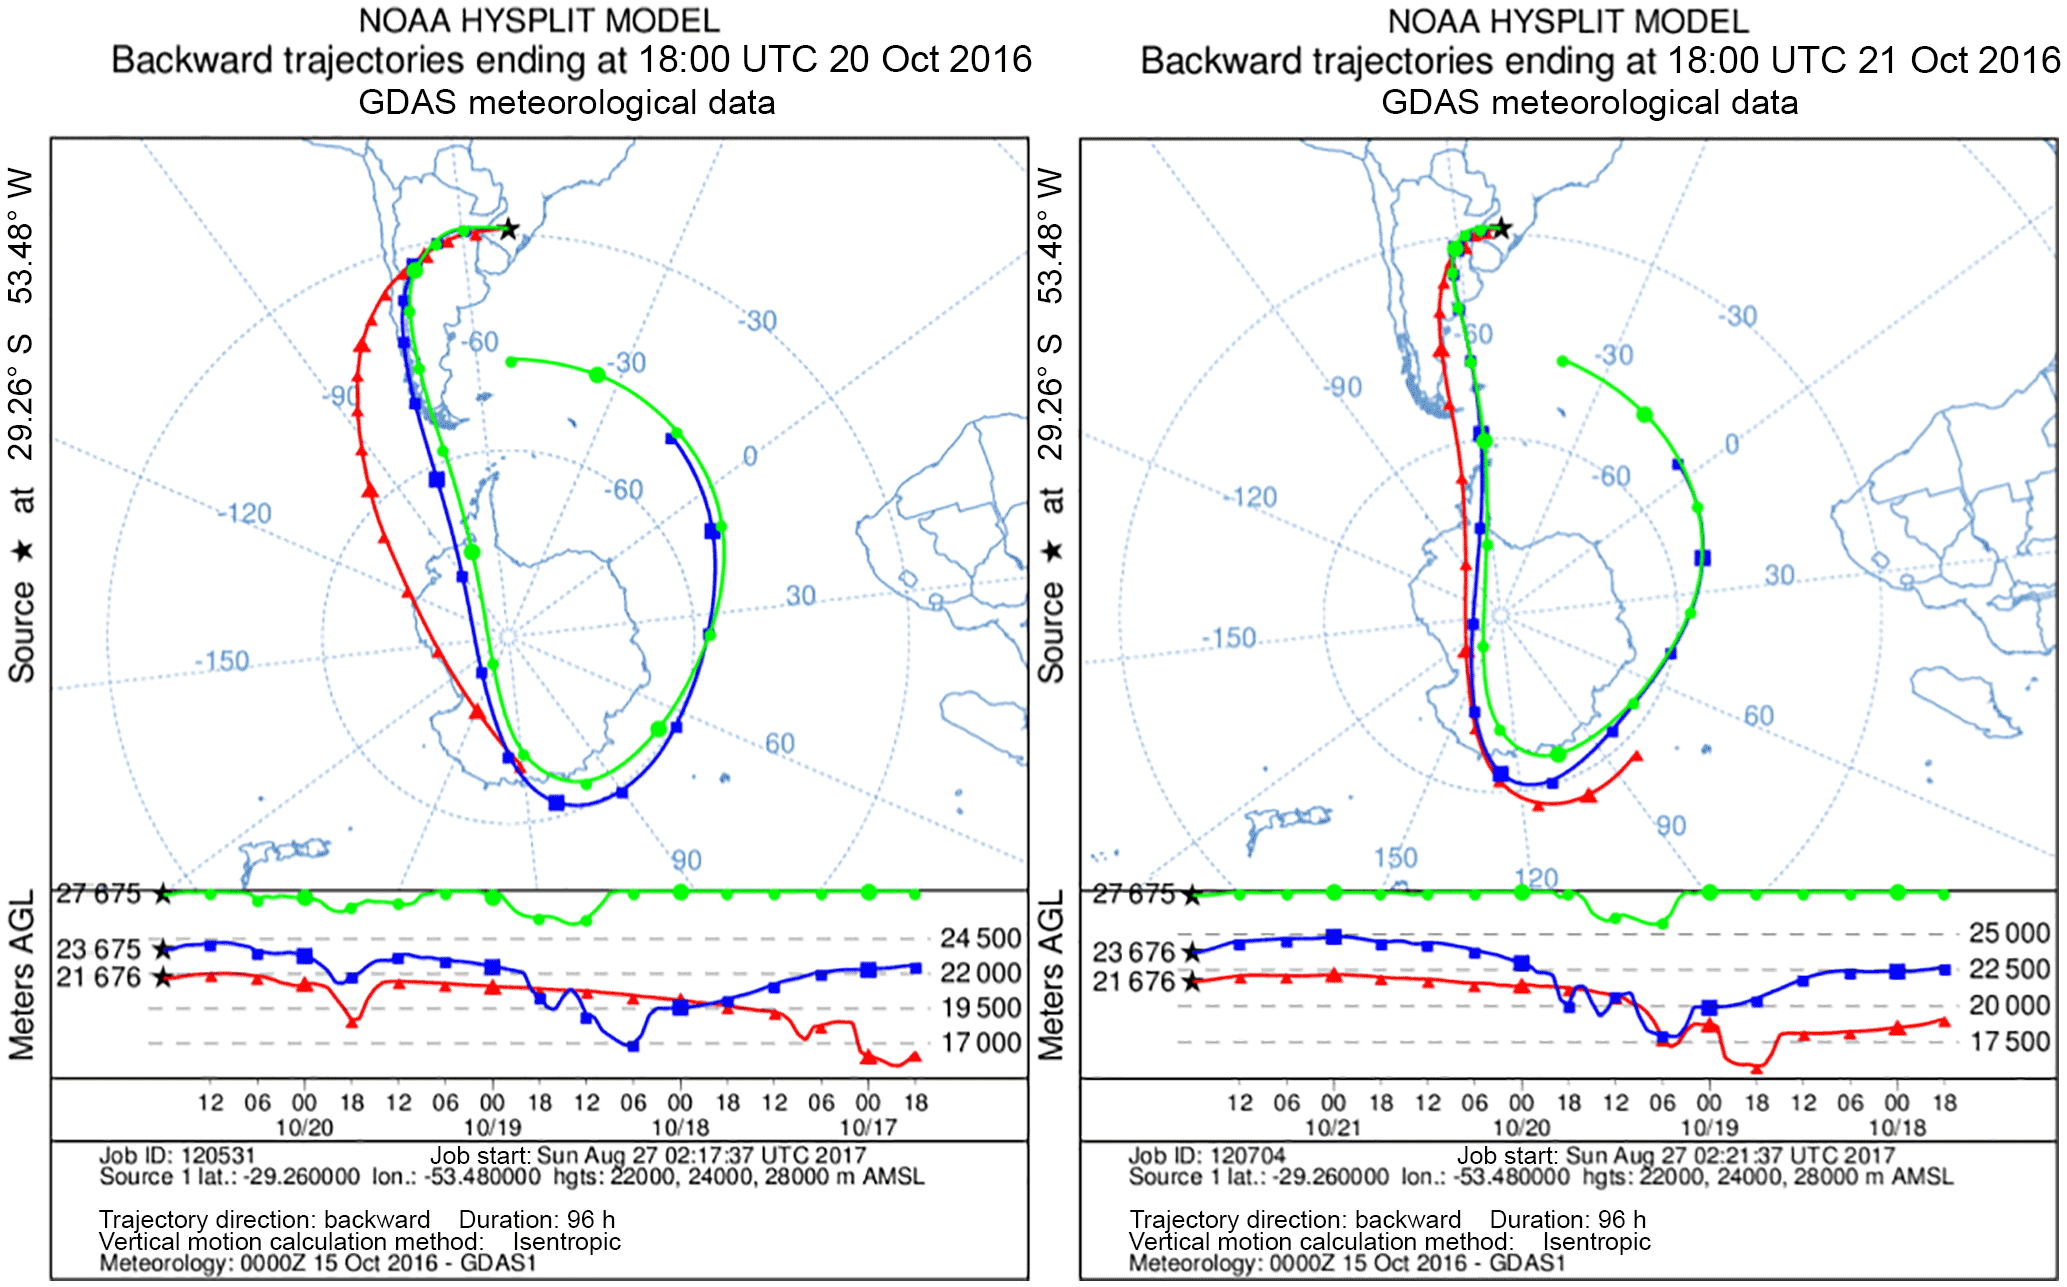
Figure 1Backward trajectories from NOAA's HYSPLIT model. The trajectories are shown according to height levels: 28 (green), 24 (blue), and 22 km (red). Source: obtained using command lines at HYSPLIT/NOAA (2017).
Although most production of ozone takes place in the tropical region due to the direct reception of solar radiation, the highest concentration of this gas is in the polar region. This is due to the Brewer–Dobson circulation, which is a special type of southern transport that transports the stratosphere air mass from the beginning of its journey at the Equator until it flows away to the poles (Butchart, 2014). As a result, ozone is concentrated in a particular region of the planet. Another important variable is the potential vorticity, which is used to study the rich ozone air mass movement and its filaments that present a high potential vorticity gradient at the centre of the air mass (Pinheiro et al., 2011). However, there is a large destruction in the ozone layer in austral spring (August–November), which directly affects the polar region. This destruction is known as the “Antarctic ozone hole” (Gettelman et al., 2011), and it causes drastic reductions in ozone content in Antarctica. Once this ozone reduction takes place, violet radiation, which would be previously absorbed, passes freely through the atmosphere and reaches the surface of Earth.
Ozone reduction/depletion is not an exclusive feature to the polar region as it can still reach mid-latitudes. This phenomenon is known as the “secondary effect of the ozone hole”. This occurs when the polar vortex releases filaments to these regions and disturbs ozone concentration, resulting in a temporary decrease in ozone for approximately 7 to 20 days. This influence over mid-latitudes was first observed by Kirchhoff et al. (1996) and later reported by Pinheiro et al. (2011), who also observed this phenomenon in southern Brazil.
It is imperative to highlight the Montreal Protocol on Substances that Deplete the Ozone Layer, which was ratified by 196 states, including Brazil, in 1987. The Montreal Protocol is an international treaty designed to reduce ozone-depleting substances such as chlorofluorocarbons (CFCs). Over the span of 3 decades, this international agreement yielded a positive response in ozone levels as countries have been on track to recover levels previously observed in 1980 (WMO, 2018).
Therefore, this multi-instrumental study aims to show/prove the occurrence of a secondary effect of the ozone hole in southern Brazil, especially in the city of Santa Maria, RS (29.68∘ S, 53.80∘ W). Additionally, the aim is to verify the temperature behaviour during the event by analysing data from six different instruments, which are the AURA/MLS, TIMED/SABER and OMI-ERS satellites, a ground-based instrument (Brewer), a sounding balloon, a GPS-PRO, as well as a forecast model.
The event that influenced the ozone decrease in southern Brazil in October 2016 was first predicted by a forecast model available at SULFLUX (2018). According to the climatology for the season, when these OSE events occurred (Chubachi, 1984), the poor ozone air mass was expected to arrive around 21 October in southern Brazil. Based on the model prediction, a sounding balloon was launched on 21 October in order to measure the ozone concentration profile over Santa Maria (29.68∘ S, 53.80∘ W), southern Brazil, on this specific day. The Hybrid Single Particle Lagrangian Integrated Trajectory (HYSPLIT) model from NOAA, which is one of the first dispersion models used to trace air mass trajectories (Glenn et al., 2017), also confirmed this event, and the result showed the retroactive trajectory towards the south of South America (Fig. 1).
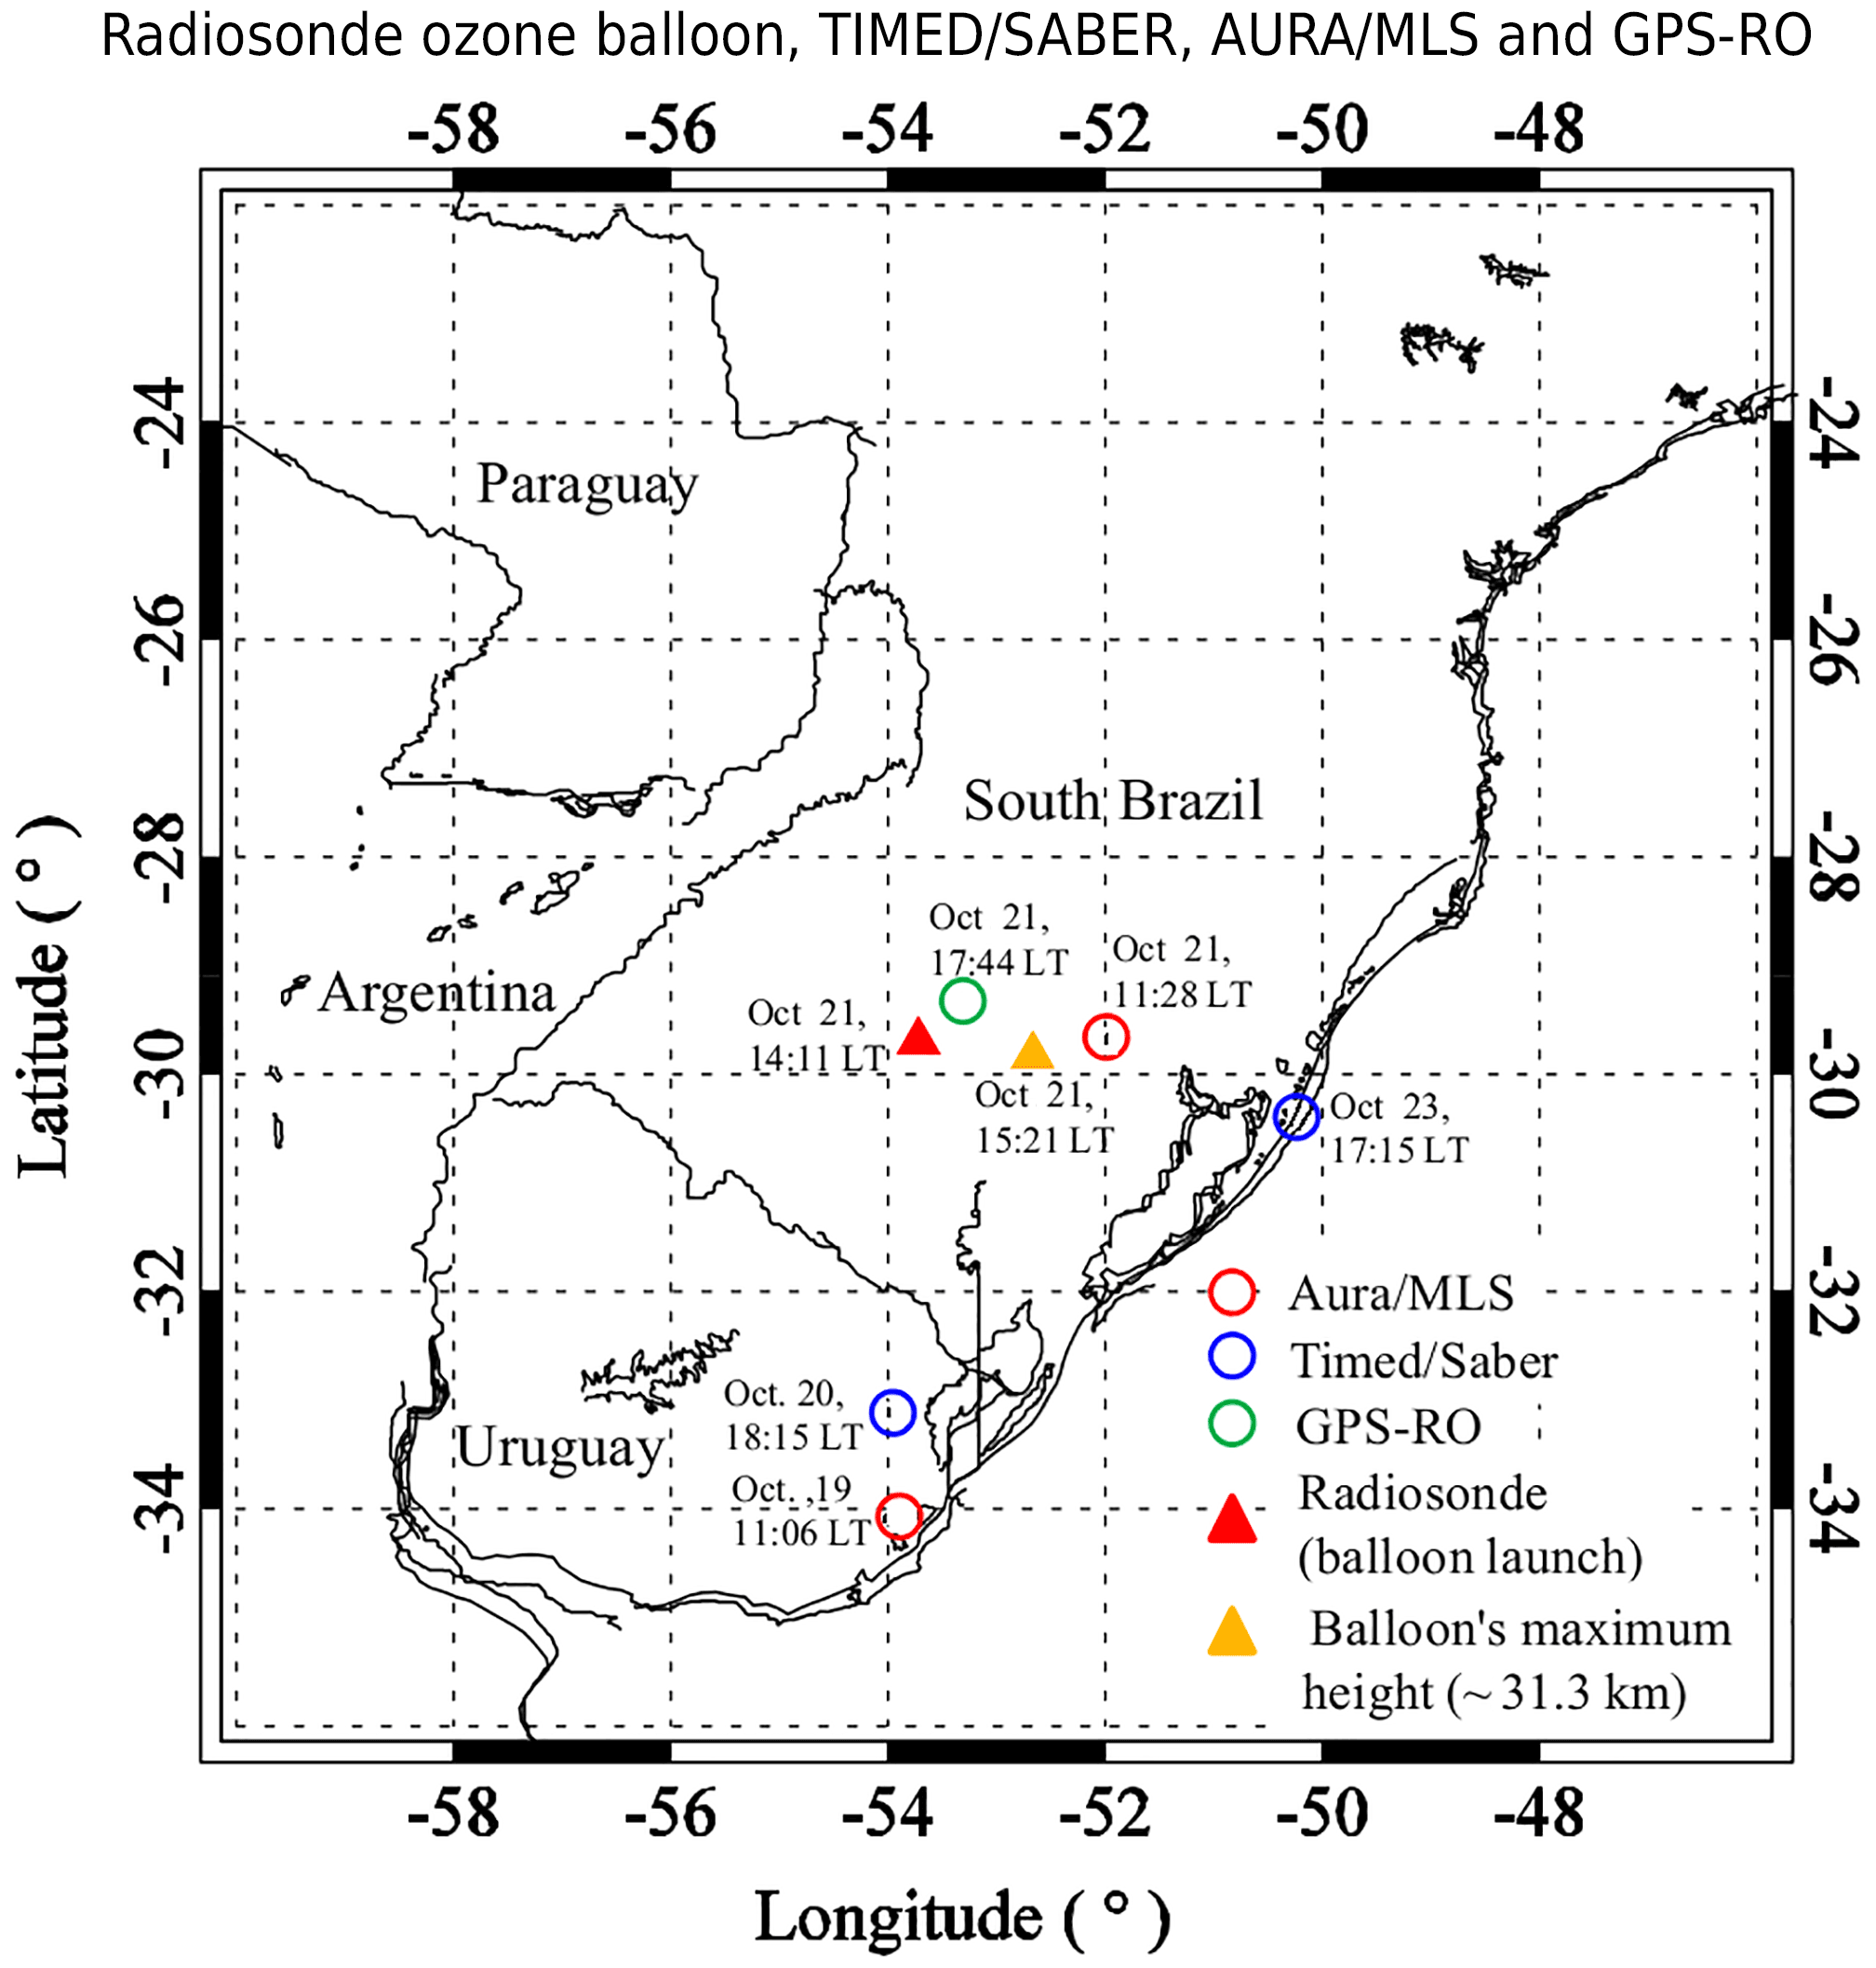
Figure 2TIMED/SABER (blue circle) and AURA/MLS (red circle) sounding locations from 19 to 23 October 2016. On 21 October the balloon sounding (red triangle, launch; orange triangle, apex) and the GPS-RO sounding (green circle).
The sounding balloon was launched in Santa Maria and ascended approximately 31 km with eastward displacement from the launch spot (Fig. 2). The methodology used for the launch followed a pattern used in Natal-RN (5.79∘ S, 35.20∘ W) in a study by Witte et al. (2017). The measurements collected by the sounding balloon used here were ozone and temperature.
In addition to the ozone sounding data, ground-based measurements included the total ozone column. The Brewer Spectrophotometer was used to identify the large depletion in the ozone content. It was located at the Southern Space Observatory (OES/INPE) in São Martinho da Serra/RS-Brazil (29.53∘ S, 53.85∘ W), which is 30 km from Santa Maria. Ozone and temperature profiles were obtained from the TIMED/SABER and AURA/MLS satellites. OMI satellite images on board the ERS-2 satellite were also used. All instruments will be closely described below.
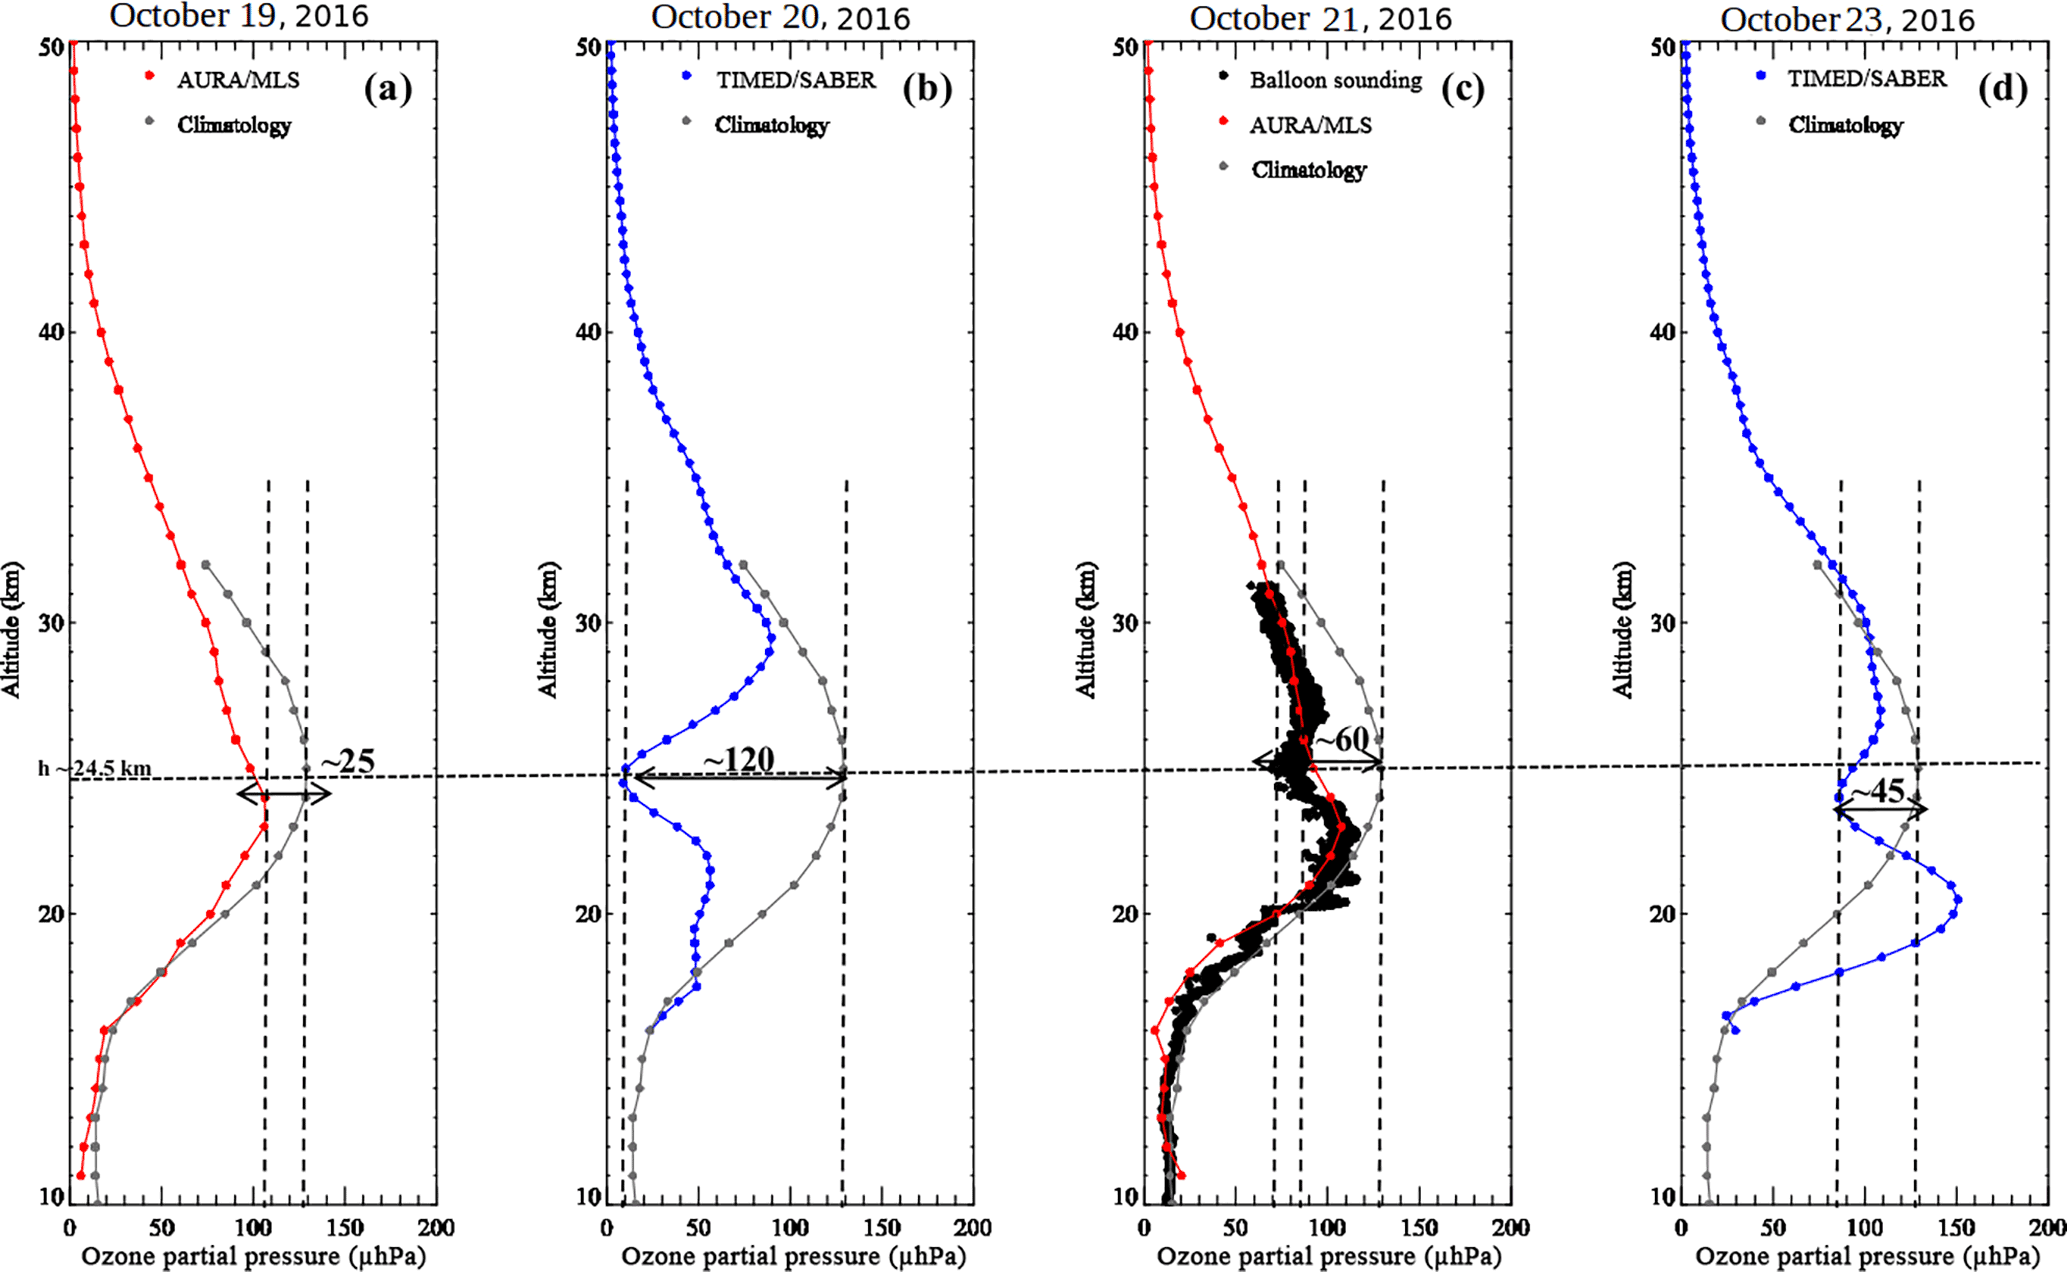
Figure 3Ozone partial pressure profile as obtained by the ozonesonde (black), AURA/MLS (red), TIMED/SABER (blue) and climatology from ozonesonde balloons campaigns between 1996 and 1998 (grey) (following Guarnieri et al., 2004).
The Brewer Spectrophotometer was designed for spectral irradiation measurements in the ultraviolet (UV-B) range of the solar spectrum. This apparatus makes measurements at five wavelengths, 306.3, 310.1, 313.5, 316.8, and 320.1 nm, which allows the deduction of the total column of the atmospheric gases, such as ozone (O3) and other atmospheric compounds. This ground-based device can make as many as 40 measurements per day depending on the weather conditions. On 21 October 2016 (295 on the Julian calendar), the Brewer performed 15 measurements, which are considered valid according to the operation of the instrument (Vaz Peres et al., 2017) as well as the days before and after the launch.
NASA's Thermosphere Ionosphere Mesosphere Energetics and Dynamics (TIMED) satellite has a circular orbit of 625 km at 74.1∘ from the Equator (Cooper, 2004). The data obtained from this satellite allow the need to study the influence of solar radiation and human activities in the upper layers of the atmosphere (from 60 to 180 km). The radiosonde cannot reach this region and this satellite is the only one that can provide global measurements of this wide range of altitude. The sounding of the atmosphere was done using broadband emission radiometry (SABER), which is one of the instruments on board the TIMED satellite. This device is a multi-spectral radiometer that measures daily vertical profiles through near-infrared measurements between 1.27 and 17 µmm, with a typical accuracy above 5 % in most channels and a vertical resolution of about 2 km (Bageston et al., 2011). The data collected through the TIMED/SABER satellite are available from altitudes between 10 and 120 km.
Another satellite used in the present study was AURA, which is part of NASA's Earth Observing System (EOS). The Aura orbit is Sun-synchronous at an altitude of 705 km with 98∘ inclination. One of the instruments on board AURA is the Microwave Limb Sounder (MLS), which measures the emission of thermal microwaves from different regions and scans the Earth every 24.7 s (French and Mulligan, 2010). The AURA/MLS satellite measures the atmospheric composition, such as temperature, humidity and ozone. In addition, it is also possible to obtain measurements during the day and night around the globe by means of the AURA/MLS satellite, which acquires data even in the presence of glacial clouds and aerosol from infrared, visible and ultraviolet measurements (AURA, 2018).
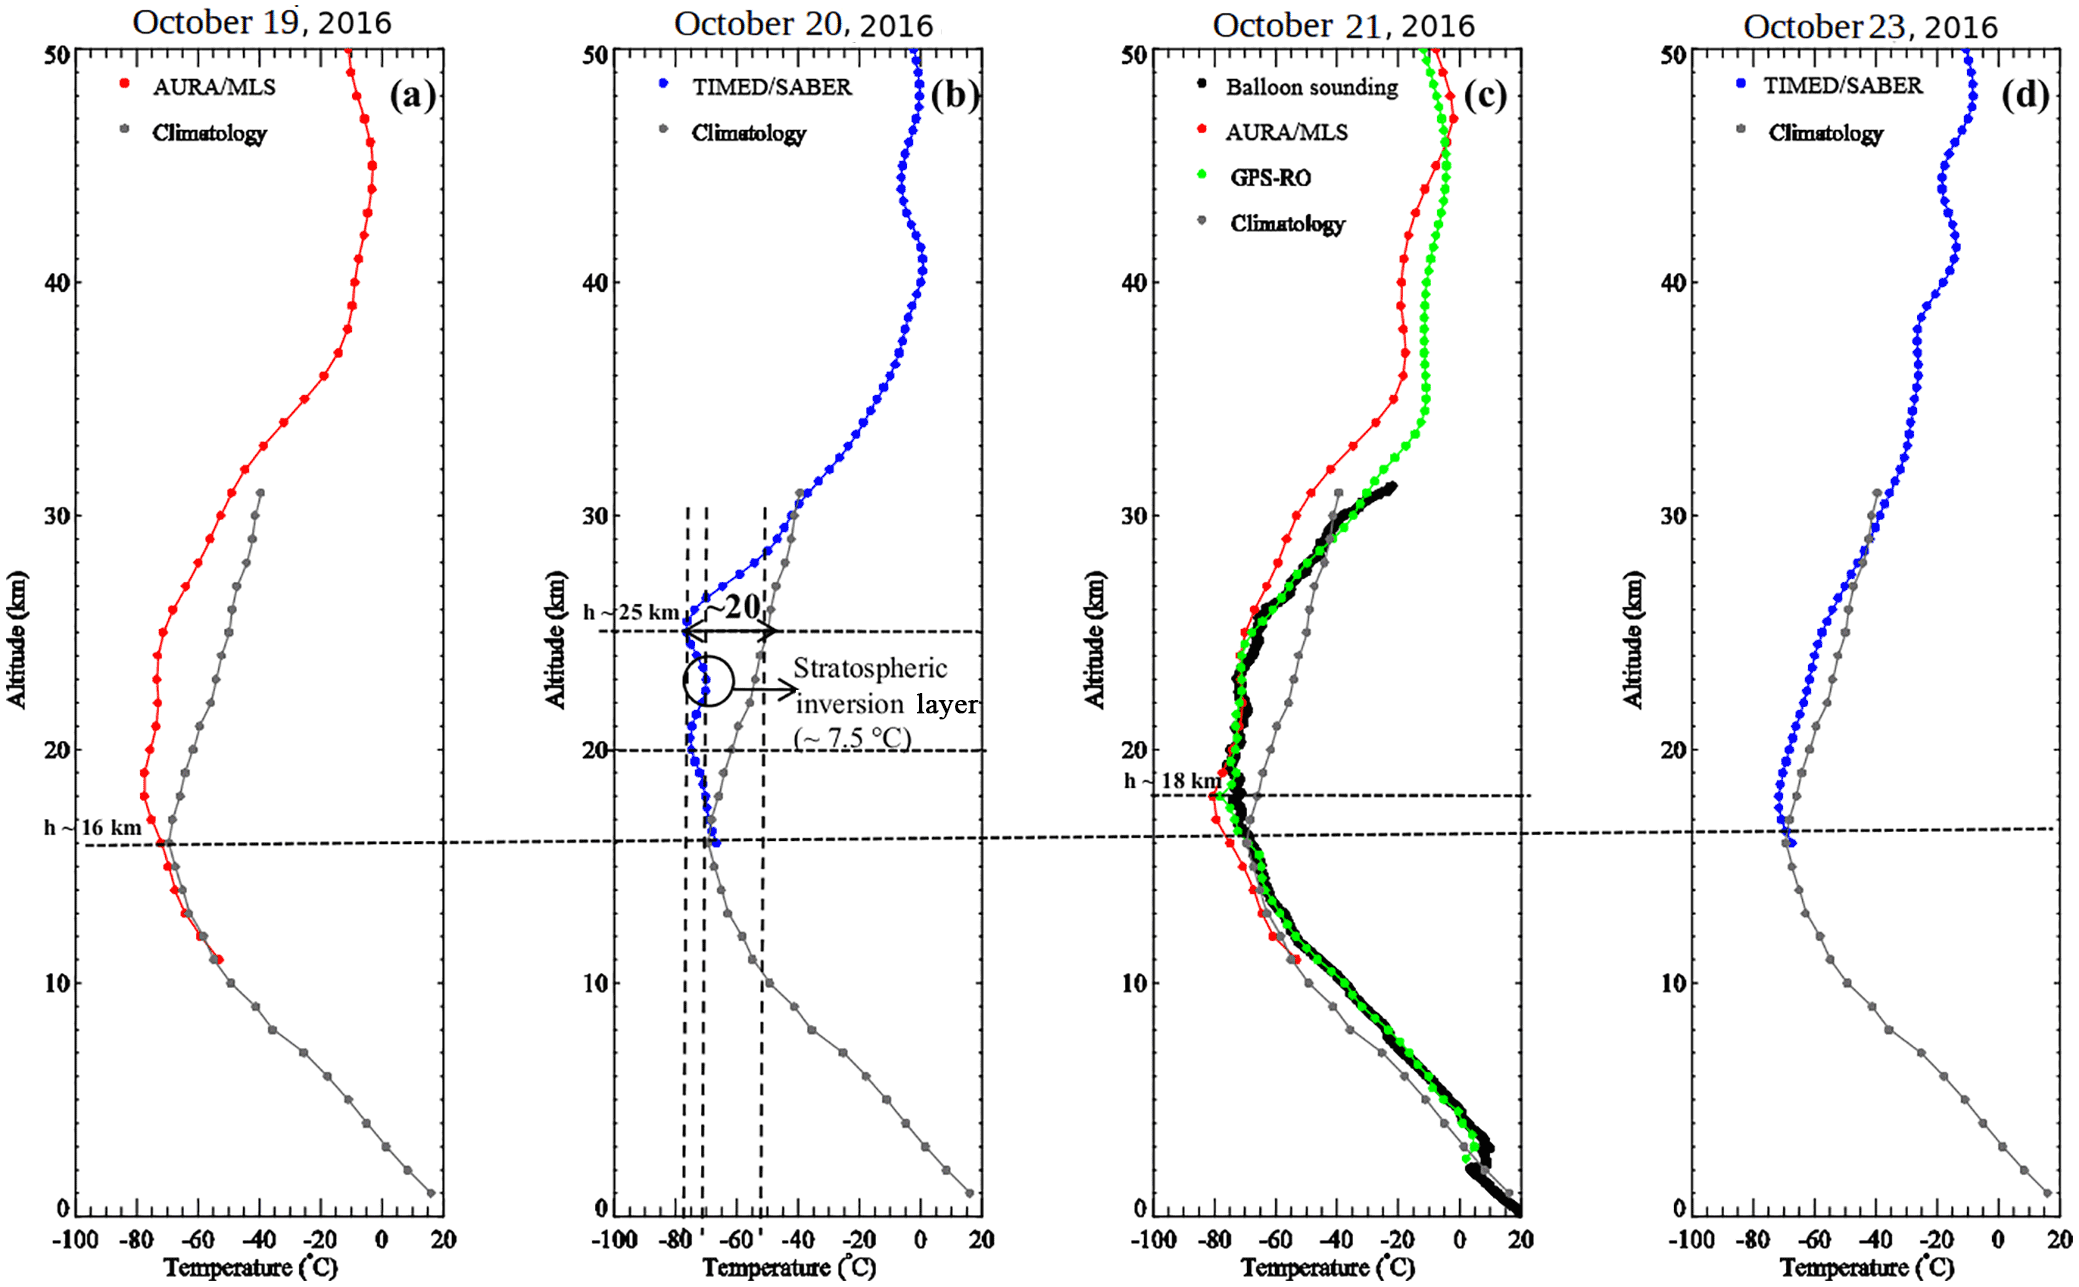
Figure 4The same as Fig. 3 but for the temperature and the additional GPS-RO profile (green).
The temperature was also compared with data obtained from the Cosmic Satellite Constellation which utilize the radio occultation (RO) technique to retrieve the temperature profiles (Foelsche et al., 2006). The RO technique uses the effect of the radio signal refraction in the atmosphere when the satellites of the Global Navigation Satellite System (GNSS) are occult for the receivers on the ground. Through this technique it is possible to retrieve, besides temperature, other important variables, such as the atmospheric density, water vapour and densities of several constituents (GNSS) (COSMIC, 2018).
The last instrument used in this study was the Ozone Monitoring Instrument (OMI) on board the ERS-2/NASA satellite. It was launched to replace the Earth Probe Satellite (TOMS-EP), which ended its activities in 2015 (Antón et al., 2009). The OMI instrument records data from the total ozone column and other atmospheric parameters related to ozone chemistry and climate, such as NO2 and SO2. This instrument can also distinguish different types of aerosols, including smoke, dust and sulfates, in addition to measuring pressure and cloud cover and creating a hyperspectral image in the visible and ultraviolet spectrum (OMI, 2018).
The measurements obtained by the AURA/MLS and TIMED/SABER satellites are in mixing ratio, although the balloon measurements are in partial pressure. Thus, it was necessary to convert the satellite data unit from mixing ratio to partial pressure for a reliable comparison between the two sets of data.
This paper presents a full multi-instrumental analysis of a strong ozone secondary effect over southern Brazil and Uruguay between 21 and 23 October 2016. The ozone and temperature profiles observed during the occurrence of this ozone depletion event were compared to the climatology for Santa Maria between 1996 and 1998 (Guarnieri et al., 2004).
If the measurements of the instrument were not simultaneous, it could imply poor data correlation. However, the instruments in this study did not perform simultaneous measurements at the same location and on/at the same day/time. Nevertheless, the results were efficient in identifying poor ozone air mass displacement and analysis of this event.
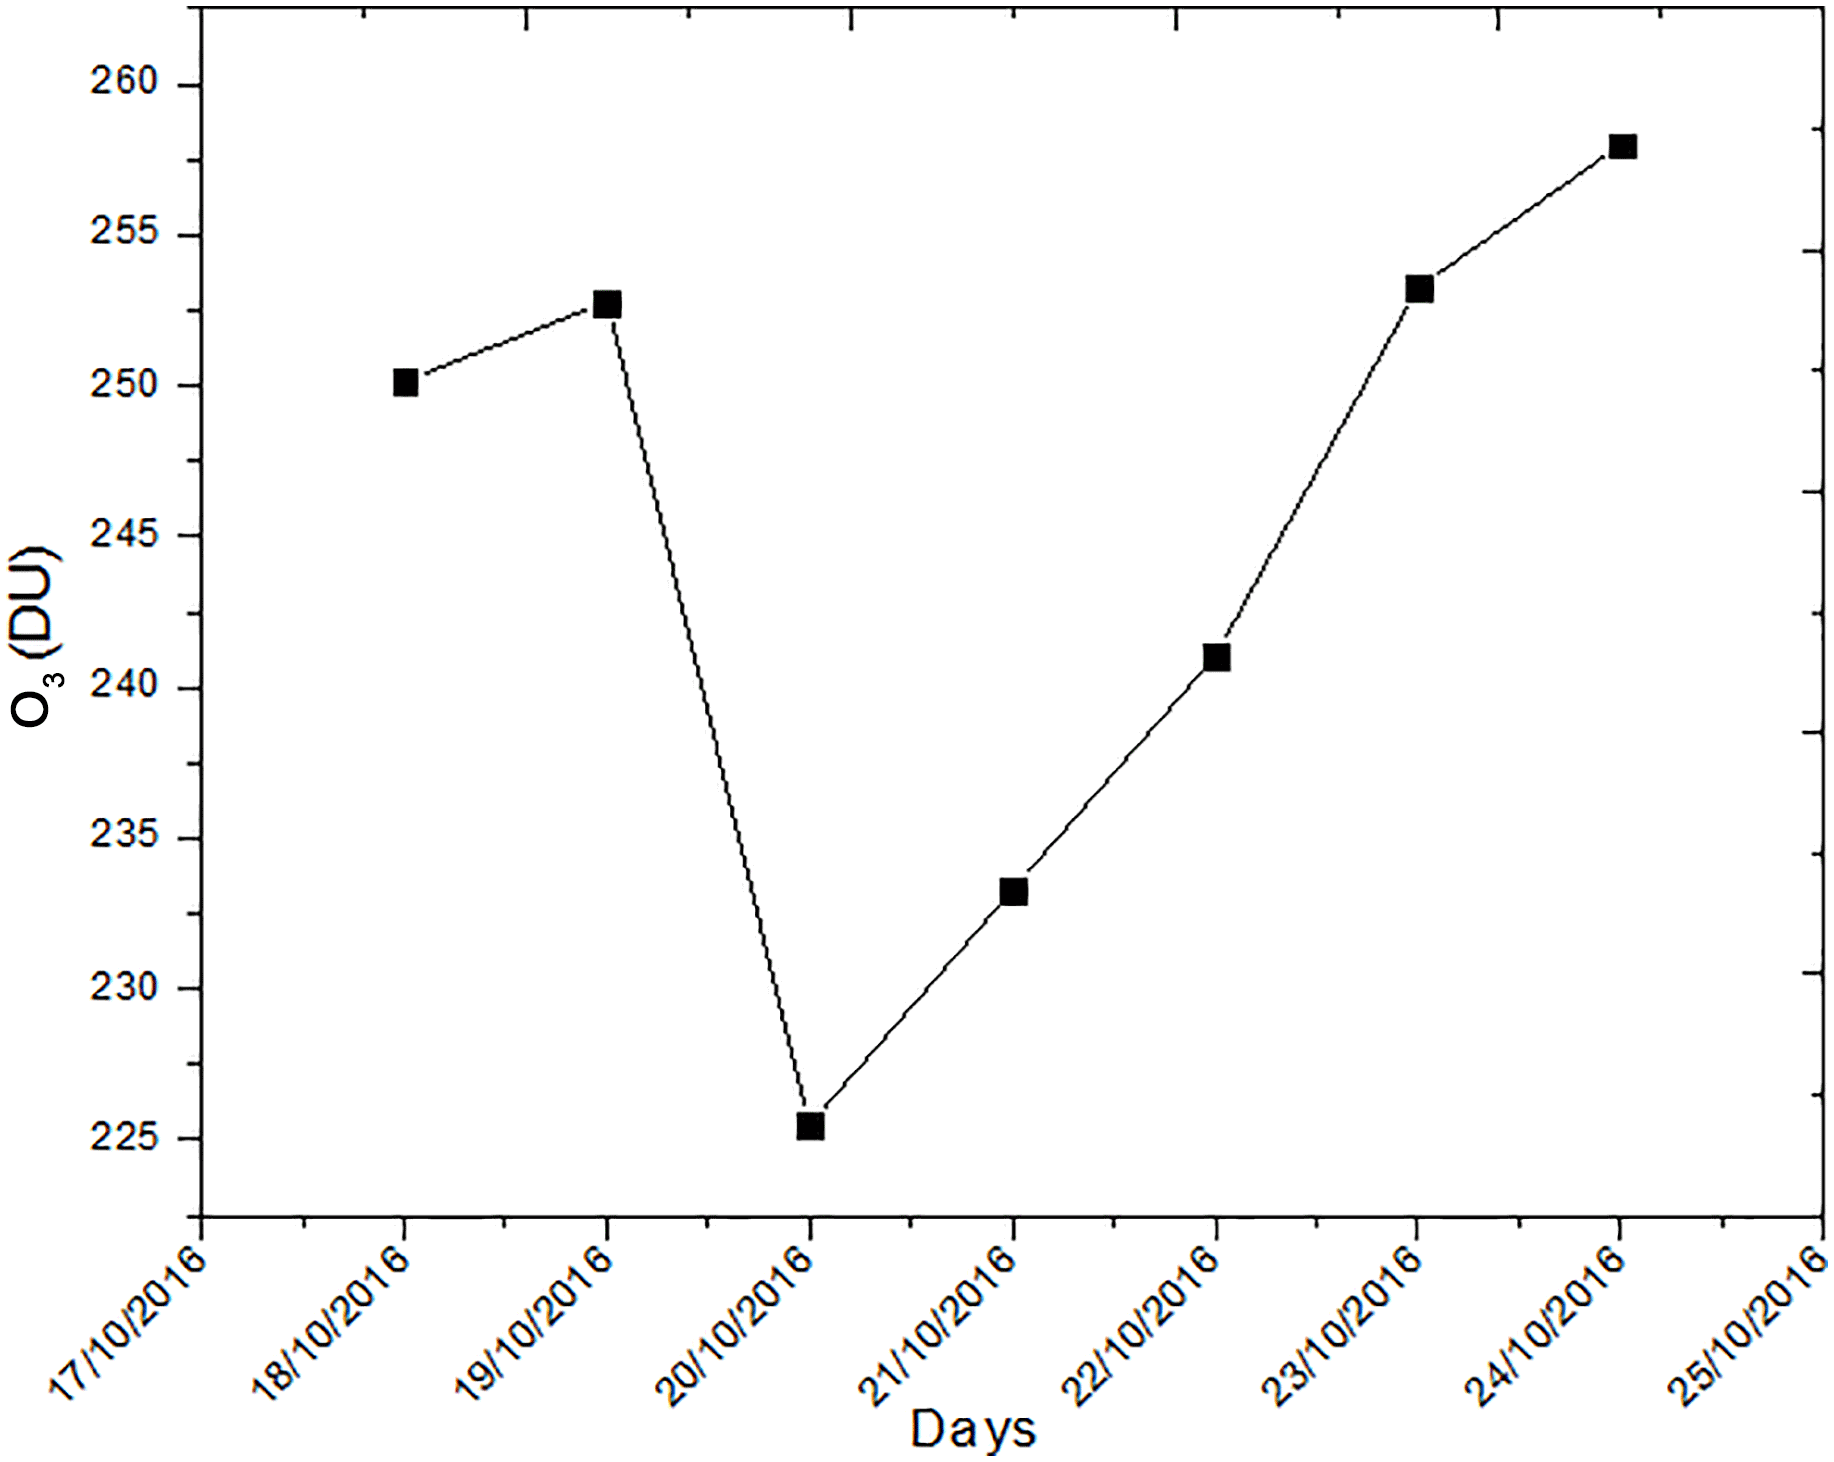
Figure 5Total ozone column as measured by the Brewer Spectrophotometer at the Southern Space Observatory (SSO/INPE), São Martinho da Serra/RS-Brazil from 18 to 24 October 2016.
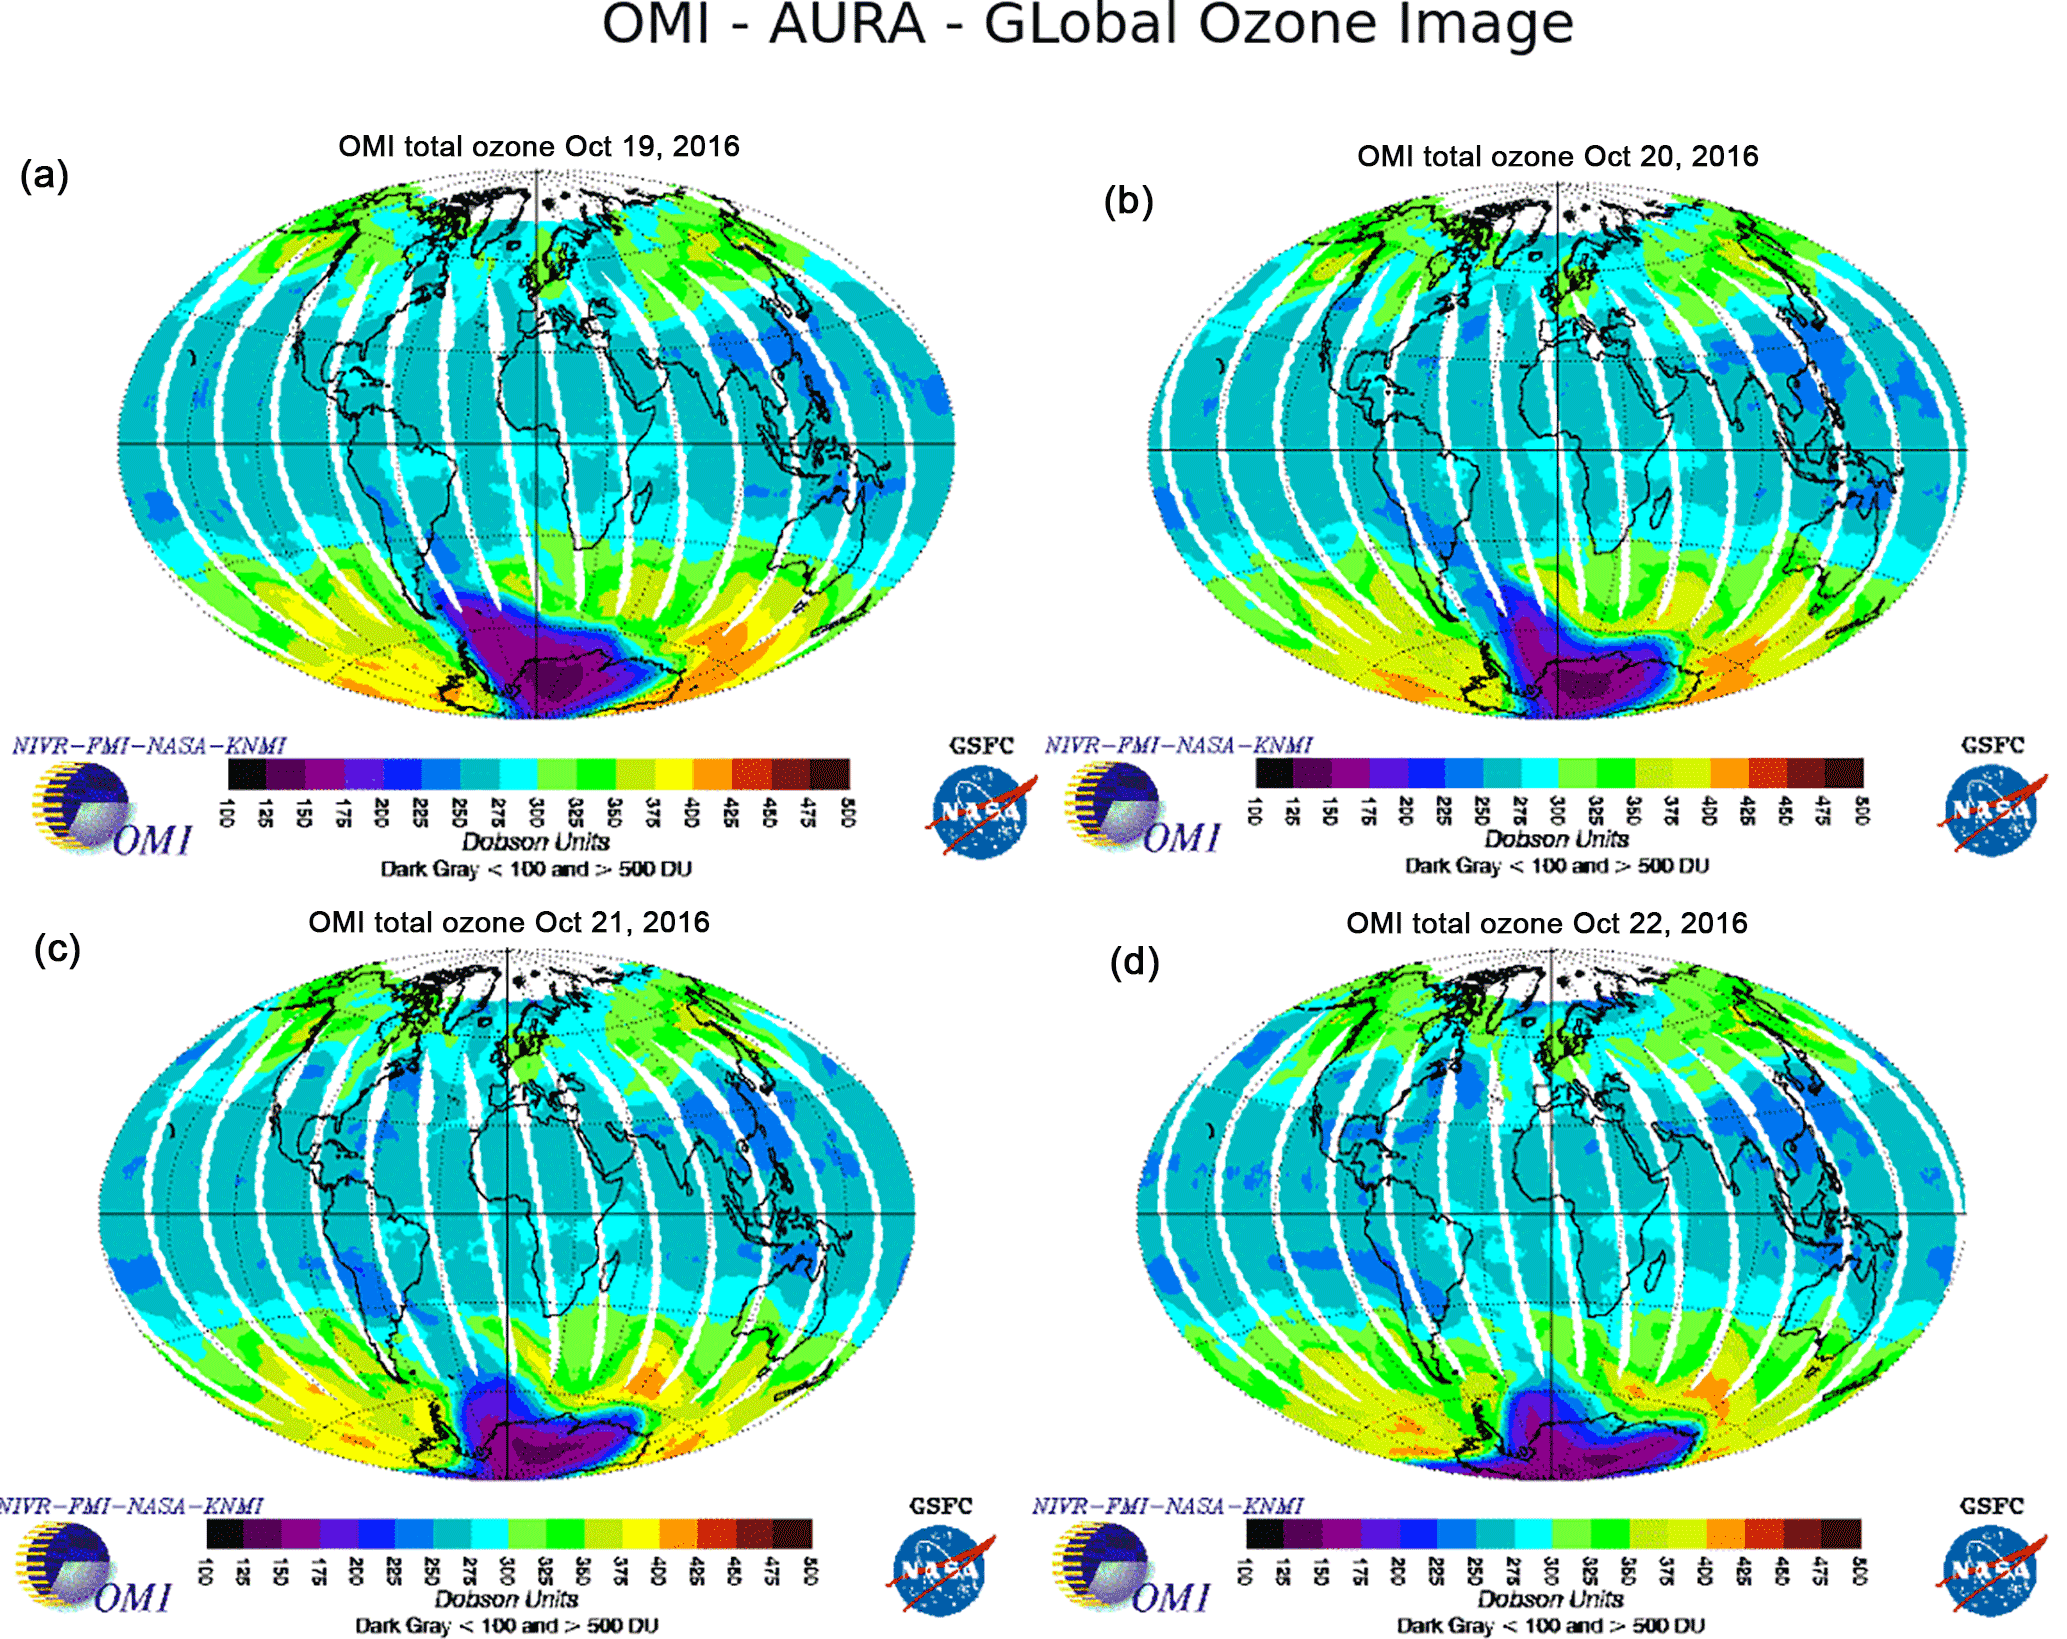
Figure 6Time evolution of the total ozone column as observed by the OMI-ERS2 satellite from 19 to 22 October 2016. Available at OMI (2018). The effect of the ozone hole over South America, especially over Uruguay and southern Brazil, which is the region highlighted in the light blue plume.
According to the instruments presented above, data were collected in southern Brazil and Uruguay. The locations of each ozone and temperature profile collected by the satellites and sounding balloon are in Fig. 2. The TIMED/SABER satellite, which is denoted by a blue circle, passed over the regions of interest on 19 October in Uruguay and in the coastal region of Rio Grande do Sul on 23 October. The AURA soundings, which are denoted on the map by a red circle, passed over Uruguay on 20 October and southern Brazil on 21 October. The ozonesonde was launched on 21 October in Santa Maria (red triangle) and reached 31 km height east of the launching site (orange triangle). In addition to these instruments, a closet temperature profile, which was retrieved from GPS radio occultation (green circle on the map), was used for the temperature profile and obtained by radiosonde for a reliable comparison since the two profiles were very close to each other.
Ozone profiles are shown in Fig. 3 for 19, 20, 21 and 23 October. There were no satellites passing over the regions on 22 October. The vertical dashed lines delimited the peak positions from the climatology and observations at around 24 km height. The ozone profile was obtained over the Uruguayan region (near the coast) at around 14:00 UT on 19 October by the AURA/MLS satellite (red profile), which is depicted in Fig. 3a. This shows a regular behaviour (main peak around 24 km height) that is very similar to the climatology for the state of Rio Grande do Sul (grey profile).
On 20 October the TIMED/SABER satellite (blue profile) carried out measurements at about 110 km to the north of the previous day over Uruguay. These sounding data reveal a considerable decrease in ozone concentration when compared to the climatology (Fig. 3b). In fact, this is the most prominent decrease registered during the observation period, with an opposite peak to the climatology, which was at around 24.5 km height with the same order of magnitude (∼ 120 µhPa). This intense inversion of the layer exposes evidence of an influence of the ozone hole. On 21 October (Fig. 3c), which is the day the ozonesonde was launched, the poor ozone air mass was identified by both the balloon (in Santa Maria) and the AURA/MLS satellite (∼ 130 km to the east of Santa Maria). These two instruments uncovered a significant decrease in the ozone profile at around 24 km height. The balloon profile (black points) presented a larger decrease when compared to the AURA/MLS profile (in red), although it presented positive agreement between the two profiles throughout the coincident altitudes measured. Despite the measurements not being performed at the exact same place, both the balloon and the AURA/MLS satellite presented very similar ozone profiles. These profiles displayed less intense reduction than the previous day over Uruguay and approximately 60 µhPa below the climatology peak (half of the previous day's reduction). Nevertheless, this apparatus unveiled a reversal of the ozone layer at around 24.5 km height and showed the influence of the ozone hole over Santa Maria.
As previously mentioned, there were no measurements for the ozone and temperature profiles on 22 October. However, the Brewer Spectrophotometer registered that the total ozone content was still low on this specific day (Fig. 5). The ozone for 23 October recovered considerably according to the TIMED/SABER satellite data retrieved over the coast of the state of Rio Grande do Sul (Fig. 3d). Although the ozone profile had a considerable reduction on this day (∼ 45 µhPa) at the nominal ozone peak in relation to climatology, the ozone layer was recovering, with its main peak at about 20 km height with a value higher than the climatology maximum.
The temperature response to the high ozone depletion over Uruguay and southern Brazil, which occurred mainly on 20 and 21 October, warrants special attention. A sequence of temperature profiles from 19 to 23 October is presented in Fig. 4 in the same way as in Fig. 3. An ordinary temperature profile that is very similar to the climatology is detailed in Fig. 4a with a tropopause height at around 16 km, which is in agreement with data shown in Fig. 3a, where no record of a significant decrease in the ozone layer was identified. Notwithstanding, with the arrival of a polar air mass over Uruguay on 20 October the temperature profile showed a double tropopause and one inversion layer between these two pauses (∼ 23 km height), being the absolute minimum around 25 km height. These phenomena were strongly linked to the effect of the ozone hole over Uruguay observed on this day. The upper minimum of temperature (at about 25 km) was due to the minimum of ozone registered at this height. The temperature inversion (∼ 23 km), on the other hand, was a consequence of energy deposition (from above) in the residual ozone below the ozone minimum. From 22 to 21 km the ozone continued to decrease with another minimum (∼ 21 km) being registered, which is related to the lower tropopause. The temperature profile above 25 km followed its expected behaviour.
On 21 October (Fig. 4c), the balloon, AURA/MLS and radio occultation (GPS-RO) measurements presented the tropopause right after the tropopause (∼ 19 km) presented by climatology, which is a consequence of ozone content reduction. The temperature measurements from the balloon and GPS-RO satellite showed practically identical values from ∼ 3 km height to the tropopause, even though the balloon and GPS-RO obtained their profiles at quite distinct local times (2.5 h apart) but were nevertheless very close to each other. Furthermore, it is possible to identify an inversion layer around 22 km height, although in this case the main tropopause is located ∼ 5 km below the maximum in ozone concentration, more specifically at ∼ 19 km (from the balloon) or 8 km (from GPS-RO and AURA/MLS). A second minimum in temperature (as observed by the balloon data) is located just below the ozone minimum, which is at about 23 km.
The temperature profile obtained from the TIMED/SABER satellite near the coastal region of Rio Grande do Sul on 23 October can be seen in Fig. 4d. This graph shows that the thermal structure in the upper troposphere and lower thermosphere was already returning to normal conditions. The typical condition in terms of temperature is noted by the high similarity between the TIMED/SABER and climatological profiles, where they match each other around the tropopause (15–17 km heights) and altitudes between 26 and 31 km (the highest altitude reached by the balloon). This confirms that the polar air mass, which is poor in ozone, was already leaving southern Brazil and is therefore in agreement with the ozone recovering process in Fig. 3d at about 20 km height.
The Brewer Spectrophotometer also performed measurements of the total ozone content between 18 and 24 October over São Martinho da Serra/RS-Brazil (29.53∘ S, 53.85∘ W) (Fig. 5). Ozone is in Dobson units (DU) and ordinary values were observed around 250 DU for 18 and 19 October. Still, ozone content dropped to an extreme value of ∼ 225 DU on 20 October. Afterwards, the ozone column began to recover and almost stabilized on 23 and 24 October.
The HYSPLIT/NOAA model (Fig. 1) also confirmed the event occurrence by using three distinct altitude levels (∼ 22–28 km). It showed the final position of the backward trajectories over southern Brazil where the air mass, which was poor in ozone, acted on 20 October (Fig. 1a) and 21 October (Fig. 1b). The backward trajectories correspond specifically to the heights of 22 (red line), 24 (blue line) and 28 km (green line) that are the same height levels used by Bittencourt et al. (2018) in this special issue for the analysis of the potential vorticity associated with this event.
The height levels in the HYSPLIT/NOAA model were chosen according to the height where the ozone maximum was identified. These trajectories show the arrival of the ozone filaments directly from the Antarctic region, which originated from the main ozone hole. Finally, the images of the OMI-ERS2 satellite (Fig. 6) also demonstrate the Antarctic ozone mass over a wide region in Argentina, Uruguay and southern Brazil. The air mass with low ozone concentration was more dominant from 20 to 22 October, especially in southern Brazil and Uruguay (the regions analysed here).
The influence of the Antarctic ozone hole may reach mid-latitudes. Results of this study corroborate previous ones such as performed by Kirchhoff et al. (1996), who reported an ozone content reduction in Santa Maria for a couple of days in October of 1993. Their results suggested that the ozone content presented two minimums: ∼ 250 DU on 19 and 28 October. In that study, the monthly average data were taken for two stations, one with data collected for 19 years and the other for 13 years, with typical total ozone content reported around 290 DU. In the present study, a larger decrease was observed when compared to Kirchhoff's, with a minimum of approximately 225 DU on 20 October, which can be considered a very intense influence of the ozone hole over southern Brazil. Similarly, validation of the Brewer Spectrophotometer data using daily averages from the TOMS satellite is also presented and, therefore, a positive correlation was observed. Additionally, the present study also confirmed the influence of the Antarctic ozone hole at mid-latitudes by using validated profiles of the ozone sounding with the TIMED/SABER and AURA/MLS satellites. The Brewer Spectrophotometer, backward trajectories by HYSPLIT/NOAA and images from the OMI-ERS2 satellite were also used and exhibited excellent agreement, thus corroborating data obtained from our sounding balloon.
Another study that showed ozone profiles created by ozonesonde for the region of Santa Maria was by Guarnieri et al. (2004), with data from November 1996 to April 1998, which were used to build the climatology used in this study. They also built the ozone climatology by seasons (autumn, winter, spring and summer), based on 35 ozonesonde profiles, showing that ozone content is higher in winter and spring (with a peak of ∼ 135 µhPa at ∼ 23 km height) than in summer and autumn. In the present study, a minimum value of 70 µhPa was observed at the expected ozone peak (∼ 24 km) in spring, which corresponds to a value of ∼ 52 % of typical ozone content observed by the climatology for spring. A maximum value of ∼ 110 µhPa (22 km height) was observed, while the climatology for the same altitude was about 120 µhPa. This intense ozone layer depletion was explained by the influence of the Antarctic ozone hole that reaches mid-latitudes in austral spring. This effect was remarkable from 20 to 21 October 2016. Furthermore, Guarnieri et al. (2004) reported a temperature profile climatology by using the same 35 records of ozone sounding data over Santa Maria. These data presented the tropopause at about 16–17 km height with a minimum temperature of −70∘ C, whereas in our observations the tropopause was around 19 km with a corresponding temperature of ∼ −77∘ C, which is much colder than the climatology at the same height. The characteristics of these temperatures show the impact of the ozone hole on the temperature.
In a future study, we intend to show the behaviour of UV-B radiation during an extreme event of influence of the ozone hole through the inclusion of the calibrated UV data from the Brewer Spectrophotometer as well as satellite data, as this would show the impact of the ozone hole on UV radiation.
The results of this study confirm an extreme event occurrence of the Antarctic ozone hole influence in southern Brazil and Uruguay through a multi-instrumental analysis from 19 to 23 October 2016. Data revealed the poor ozone air mass trajectory from some days before arriving in southern Brazil and Uruguay to some days after its passage, and confirmed its polar origin. In light of this evidence, a drastic reduction in the ozone layer in the period studied could be detected and the effect of the ozone depletion was pronounced in the temperature profiles as well. The data here confirm that ozone has an influence over temperature profiles in the stratosphere. Furthermore, all the instruments used in this case study proved to be in agreement between them, with satisfactory results that confirm the influence of the Antarctic ozone hole.
All SABER satellite data used in this work have been downloaded using the SABER Custom Data Services tool available at http://saber.gats-inc.com/data.php. AURA/MLS satellite data have been downloaded by a user, available at https://aura.gsfc.nasa.gov (AURA, 2018). OMI-ERS2 satellite data are available at https://aura.gsfc.nasa.gov/omi.html (OMI, 2018). Radio occultation satellite data are available at http://www.cosmic.ucar.edu/ (COSMIC, 2018). The climatological data were obtained by Guarnieri et al. (2004). The ground-based data (Brewer Spectrophotometer) are not available online, but can be solicited directly by e-mail to José Valentin Bageston (bageston@gmail.com). The balloon data are not available online, but can be solicited directly by e-mail to Damaris Kirsch Pinheiro (damaris@ufsm.br).
The authors declare that they have no conflict of interest.
This article is part of the special issue “Space weather connections to near-Earth space and the atmosphere”. It is a result of the 6∘ Simpósio Brasileiro de Geofísica Espacial e Aeronomia (SBGEA), Jataí, Brazil, 26–30 September 2016.
This study is part of the undergraduate and graduate programmes in
meteorology of the Federal University of Santa Maria (UFSM). It was partially
supported by the Program of Scientific Initiation of the National Council for
Scientific and Technological Development (PIBIC/CNPq-INPE) under process
no. 129536/2017-2. We would like to acknowledge the Southern Regional Space
Research Center (CRS) and Southern Space Observatory (SSO) of the National
Institute for Space Research (INPE-MCTIC) for the availability of their
infrastructure. The authors are also grateful to NASA for the availability of
the data from TIMED/SABER, AURA/MLS and OMI-ERS. We would also like to thank
NOAA for the HYSPLIT model. The COSMIC data used in this study were provided
by the CDAAC of the University Corporation for Atmospheric Research (UCAR)
available at
http://www.cosmic.ucar.edu/index.html. José V. Bageston would like to thank the CNPq for grant no. 461531/2014-3. The present study combines support from the INCT-APA (CNPq process
no. 574018/2008-5 and FAPERJ process no. E-26/170.023/2008) in a project
called “Study of the Mesosphere, Stratosphere and Troposphere over
Antarctica and its connections with South America (ATMANTAR)”, under process
no. 52.0182/2006-5 of Proantar/MCTIC/CNPq and CAPES/COFECUB Program process
no. 88887.130176/2017-01.
The topical
editor, Ricardo Arlen Buriti, thanks Maria Paulete and one anonymous referee
for help in evaluating this paper.
Antón, M., López, M., Vilaplana, J. M., Kroon, M., McPeters, R., Bañón, M., and Serrano, A.: Validation of OMI-TOMS and OMI-DOAS total ozone column using five Brewer spectroradiometers at the Iberian peninsula, J. Geophys. Res.-Atmos., 114, D14307, https://doi.org/10.1029/2009JD012003, 2009.
AURA: Latin for breeze, NASA, Earth Observing System (EOS), Microwave Limb Sounder (MLS), available at: https://aura.gsfc.nasa.gov, last access: 13 March 2018.
Bageston, J. V., Wrasse, C. M., Hibbins, R. E., Batista, P. P., Gobbi, D., Takahashi, H., Andrioli, V. F., Fechine, J., and Denardini, C. M.: Case study of a mesospheric wall event over Ferraz station, Antarctica (62∘ S), Ann. Geophys., 29, 209–219, https://doi.org/10.5194/angeo-29-209-2011, 2011.
Bittencourt, G. D., Bresciani, C., Bageston, J. V., Pinheiro, D. K., Schuch, N. J., Bencherif, H., Leme, N. P., and Perez, L. V.: A Major Event of Antartic Ozone Hole Influence in th Southern Brazil in October 2016: An Analysis of Tropospheric and Stratospheric Dynamics, Annales Geophysicae, in preparation, 2018.
Butchart, N.: The Brewer-Dobson circulation, Revi. Geophys., 52, 157–184, https://doi.org/10.1002/2013RG000448, 2014.
Chubachi, S.: Preliminary result of ozone observations at Syowa Station from February 1982 to January 1983, Memoirs of National Institute of Polar Research, Special issue, 34, 13–19, 1984.
Cooper, M.: Validation of SABER temperature measurements using ground-based instruments, in: IGARSS 2004, IEEE International Geoscience and Remote Sensing Symposium, 6, 4099–4101, https://doi.org/10.1109/IGARSS.2004.1370033, 2004.
COSMIC Program Office: Constellation Observing System for Meteorology, Ionosphere and Climate, University Corporation for Atmospheric Research (UCAR), UCAR Community Programs (UCP), available at: http://www.cosmic.ucar.edu/, last access: 13 March 2018.
Foelsche, U., Gobiet, A., Steiner, A. K., Borsche, M., Wickert, J., Schmidt, T., and Kirchengast, G.: Global Climatologies Based on Radio Occultation Data: The CHAMPCLIM Project, Springer Berlin Heidelberg, Berlin, Heidelberg, 303–314, https://doi.org/10.1007/3-540-34121-8_25, 2006.
French, W. J. R. and Mulligan, F. J.: Stability of temperatures from TIMED/SABER v1.07 (2002–2009) and Aura/MLS v2.2 (2004–2009) compared with OH(6-2) temperatures observed at Davis Station, Antarctica, Atmos. Chem. Phys., 10, 11439–11446, https://doi.org/10.5194/acp-10-11439-2010, 2010.
Gettelman, A., Hoor, P., Pan, L. L., Randel, W. J., Hegglin, M. I., and Birner, T.: the extratropical upper troposphere and lower stratosphere, Rev. Geophys., 49, RG3003, https://doi.org/10.1029/2011RG000355, 2011.
Glenn, R., Ariel, S., and Barbara, S.: Realtime Environmental Applications and Display sYstem: READY, Environ. Modell. Softw., 95, 210–228, https://doi.org/10.1016/j.envsoft.2017.06.025, 2017.
Guarnieri, F., Echer, E., Pinheiro, D., and Schuch, N.: Vertical ozone and temperature distributions above Santa Maria, Brazil (1996–1998), Adv. Space Res., 34, 759–763, https://doi.org/10.1016/j.asr.2003.05.052, 2004.
HYSPLIT: Hybrid Single Particle Lagrangian Integrated Trajectory, NOAA, available at: https://ready.arl.noaa.gov/HYSPLIT.php, last access: 13 March 2018.
Kirchhoff, V., Schuch, N., Pinheiro, D., and Harris, J. M.: Evidence for an ozone hole perturbation at 30∘ South, Atmos. Environ., 30, 1481–1488, https://doi.org/10.1016/1352-2310(95)00362-2, 1996.
OMI: Ozone Monitoring Instrument, ERS-2, NASA, available at: https://aura.gsfc.nasa.gov/omi.html, last access: 13 March 2018.
WMO: World Meteorological Organization, available at: https://public.wmo.int/en, last access: 13 March 2018.
Pinheiro, D. K., Peres, L., Crespo, N. M., Schuch, N. J., and Leme, N.: Influence of the Antartic Ozone Hole over South of Brazil in 2010 and 2011, Annual Activity Report 2011, https://doi.org/10.4322/apa.2014.058, 2011.
Salby, M. L.: Fundamentals of Atmospheric Physics, International Geophysics Series, vol. 61, 1996.
SULFLUX: Rede Sul Brasileira de Fluxos Superficiais e Mudanças Climáticas, Universidade Federal de Santa Maria (UFSM), available at: http://www.sulflux.ufsm.br/gdpdt/gdpdt.html, last access: 13 March 2018.
Vaz Peres, L., Bencherif, H., Mbatha, N., Passaglia Schuch, A., Toihir, A. M., Bègue, N., Portafaix, T., Anabor, V., Kirsch Pinheiro, D., Paes Leme, N. M., Bageston, J. V., and Schuch, N. J.: Measurements of the total ozone column using a Brewer spectrophotometer and TOMS and OMI satellite instruments over the Southern Space Observatory in Brazil, Ann. Geophys., 35, 25–37, https://doi.org/10.5194/angeo-35-25-2017, 2017.
Witte, J. C., Thompson, A. M., Smit, H. G. J., Fujiwara, M., Posny, F., Coetzee, G. J. R., Northam, E. T., Johnson, B. J., Sterling, C. W., Mohamad, M., Ogino, S.-Y., Jordan, A., and da Silva, F. R.: First reprocessing of Southern Hemisphere ADditional Ozonesondes (SHADOZ) profile records (1998–2015): 1. Methodology and evaluation, J. Geophys. Res.-Atmos., 122, 6611–6636, https://doi.org/10.1002/2016JD026403, 2017.