the Creative Commons Attribution 4.0 License.
the Creative Commons Attribution 4.0 License.
 | 31 Jan 2018
Longitudinal structure of stationary planetary waves in the middle atmosphere – extraordinary years
Peter Krizan
Michal Kozubek
One important but little studied factor in the middle atmosphere meridional circulation is its longitudinal structure. Kozubek et al. (2015) disclosed the existence of the two-cell longitudinal structure in meridional wind at 10 hPa at higher latitudes in January. This two-cell structure is a consequence of the stratospheric stationary wave SPW1 in geopotential heights. Therefore here the longitudinal structure in geopotential heights and meridional wind is analysed based on MERRA data over 1979–2013 and limited NOGAPS-ALPHA data in order to find its persistence and altitudinal dependence with focus on extraordinary years. The SPW1 in geopotential heights and related two-cell structure in meridional wind covers the middle stratosphere (lower boundary ∼ 50 hPa), upper stratosphere and most of the mesosphere (almost up to about 0.01 hPa). The two-cell longitudinal structure in meridional wind is a relatively persistent feature; only 9 out of 35 winters (Januaries) display more complex structure. Morphologically the deviation of these extraordinary Januaries consists in upward propagation of the second (Euro-Atlantic) peak (i.e. SPW2 structure) to higher altitudes than usually, mostly up to the mesosphere. All these Januaries occurred under the positive phase of PNA (Pacific North American) index but there are also other Januaries under its positive phase, which behave in an ordinary way. The decisive role in the existence of extraordinary years (Januaries) appears to be played by the SPW filtering by the zonal wind pattern. In all ordinary years the mean zonal wind pattern in January allows the upward propagation of SPW1 (Aleutian peak in geopotential heights) up to the mesosphere but it does not allow the upward propagation of the Euro-Atlantic SPW2 peak to and above the 10 hPa level. On the other hand, the mean zonal wind filtering pattern in extraordinary Januaries is consistent with the observed pattern of geopotential heights at higher altitudes.
Keywords. Meteorology and atmospheric dynamics (middle atmosphere dynamics)


The stratosphere plays an important role as the atmospheric layer, which protects us by its ozone content from the damaging solar ultraviolet radiation, which to some extent affects weather and climate, which affects the whole troposphere-to-thermosphere system through the polar sudden stratospheric warming, and which mediates solar influences on the troposphere and tropospheric wave impact on the upper atmosphere and ionosphere. Stratospheric winds play an important role in the above processes and phenomena as well as in internal stratospheric processes. They create transport barriers, which isolate the polar vortex in winter (e.g. Shepherd, 2007). The Antarctic ozone hole intensification over the 1980–2001 period is not solely related to the trend in chemical losses, but more specifically to the balance between the trends in chemical losses and ozone transport (Monier and Weare, 2011). The change of ozone trends in the northern middle latitudes in the mid-1990s is predominantly of dynamical origin, particularly in the lower stratosphere (e.g. Harris et al., 2008).
Many studies use zonal means for their analyses. However, various phenomena and processes reveal longitudinal dependence. The Northern Hemisphere has a pronounced distribution of continents, mountain regions and oceans, which is reflected not only in the troposphere but in the stratosphere as well. Some phenomena introduce longitudinal differences into wind pattern, for example the El Niño–Southern Oscillation – ENSO (e.g. Weare, 2010). The total ozone in the winter higher middle latitudes has a strong longitudinal dependence, the maximum–minimum difference being more than 100 Dobson units (D.U.) (e.g. Mlch, 1994; Krizan et al., 2011). Effects of geomagnetic storms on total ozone are fully non-zonal; they disappear in zonal averages (Lastovicka, 2003). Global satellite observations provide clear spatial patterns of stratospheric gravity wave activity with gravity wave hotspots, which induce longitudinal structure in distribution of gravity wave activity (e.g. Hoffmann et al., 2014, Šácha et al., 2015). Demirhan Bari et al. (2013) found a longitudinal dependence of residual winds in the stratosphere and, through impact on the Brewer–Dobson circulation, changes in global circulation, distributions and concentration of stratospheric ozone and water vapour in the stratosphere and lower mesosphere for 2001–2006. Garcia-Comas et al. (2016) studied MIPAS temperature in the mesosphere and lower thermosphere; they observed some tide-related longitudinal oscillations in temperature.

Figure 1The climatology of geopotential heights (scale in km) for January at 0.1 (a), 1 (b) and 10 hPa (c), 1979–2013. Horizontal axis, longitude; vertical axis, latitude.
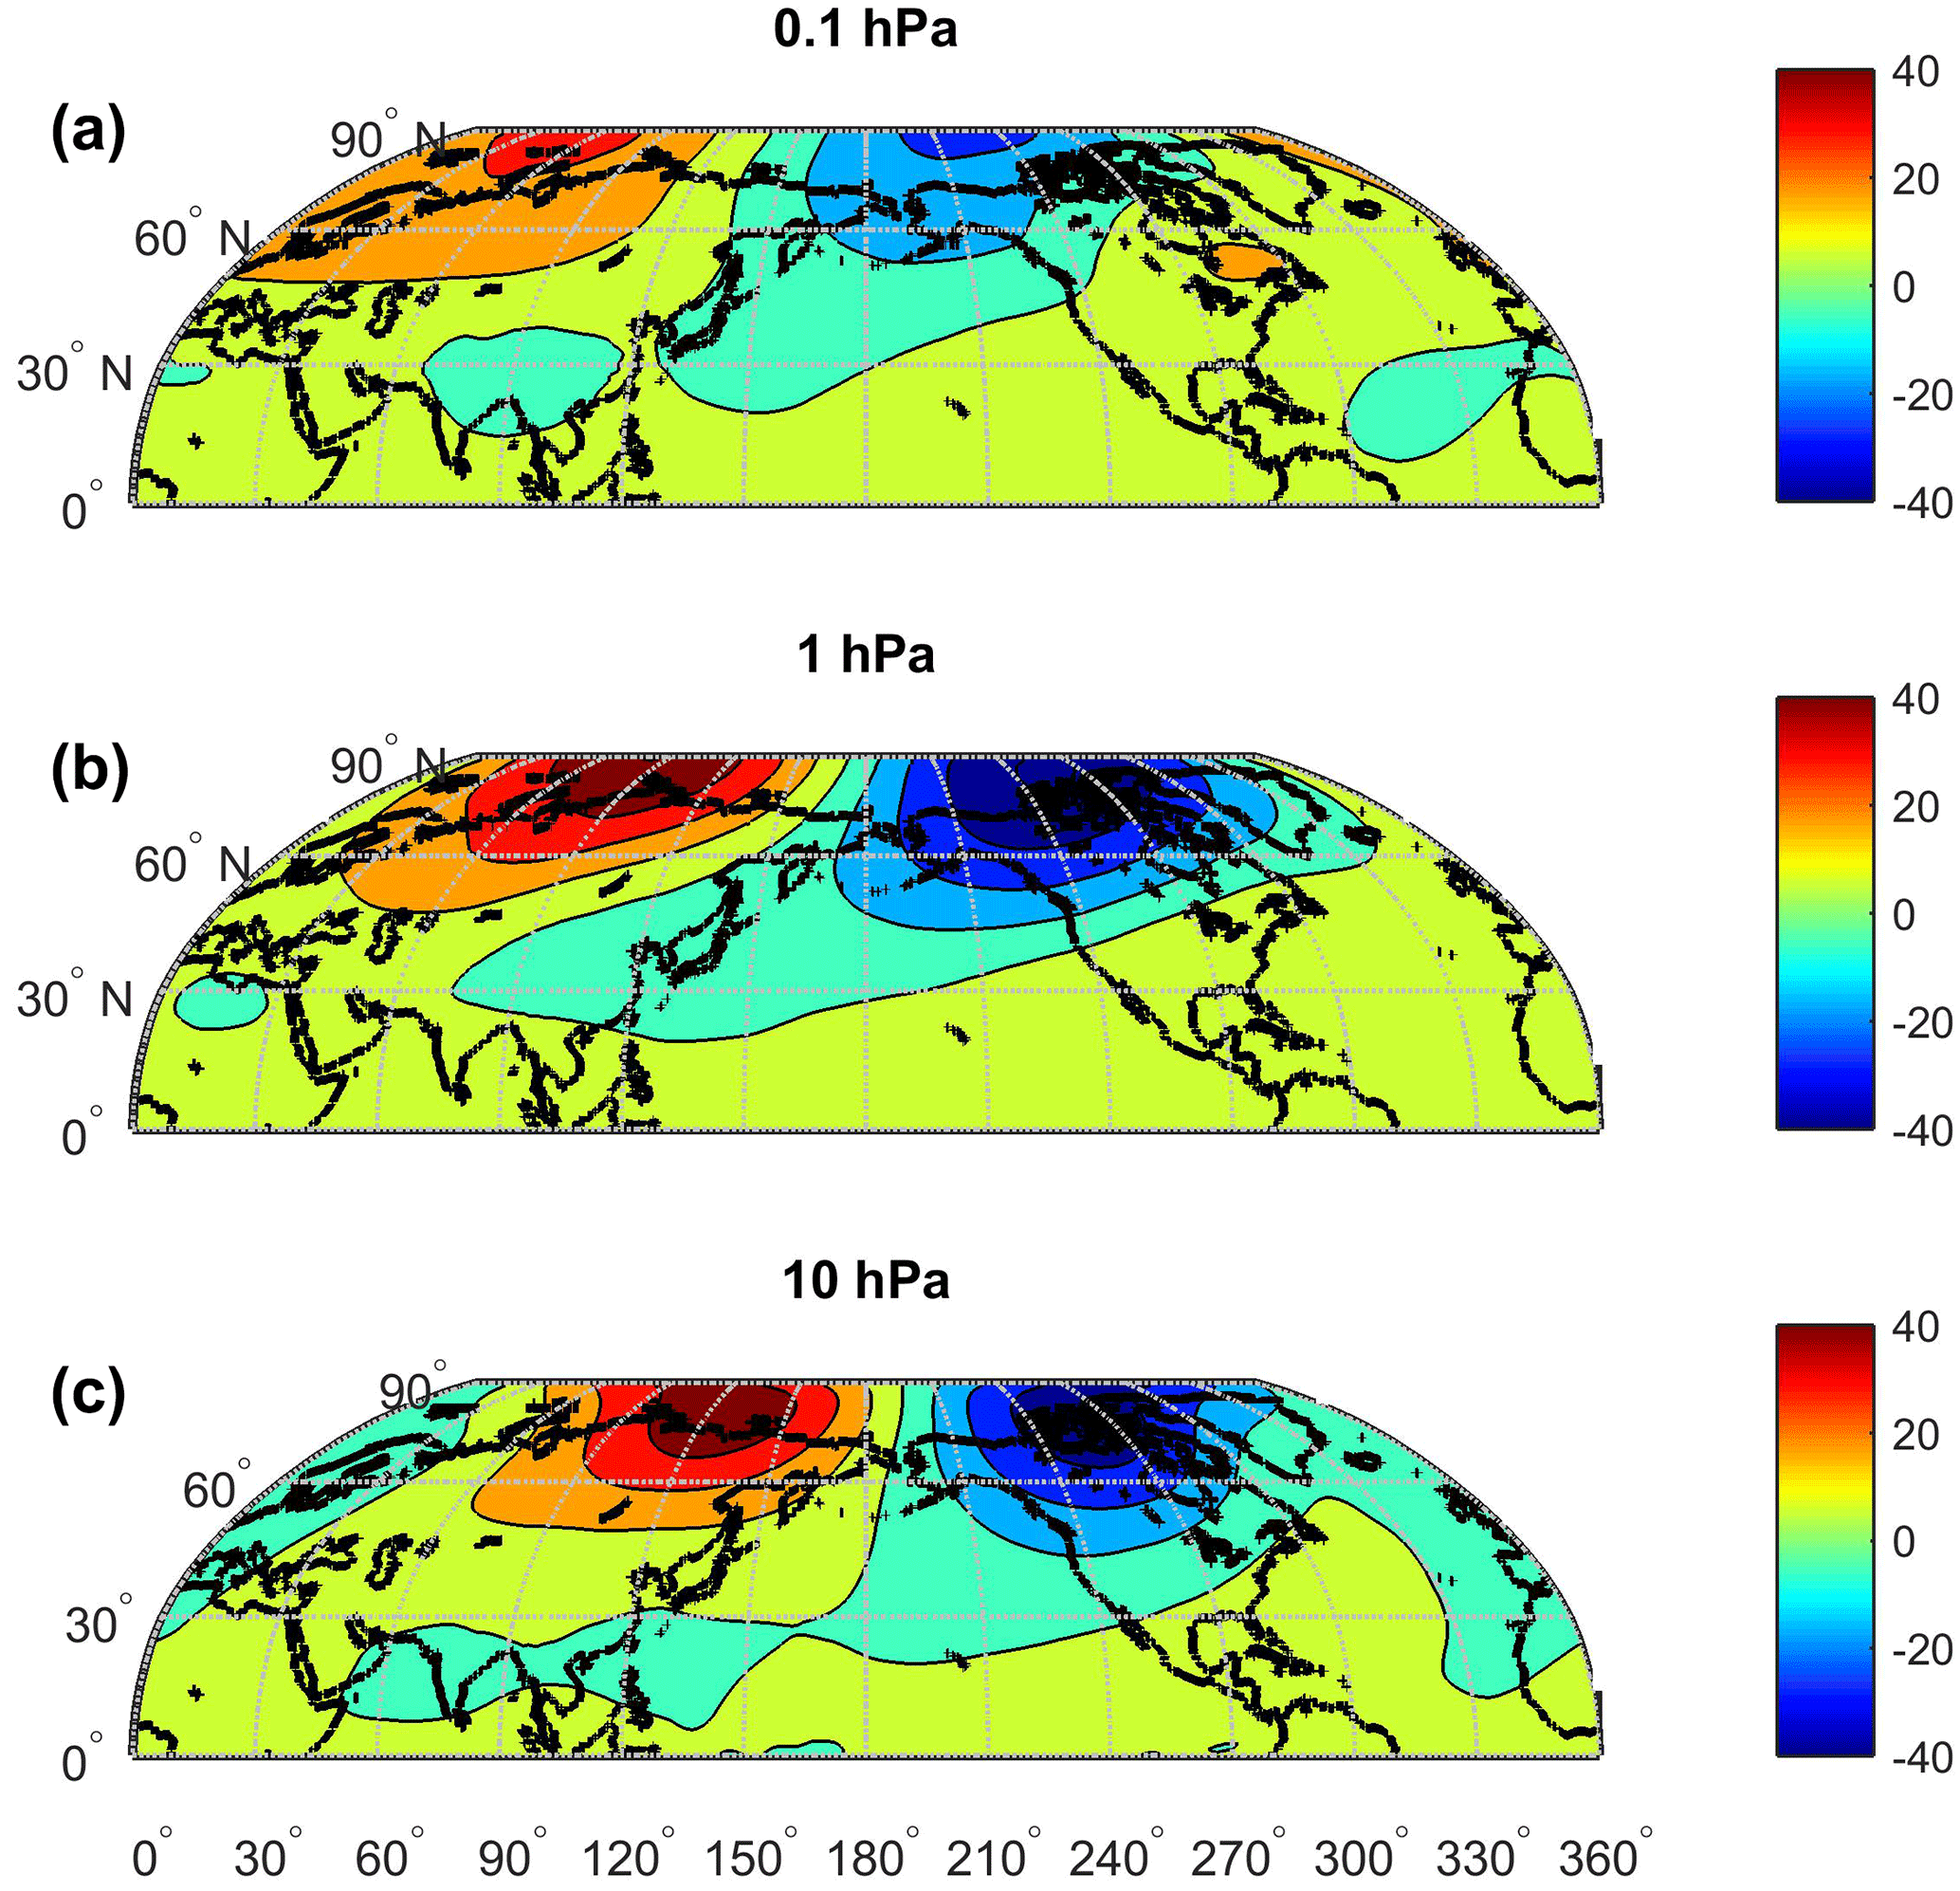
Figure 2The climatology of meridional wind (scale in m s−1) for January at 0.1 (a), 1 (b) and 10 hPa (c), 1979–2013. Positive values for southerly wind (wind from south), negative values for northerly wind. Horizontal axis, longitude; vertical axis, latitude.
The basic structure responsible for much of the longitudinal dependence in the stratosphere at higher latitudes in the winter part of the year (October–March) is the stationary planetary wave with zonal wave number 1, i.e. with one peak, which is located over the northern Pacific Ocean and is known also as the Aleutian High. Harvey and Hitchman (1996) examined 10 years (1985–1994) of data from the European Centre for Medium-Range Weather Forecast in the layer 250–10 hPa. They found the Aleutian High and its effect in geopotential height, temperature, winds, and potential vorticity. Consequently, during much of the boreal winter, stratospheric flows are highly zonally asymmetric. Harvey and Hitchman (1996) also found a westward tilt of the Aleutian High with height, which is typical for the stationary planetary waves. These results were further developed, particularly in relation to the stratospheric polar vortex, by Harvey et al. (2002). Figure 1 shows the 34-year (1979–2012) composite of the average Aleutian height in the stratosphere and lower mesosphere (10–0.1 hPa). The higher geopotential heights in the region of the Aleutian High including its westward shift are clearly visible. The most pronounced effect of the Aleutian High has been observed in meridional wind. The Aleutian High creates a barrier for the dominant wintertime westerlies and forces wind to flow northward along the barrier on the western side of Aleutian High, and the wind returns back flowing southward on the eastern side of Aleutian High. This creates two cells of the enhanced northward and southward meridional wind, as illustrated in Fig. 2. Figure 2 also shows a clear westward shift of meridional wind structures with height as is shown by Fig. 1 for geopotential height. Seasonally the two-cell structure of meridional wind appears in October and it is not observable after March.
Figures 1 and 2 present the average longitudinal pattern of geopotential height and meridional wind. This pattern is followed by individual years in most cases but there are several years which behave in a more or less different way. Analysis of these years and potential sources of their different behaviour is the main objective of this paper. Another objective is to find an altitude interval where the SPW1 pattern dominates in geopotential heights and meridional wind, and to investigate SPW development with altitude.
The structure of the paper is as follows. In Sect. 2, the data and methods are described. Then, in Sect. 3, the results of analysis are shown and, in Sect. 4, they are discussed. Section 5 contains conclusions.
To have sufficiently long (several decades) global and homogeneous data series, reanalysis must be used. Here the MERRA reanalysis (Modern Era-Retrospective Re-Analysis) is used, as it is the only reanalysis which includes the lower mesosphere (available up to 0.1 hPa). The MERRA reanalysis is described, for example, by Reichle (2012) and data are downloaded from http://disc.sci.gsfc.nasa.gov. MERRA data are available from 1979 at a slightly finer resolution but for our purpose the 1.25 to 1.25∘ grid data are sufficient, as we are interested in gross features, not in fine details. MERRA data are available daily in 3 h intervals but here we are using monthly mean data averaged over 00:00, 06:00, 12:00 and 18:00 UTC times; Kozubek et al. (2015) demonstrated that the two-cell structure of meridional wind at 10 hPa is the same for 00:00, 06:00 and 12:00 UTC. Vertical resolution is 42 levels from 1000 hPa to the top of MERRA at 0.1 hPa. Since Kozubek et al. (2015) showed that three different reanalyses provided the same longitudinal pattern at 10 hPa we believe that the use of only one reanalysis is sufficient. Here we use MERRA geopotential height, temperature, meridional and zonal wind data from 500 to 0.1 hPa, latitudes 0–90∘ N, 1979–2012. We also use the Navy Operational Global Atmospheric Prediction System (NOGAPS) extended into the mesosphere to form an Advanced Level Physics High Altitude (ALPHA) version of NOGAPS-ALPHA extending to ∼ 100 km, even though only a few years of data are available. This dataset is used to search for the top border of the SPW1 in geopotential heights. The description of NOGAPS-ALPHA can be found in Hoppel et al. (2008) and Eckermann et al. (2009).
The wind is not a quantity primarily computed by reanalysis models, it is a quantity derived from these primary quantities using the momentum balance equations (Rienecker et al., 2011). Kozubek et al. (2014) compared winds from NCEP/NCAR (National Centers for Environmental Prediction/National Center for Atmospheric Research), ERA-40 and ERA-Interim reanalysis with local winds measured by radiosondes launched in the reanalysis grid point 50∘ N, 15∘ E (station Prague-Libus). As for wind climatology, a good agreement was found among reanalyses and with Prague-Libus observations both in summer and winter for the whole period 1979–2012. Comparison of individual days between reanalysis and Prague-Libus radiosonde observations provided only a small number of days with substantially different winds, e.g. for comparisons NCEP/NCAR versus Prague-Libus it was on average 1 day per year for the 10 hPa level (Kozubek et al., 2014). We found a similar agreement also for MERRA data. This shows good applicability of the MERRA approach to wind derivation in the stratosphere (at least up to 10 hPa).
The situation in the mesosphere is different from the stratosphere. Measurements revealed a substantial contribution of ageostrophic component to meridional wind above 70 km, which resulted in constructing an empirical ageostrophic meridional wind model for heights of 70–110 km (e.g. Portnyagin and Solovjeva, 1997, and references therein). Gravity wave drag is suggested to be a likely cause of the ageostrophic motion characterizing the winter dynamics (e.g. Hall et al., 2003, and references therein). We use the MERRA reanalysis up to height of 0.1 hPa, where the MERRA approach to meridional wind derivation is still applicable. For higher heights we use the NOGAPS-ALPHA database. The meridional wind again is not the primary quantity but the NOGAPS-ALPHA appears to use acceptable approximation.
Since we study behaviour of stationary planetary waves, the basic method of analysis is constructing composite maps at different pressure levels for individual months for the whole period under study (1979–2013) and for individual years based on all individual grid points considered separately, not on zonal mean values or regional average values. These composite maps at several pressure levels also allow us to construct vertical profiles of various parameters. First the altitudinal boundaries of the region dominated by the SPW1 structure are estimated. This is followed by the main part of the paper – analysis of years which remarkably differ from the average pattern in the sense of penetration of SPW2 to much higher levels.
3.1 Altitudinal boundaries of the dominant SPW1 structure
Kozubek et al. (2015) observed the two-cell structure of wintertime (January) meridional wind at 10 hPa but a four-cell structure (SPW2) at 100 hPa. Since the effect of the SPW1 structure is most pronounced in meridional wind we analysed the January 34-year composite meridional wind at several pressure levels between 10 and 100 hPa in order to establish the lower boundary of the two-cell region. A less-pronounced but still two-cell structure was found at 30 hPa. At 50 hPa only a relatively weak remnant of the two-cell structure occurred with the first signs of a four-cell structure. At 100 hPa the four-cell structure with cells clearly weaker than those in the two-cell structure at 10 hPa is reported by Kozubek et al. (2015). Thus no strict/sharp lower boundary of the two-cell structure is found; it changes continuously, which is partly a consequence of some year-to-year variability of this boundary. Nevertheless, the 50 hPa level may be considered to be approximately the lower boundary of the two-cell structure occurrence. The four-cell structure in meridional wind corresponds to the SPW2 in geopotential heights.
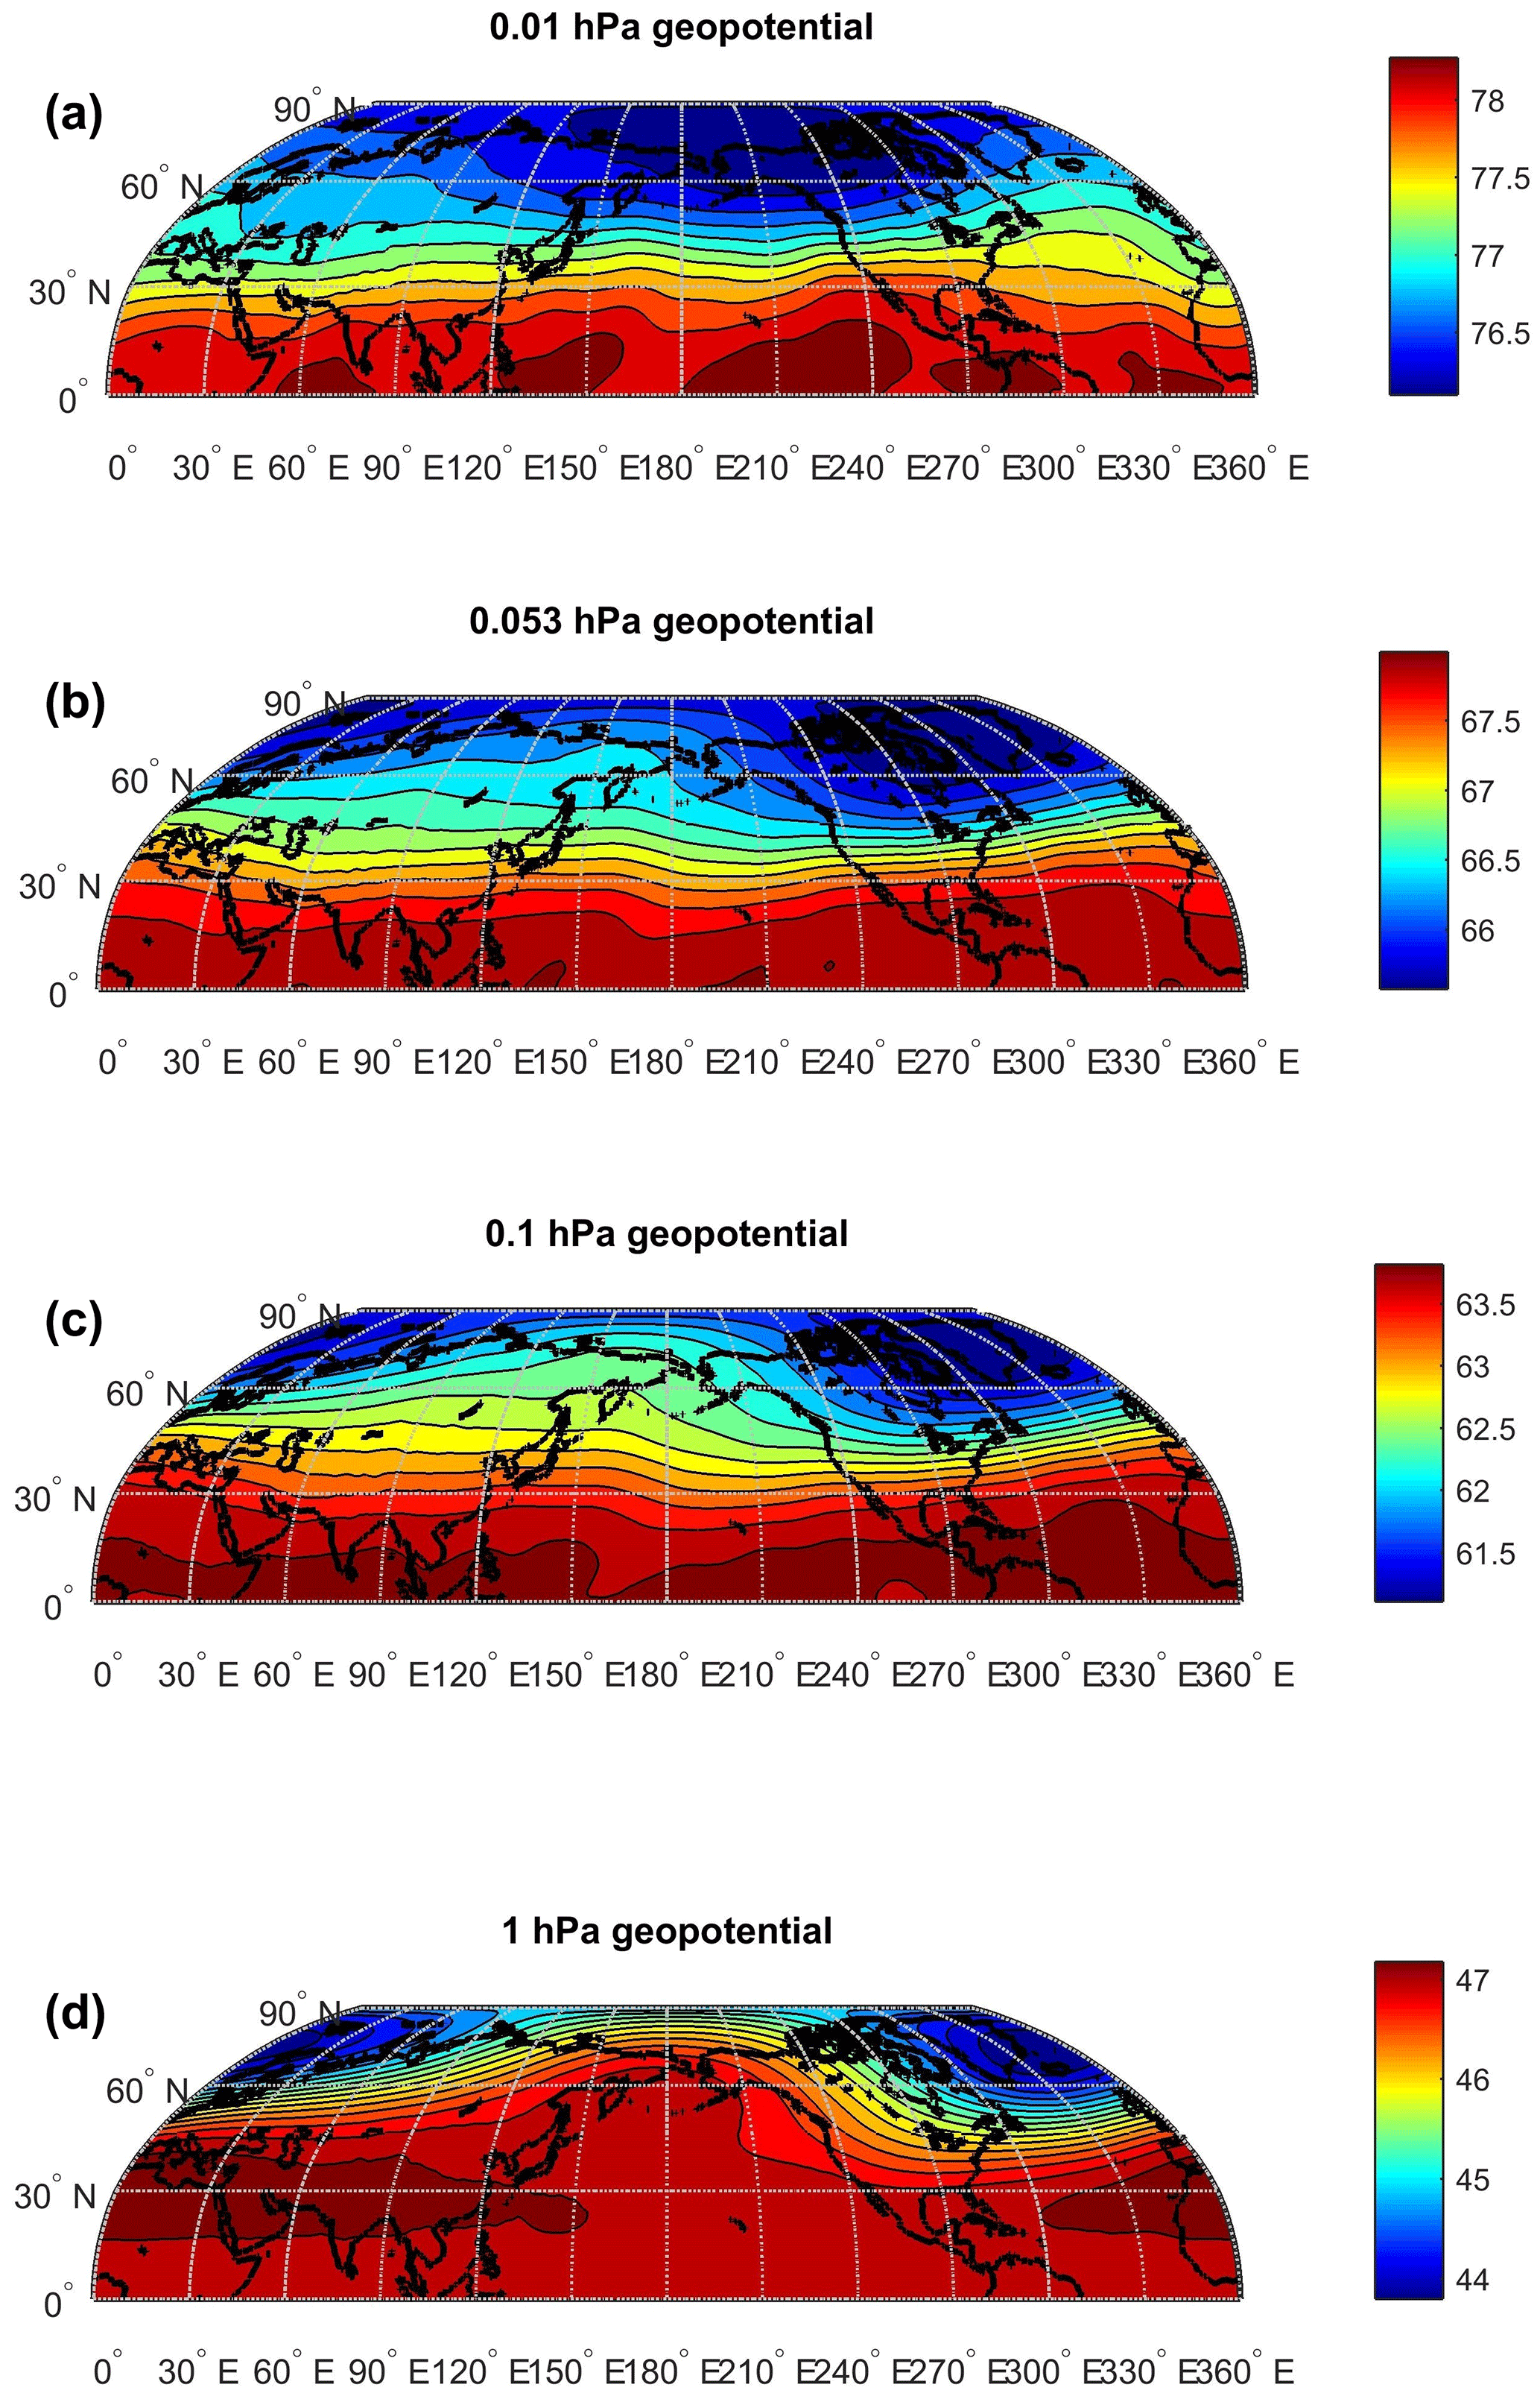
Figure 3The climatology of geopotential heights (composite of 2006, 2008 and 2010) for January, four pressure levels of 1 (a), 0.1 (b) 0.053 (c) and 0.01 hPa (d), NOGAPS-ALPHA data. Horizontal axis, longitude; vertical axis, latitude.
Data from MERRA are not available to establish the upper boundary. That is why we have to use the NOGAPS-ALPHA data for this analysis. The comparison of results from MERRA and NOGAPS-ALPHA at 10 and 1 hPa shows a very good agreement so we analyse NOGAPS-ALPHA data from January and February of 2006, 2008 and 2010 at higher pressure levels to identify the upper boundary. Figure 3 shows as an example of the geopotential height composite of Januaries of 2006, 2008 and 2010 at pressure levels of 1, 0.1, 0.053 and 0.01 (February provides the same general pattern). While the 1 and 0.1 hPa levels display a clear Aleutian High structure, which agrees with Fig. 1, and its remnant still exists at 0.053 hPa, at 0.01 hPa the Aleutian high no longer appears; it is replaced by some enhancement of geopotential heights over higher middle latitudes of the Atlantic sector. This Atlantic cell seems to be excited in situ, because it is not visible at lower levels. Again as in the case of the lower boundary, there is no sharp upper boundary but we can identify the upper boundary of the SPW1 Aleutian High structure to be between 0.053 and 0.01 hPa; 0.01 hPa level is near the upper boundary of ALPHA-NOGAPS.
3.2 Meridional wind and geopotential height pattern in extraordinary Januaries
Altogether 35 years (Januaries) were analysed, 1979–2013. Out of them 26 Januaries reveal the two-cell pattern in meridional wind at 10 hPa, which is quite similar to the average two-cell pattern shown in Fig. 2. The remaining nine Januaries, which we call extraordinary Januaries, do not display a clear two-cell structure at 10 hPa. They all reveal a tendency to a four-cell structure, which is supported by a tendency to a two-peak (the Aleutian High and another peak over the Euro-Atlantic sector) structure in geopotential heights. Those years are 1980, 1985, 1988, 1991, 1996, 1997, 2004, 2005 and 2009.
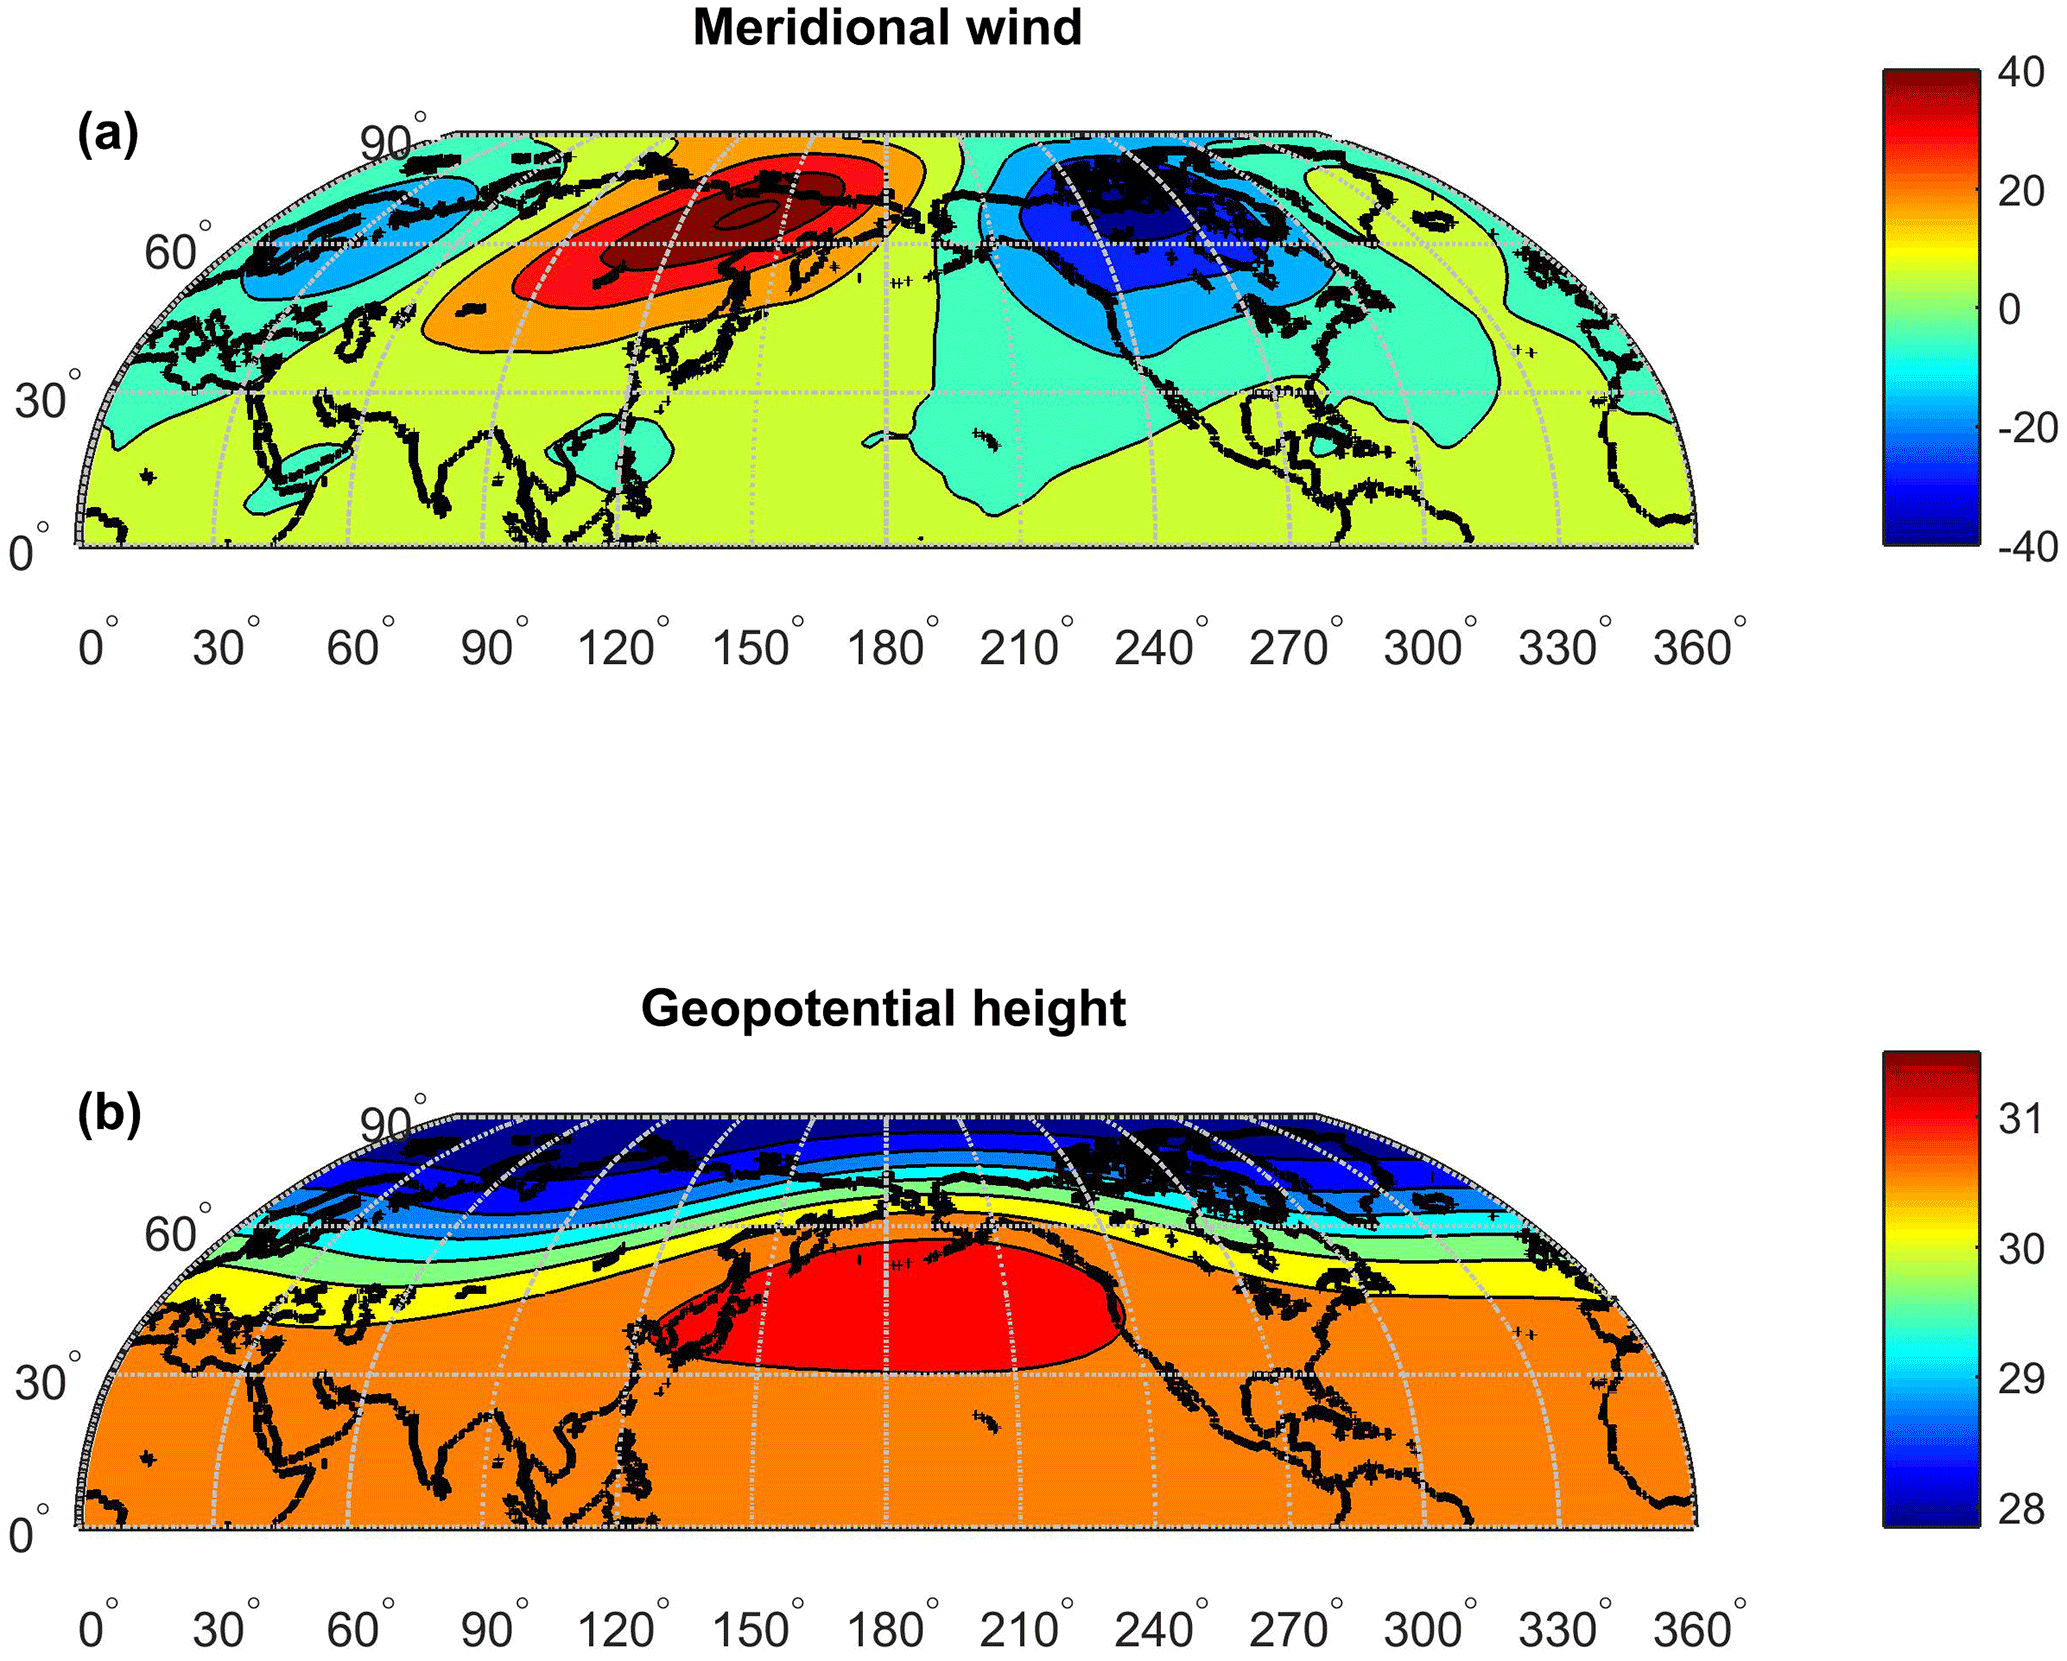
Figure 4Meridional wind (a, m s−1) and geopotential height (b, km) at 10 hPa, January 1988. Horizontal axis, longitude; vertical axis, latitude.
The four-cell structure in meridional wind is pronounced best in 2009, when the amplitudes of individual cells are comparable. This four-cell structure is weaker than the two-cell structure in “ordinary” years, but it is pronounced even at 1 hPa and it is supported by the two-peak structure in the field of geopotential height. On the other hand, the four-cell structure is expressed least in 1991, when two dominant well-pronounced cells around the Aleutian high are accompanied by two very weak cells more limited in latitudinal extent around the very weak Euro-Atlantic peak in geopotential heights, and the four-cell structure does not occur any more at 1 hPa.
The remaining seven Januaries occur between 1991 and 2009. One example is shown for 2005 in Fig. 4 for 10 hPa, which is typical for these years. The two main cells in meridional wind located on both sides of the Aleutian high at locations corresponding to the two-cell structure in ordinary years are accompanied by two much weaker cells around a weak secondary peak in the field of geopotential heights in the Euro-Atlantic sector, which is a typical pattern for the extraordinary Januaries of 1988, 1997 and 2005. Thus these years display at 10 hPa a mixture of stronger SPW1 with weaker SPW2. The two other extraordinary Januaries, 1985 and 2004, exhibit a two-cell structure at latitudes above about 75∘ N, and a four-cell structure between about 40 and 75∘ N. Such a structure is related to a corresponding geopotential height longitudinal/latitudinal distribution. The last two extraordinary years, 1980 and 1996, have the secondary meridional wind cells located at somewhat lower latitudes, between about 30 and 70∘ N. The finding that the two-cell structure in meridional wind and related SPW1 in geopotential heights at 10 hPa are similar in all individual 26 “regular” Januaries and similar to the composite structure from Fig. 1, and that even in the eight “extraordinary” Januaries such a structure dominates (Fig. 4) except for 2009 means that the climatological composites in Figs. 1 and 2 are statistically highly significant.
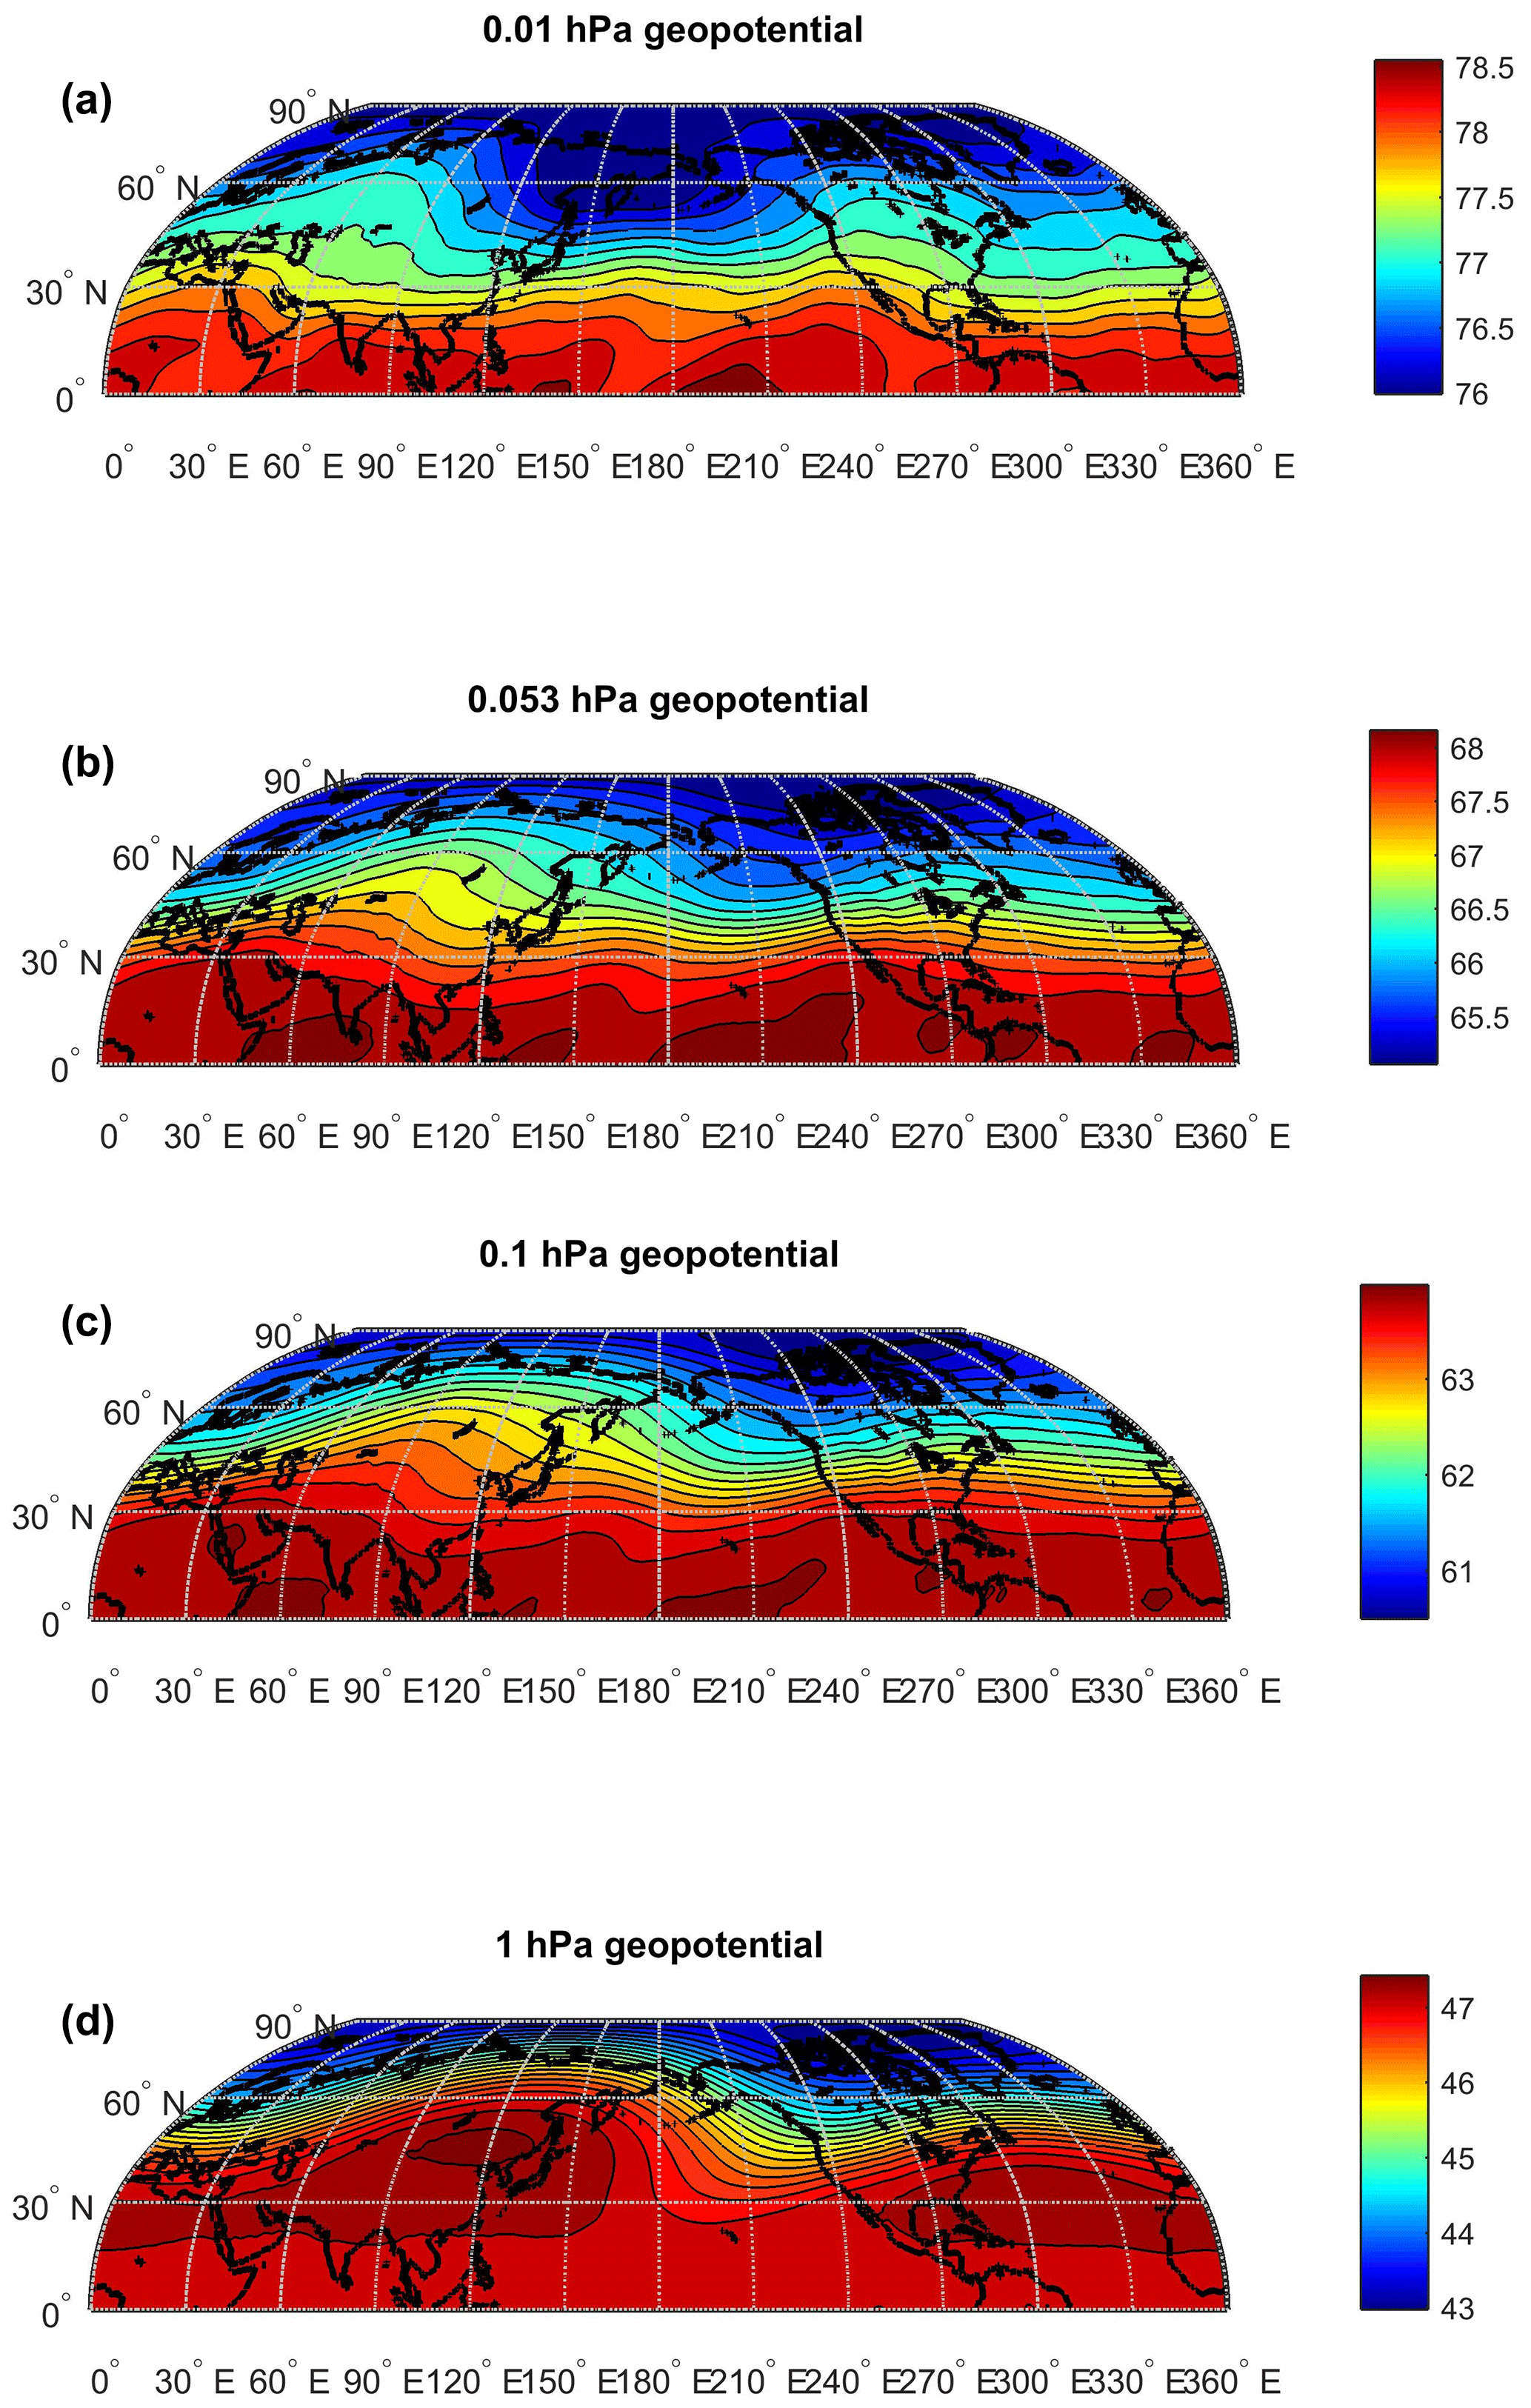
Figure 5Geopotential heights for January 2005, four pressure levels of 1 (a), 0.1 (b) 0.053 (c) and 0.01 hPa (d), NOGAPS-ALPHA data. Horizontal axis, longitude; vertical axis, latitude.
Among the nine extraordinary Januaries, all except for 1991 and 1988 display an extraordinary structure also at 1 hPa, even though less developed (smaller SPW2 contribution) than at 10 hPa with the exception of 2009. The NOGAPS-ALPHA database, which allows analysis of higher altitudes, includes the two extraordinary Januaries of 2005 and 2009. The January of 2009 is not only the most “extraordinary” year but is also generally very unusual. For instance, a strong major warming occurred in January, when it should not occur according to the Labitzke–van Loon rule on the effect of combination of solar activity and QBO phase (e.g. Labitzke, 2005). Therefore we will look at 2005, which seems to be a typical January from the group of extraordinary Januaries. Figure 5 shows for January 2005 geopotential heights, the same as Fig. 3 for the whole set of 34 years. Figure 5, contrary to Fig. 3, shows at all four pressure levels a structure which may be considered to be a mixture of SPW1 and SPW2. This structure is more pronounced at lower heights but it does exist up to 0.01 hPa. The main peak is moved somewhat westward, i.e. it is a Siberian rather than an Aleutian pressure high, and the second peak is located in the Atlantic–American sector. The second peak is pronounced best at somewhat lower latitudes, 45–50∘ N, and it is almost absent at high latitudes. The meridional wind pattern agrees with the geopotential height pattern; only above 0.1 hPa, when the ageostrophic wind component begins to play a role, is the wind pattern more chaotic and without a pronounced systematic structure. Year 2009 provides similar results.
The observational pattern seems to show that the Euro-Atlantic pressure/geopotential height peak propagating upward disappears near 50 hPa in 26 “regular” Januaries but in the 9 “extraordinary” Januaries it propagates further upwards. The weakest 1991 European–East Atlantic peak disappears between 10 and 1 hPa, and in the other seven Januaries it attains the level 1 hPa, and Fig. 5 indicates that it could propagate up to the upper mesosphere (0.01 hPa) at least in some of the extraordinary years. On the other hand, in 1988 none of both geopotential height peaks is pronounced at 1 hPa.
Table 1SPW1 amplitudes at 1 hPa (ampl. in metres) and heights where the Aleutian peak becomes dominant over the Euro-Atlantic peak (height in hPa) for 60∘ N and Januaries of all individual years (1979–2012). Extraordinary years are marked bold.
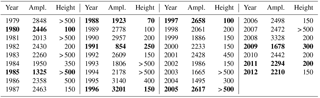
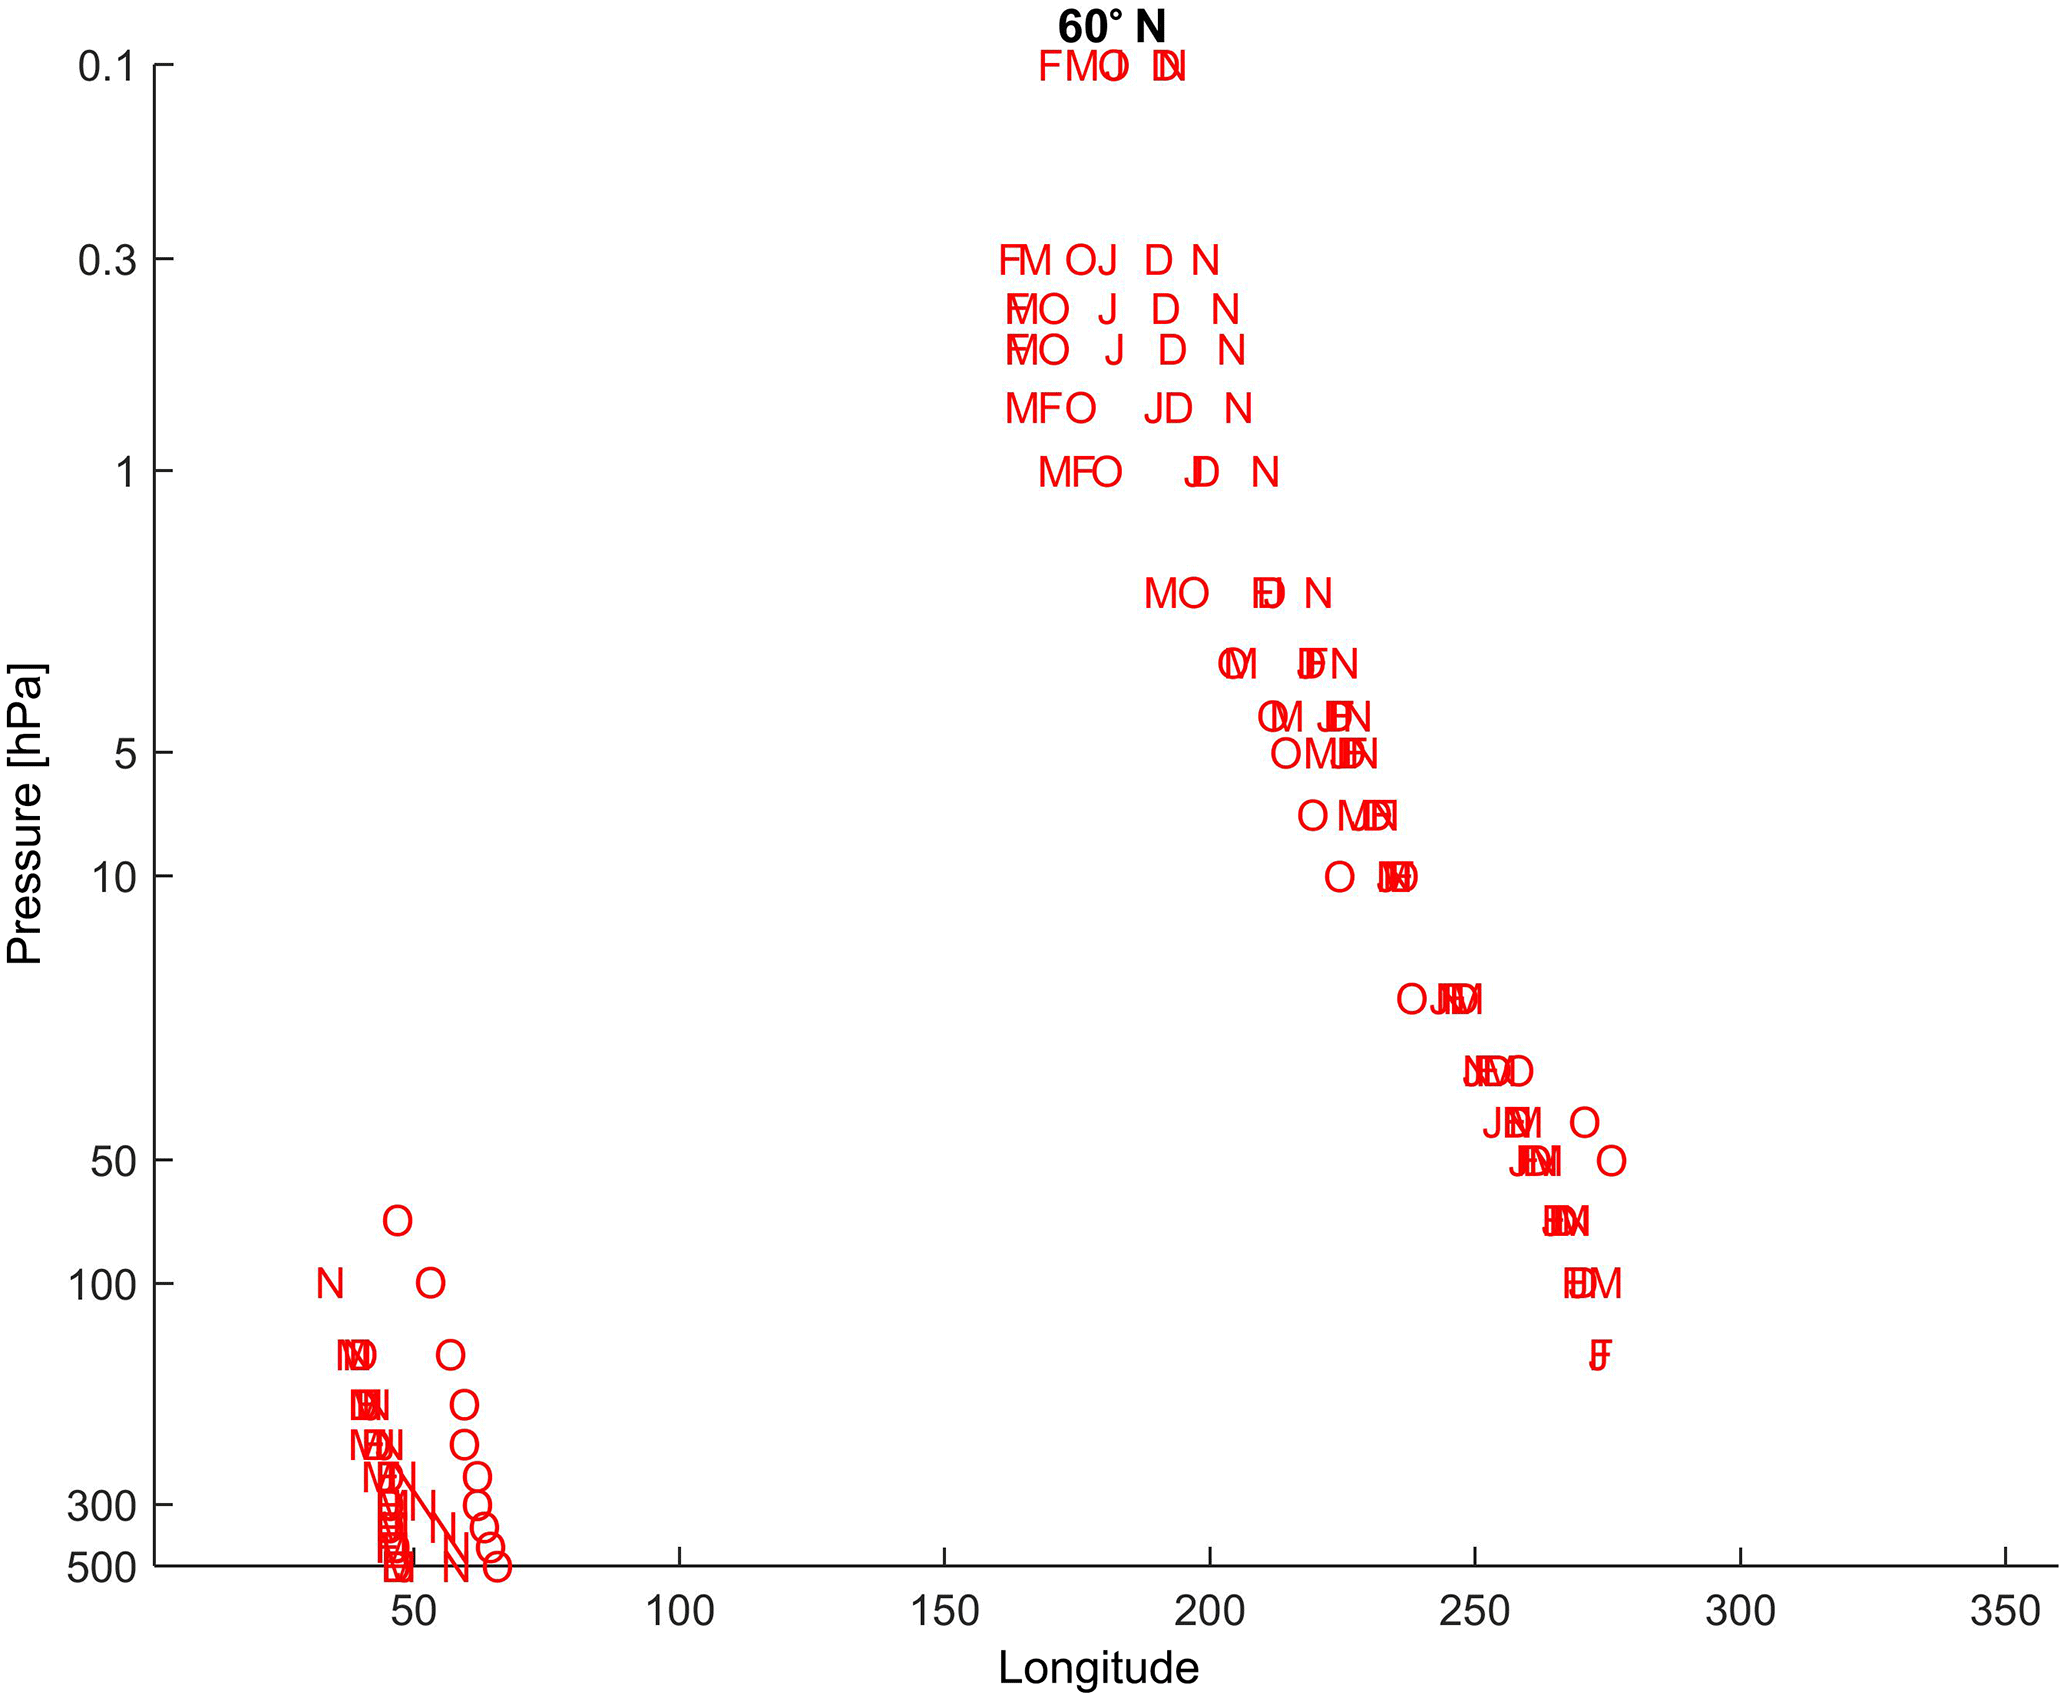
Figure 6Position of the SPW main maximum in geopotential heights at 60∘ N as a function of longitude and pressure height for individual months, October to March (marked O, N, D, J, F, M), 1979–2013.
3.3 Evolution of SPW1/SPW2 with height
To understand better the evolution of SPW1 and SPW2 with height and behaviour of extraordinary Januaries, we shall now examine the SPW1 amplitude maximum and its height and altitude ranges of dominance of the Aleutian High in the 34-year composite (1979–2012) and in individual years. The height profiles of amplitudes of SPW1 at 60∘ N, January, constructed from data at 0.1, 1, 10, 30, 50 and 100 hPa and with higher vertical resolution below, have always a well-pronounced amplitude maximum at 1 hPa for the composite profile as well as for all individual year profiles. The individual January maximum amplitudes of SPW1 at 60∘ N varied between 854 (1991) and 3328 m (2008) as shown in Table 1; the median amplitude was 2345 m. The median maximum amplitude for extraordinary Januaries reached only 1923 m (1988) and four out of five Januaries with the smallest SPW1 amplitudes were extraordinary Januaries. On the other hand, amplitudes for four extraordinary Januaries were higher than median value and the second largest amplitude was reached in the extraordinary January 1996.
The 50 hPa level was estimated in Sect. 3.1 to be the boundary above which the 34-year composite displays only the SPW1 in geopotential heights. The SPW2 predominantly dominates at tropospheric heights. However, this SPW2 is not an ideal longitudinally sinusoidal wave with two equally high maxima. One maximum is the Aleutian High slightly shifted towards Siberia, i.e. close to the Aleutian High maximum in the case of “ordinary” years SPW1. The other maximum is located in the Euro-Atlantic sector approximately 180∘ apart. Figure 6 shows the position of the SPW main maximum in geopotential height composite at 60∘ N as a function of longitude and pressure height for individual months. The Euro-Atlantic peak dominates in the troposphere. On the other hand, the Aleutian High dominates in the stratosphere. The height of change of dominance somewhat varies with month; its lowest height is approaching 200 hPa for January and February; its upper height is about 70 hPa for October. Table 1 shows these heights for January for all individual years. Their scatter is rather large; they cover an interval from more than 500 (> 500) to 70 hPa with median value 200 hPa consistent with Fig. 6. The heights of change in extraordinary years (marked by bold in Table 1) are 5 times below the median height and 4 times above the median height but these years include 1988 with the highest height (70 hPa). There is no clear relation between the height of change and the amplitude of SPW1 when considering all years together. Correlation coefficients for Januaries are very low: amplitude–height of change r=0.19, amplitude–time (long-term trend) r=0.02, height of change–time r=0.17. Temporal trend coefficients as well as the linear relation between amplitude and height of change are insignificant even at the 1σ level. The multiple regression between the height of change versus amplitude and time describes only 6 % of the total variance of height of change. Thus there is no significant long-term trend both in amplitudes and heights of change, and the relation between amplitudes and heights of change is statistically quite insignificant.
The observational pattern seems to show that the Euro-Atlantic pressure/geopotential height peak propagating upward disappears near 50 hPa in 26 “regular” Januaries but in the nine “extraordinary” Januaries it propagates further upwards. The weakest 1991 European–East Atlantic peak disappears between 10 and 1 hPa, but in the other eight Januaries it attains the level 1 hPa and Fig. 5 indicates that it at least in some of the extraordinary years it propagates up to the upper mesosphere (0.01 hPa). However, it is necessary to mention that above 0.1 hPa we have only 5 years of NOGAPS-ALPHA data, so the results above 0.1 hPa are rather preliminary.
The SPW1 in geopotential heights and related two-cell structure in stratospheric meridional wind are derived from MERRA reanalysis data, which enables us to include also the lower mesosphere, and they are extended to the upper mesosphere with the limited NOGAPS-ALPHA dataset.
The lower boundary of the climatological occurrence of the two-cell structure is estimated to be about 50 hPa in the 34-year composite. No strict/sharp lower boundary could invoke the idea that it reflects the variable bottom of polar vortex. However, this probably is not the case as in the large majority of years the lower boundaries differ rather little and the situation at the 50 hPa level has no effect on the Aleutian High peak. It is rather the consequence of dissipation and eventual disappearance of the Euro-Atlantic peak of the SPW2 structure in geopotential heights in a broader interval of heights, not in a narrow range of heights, while the Aleutian peak remains and at higher altitudes it forms therefore SPW1.
We have estimated not only the lower boundary of this structure but the upper boundary as well, even though based on the limited 5-year NOGAPS-ALPHA database. Climatologically it is located not in the stratosphere but in the mesosphere at pressure levels near or somewhat below 0.01 hPa. We compared NOGAPS-ALPHA-based results from 10 and 1 hPa with MERRA reanalysis and they agree very well. So we can consider the NOGAPS-ALPHA dataset to provide reasonably reliable results. As far as we know, NOGAPS-ALPHA is the only dataset available for the upper mesosphere. Both the estimates of the lower as well as upper boundary of the SPW1 structure were made for January. For other months these values might be slightly different.
Our finding of the upper boundary of the SPW in the upper mesosphere is consistent with model results showing that SPWs are unable to penetrate into the thermosphere (e.g. Pogoreltsev et al., 2007). Forbes et al. (2002) analysed zonal and meridional wind measurements from the HRDI and WINDII instruments onboard UARS to construct monthly average SPW structures from 15 to 110 km over the period December 1991 to September 1994 basically at ±40∘ latitude. SPW1 at 40∘ N in zonal wind was extending over all non-summer months in both hemispheres up to 80–90 km, which does not contradict our upper boundary estimate. SPW2 structures were much less prevalent because of more restrictive filtering effects due to the mean winds, which is also consistent with our results. The overall meridional wind structure at 40∘ N reconstructed from SPW1 and SPW2 was very weak (Forbes et al., 2002, their Fig. 5) again in agreement with our results (Fig. 2). Geopotential height amplitudes and their distribution were calculated also by Guryanov and Fahrutdinova (2014) based on Met Office Stratospheric Assimilated Data over 2004–2012. Their amplitudes are 2–3 times smaller than our composite amplitudes but they computed real amplitudes, whereas we use max–min difference, i.e. the real difference is only by a factor of 1–1.5; moreover, for our amplitudes over 2004–2012 this difference is even smaller, as follows from the data in Table 1. Their maximum amplitudes are located between latitudes 60 and 70∘ N at altitudes about 40–55 km; both these results reasonably agree with our results (Table 2). If we consider the different data used (we use MERRA reanalysis) and different way of estimating all parameters, the agreement may be considered satisfactory. Harvey and Hitchman (1996) found the geopotential height difference between the Aleutian High and polar vortex to maximize near the stratopause, which reasonably agrees with our estimate of SPW1 maximum at 0.1 hPa.
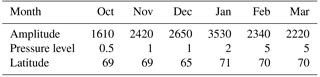
The dominant feature of SPW1 in the stratosphere is the Aleutian High. Therefore the SPW1 parameters are calculated for the geopotential height field. Vertical wavelengths estimated from the longitudinal shift with height in the stratosphere vary in a relatively broad range of values according to latitude and month with median value of 137 km. Vertical wavelengths are increasing with increasing latitude from 50 to 70∘ N, seasonally they peak in November–December, and they are smallest at the beginning (October) and end (March) of the SPW1 season. Table 2 shows further parameters of SPW1. The largest amplitude (max–min difference), about 3.5 km, is observed in January, and the smallest amplitudes are observed at the beginning and end (October and March) of the SPW1 season. The SPW1 maximum is usually located near the latitude of 70∘ N (except for December, 65∘ N) and its height decreases with increasing time throughout the winter, from 0.5 hPa in October to 5 hPa March. Figure 6 indicates different slopes (i.e. vertical wavelengths) in the stratosphere versus troposphere and lower mesosphere. The different characteristics of stratospheric and tropospheric planetary waves were observed also by Sun et al. (2014).
Table 2Stationary planetary wave amplitude (m) and location of its peak (pressure level (hPa) and latitude (∘ N)) in the stratosphere for October to March.
What is specific for the nine “extraordinary” years/Januaries 1980, 1985, 1988, 1991, 1996, 1997, 2004, 2005 and 2009? We checked various solar and dynamical parameters in order to find some correlation between the behaviour of a parameter and the occurrence of these extraordinary Januaries. The occurrence of extraordinary Januaries is not favoured either by high, or medium or low solar and/or geomagnetic activity. For 50 and 10 hPa QBO, NAO and ENSO (also with some time advance for QBO or ENSO) typically five extraordinary Januaries were under one polarity, four under the opposite polarity of each of these parameters, which means no relation with these parameters. Neither any combination of the QBO phase and solar activity favoured the occurrence of extraordinary Januaries. Another candidate is the major midwinter stratospheric warming; data are taken from http://www.geo.fu-berlin.de/en/met/ag/strat/produkte/northpole/index.html. Five winters, 1981/1982, 1987/1988, 1995/1996, 1996/1997 and 2004/2005, did not experience the major stratospheric warmings. In 1990/1991 it occurred in February, too late to affect the January average pattern. In January the major stratospheric warmings occurred in 1985 and 2004. A strong major warming occurred in late January/early February 2009, which could partly affect the average behaviour in January. However, these are only three out of nine winters, which corresponds rather to random coincidence with respect to the occurrence frequency of major midwinter stratospheric warmings. Moreover there are many other winters with major stratospheric warmings and the ordinary SPW1 structure of geopotential heights like in Fig. 1. Thus major stratospheric warming does not seem to play a significant role in the occurrence of extraordinary Januaries. There is no coincidence of extraordinary Januaries with major volcanic eruptions which affected the stratosphere (El Chichón in spring 1982, Mt Pinatubo in June 1991). There is also no coincidence with sudden cooling of the tropical tropopause layer in 2001 and 2011/2012, which resulted in drops in water vapour concentration in the lower stratosphere (Urban et al., 2014).
There are no direct global long-term wind measurements in the mesosphere at the “two-cell meridional wind” latitudes. If the upper boundary of the SPW1/SPW2 occurrence would be the level 0.01 hPa (∼ 80 km or slightly lower), the ground-based wind measurements with various radars like meteor radars provide sufficiently long data series but only for a few locations and at too high altitudes (near ∼ 90 km). Zonal and meridional wind measurements from the High Resolution Doppler Imager (HRDI) and Wind Imaging Interferometer (WINDII) instruments on the Upper Atmosphere Research Satellite (UARS), which allow us to construct monthly average SPW structures from 15 to 110 km, are available only over limited time interval and basically only at ±40∘ latitude, whereas the two-cell meridional wind structure in the stratosphere and lower mesosphere occurs predominantly at latitudes higher than 40∘ N.
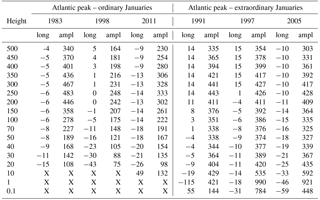
Table 3Height profiles of “Atlantic” peak of SPW2 at 60∘ N for three ordinary and three extraordinary Januaries. Longitudes (long in ∘E) and amplitudes (ampl in metres) of this peak are shown for 17 levels between 500 and 0.1 hPa based on MERRA data.
The SPW1 structure of geopotential heights in the stratosphere and mesosphere is formed by the Aleutian High. Therefore we turn our attention to indices closer to the north Pacific region. There is a slight tendency to a higher occurrence of extraordinary Januaries for the positive phase (months −2 to 0) of ENSO Modoki (six to three events), but it is not statistically significant. However, the PNA (Pacific North American) index is the only index which reveals a clear relation to the extraordinary January occurrence. All extraordinary Januaries occurred under the positive phase of PNA. On the other hand, the positive phase of PNA occurred also in many non-extraordinary Januaries. Therefore the positive phase of PNA is a necessary but not sufficient condition for the extraordinary January occurrence. However, the problem is that the “troublemaker” is not the Aleutian High but the other highs occurring in the stratosphere in the Euro-Atlantic sector, the diminishing and disappearance of which with increasing height makes the difference between the 26 “ordinary” and the 9 “extraordinary” years. We have not found any atmospheric index which could fully explain the occurrence of “extraordinary” years.
To help to clarify the behaviour of the Euro-Atlantic peak of the SPW2, height profiles of the SPW2 maximum amplitude and its position are calculated for January, 60∘ N for each year separately. Selected years as examples are shown in Table 3. All six Januaries display a westward tilt with height as expected for a SPW. Their amplitudes increase from 500 hPa toward the tropopause and reach maximum between 300 and 200 hPa. Out of 26 ordinary Januaries, 24 reached peak at 250 hPa and 2 at 300 hPa. Out of nine extraordinary years, in three years the peak was between 250 and 300 hPa, in 2 years at 250 hPa, and once at 200 and 300 hPa; in 1996 and 2009 (the most extreme year), the tropopause region peak was absent and amplitudes were continuously growing up to their maximum at 10 hPa. A systematic difference between ordinary and extraordinary years appears at higher heights. The Euro-Atlantic SPW2 amplitudes in ordinary Januaries continuously decrease with increasing height up to a height where they cannot be identified, which is in the case of the 3 years shown in Table 3 the level of 10 hPa (peak at 10 hPa in 2011 is a local disturbance, not continuation of Atlantic peak). In some other years this level differs, mostly it is lower. Moreover, too small amplitudes compared to the Aleutian High amplitude do not result in creating the detectable secondary cells in meridional circulation; therefore the average level of disappearance of the four-cell meridional wind structure in composite maps is close to 50 hPa. On the other hand, in the seven extraordinary years, which display the tropopause peak of the Euro-Atlantic SPW2 amplitude, the amplitude first decreases to about 50–70 hPa but much less than in ordinary years, and then it increases to a maximum in 10–1 hPa contrary to the behaviour of ordinary Januaries (Table 3). Thus the ordinary and extraordinary Januaries do not differ systematically in the troposphere but they differ systematically in the stratosphere, particularly in the middle and upper stratosphere.
Different filtering by winds in the Aleutian High sector and the Euro-Atlantic sector is a possible cause of different behaviour of the Aleutian and Euro-Atlantic peaks with increasing height. Model calculations by Nigam and Lindzen (1989) show high sensitivity of stratospheric SPWs to changes in zonal wind and an important role of polar night jet and subtropical jet in strengthening SPWs. Karami et al. (2016) derived from NCEP/NCAR reanalysis data the probability density functions (PDFs) of positive vertical wave number and documented that these probabilities (i.e. vertical propagation of SPWs) are decreasing with increasing zonal wave numbers, which agrees with our results showing better propagation of SPW1 than of SPW2.
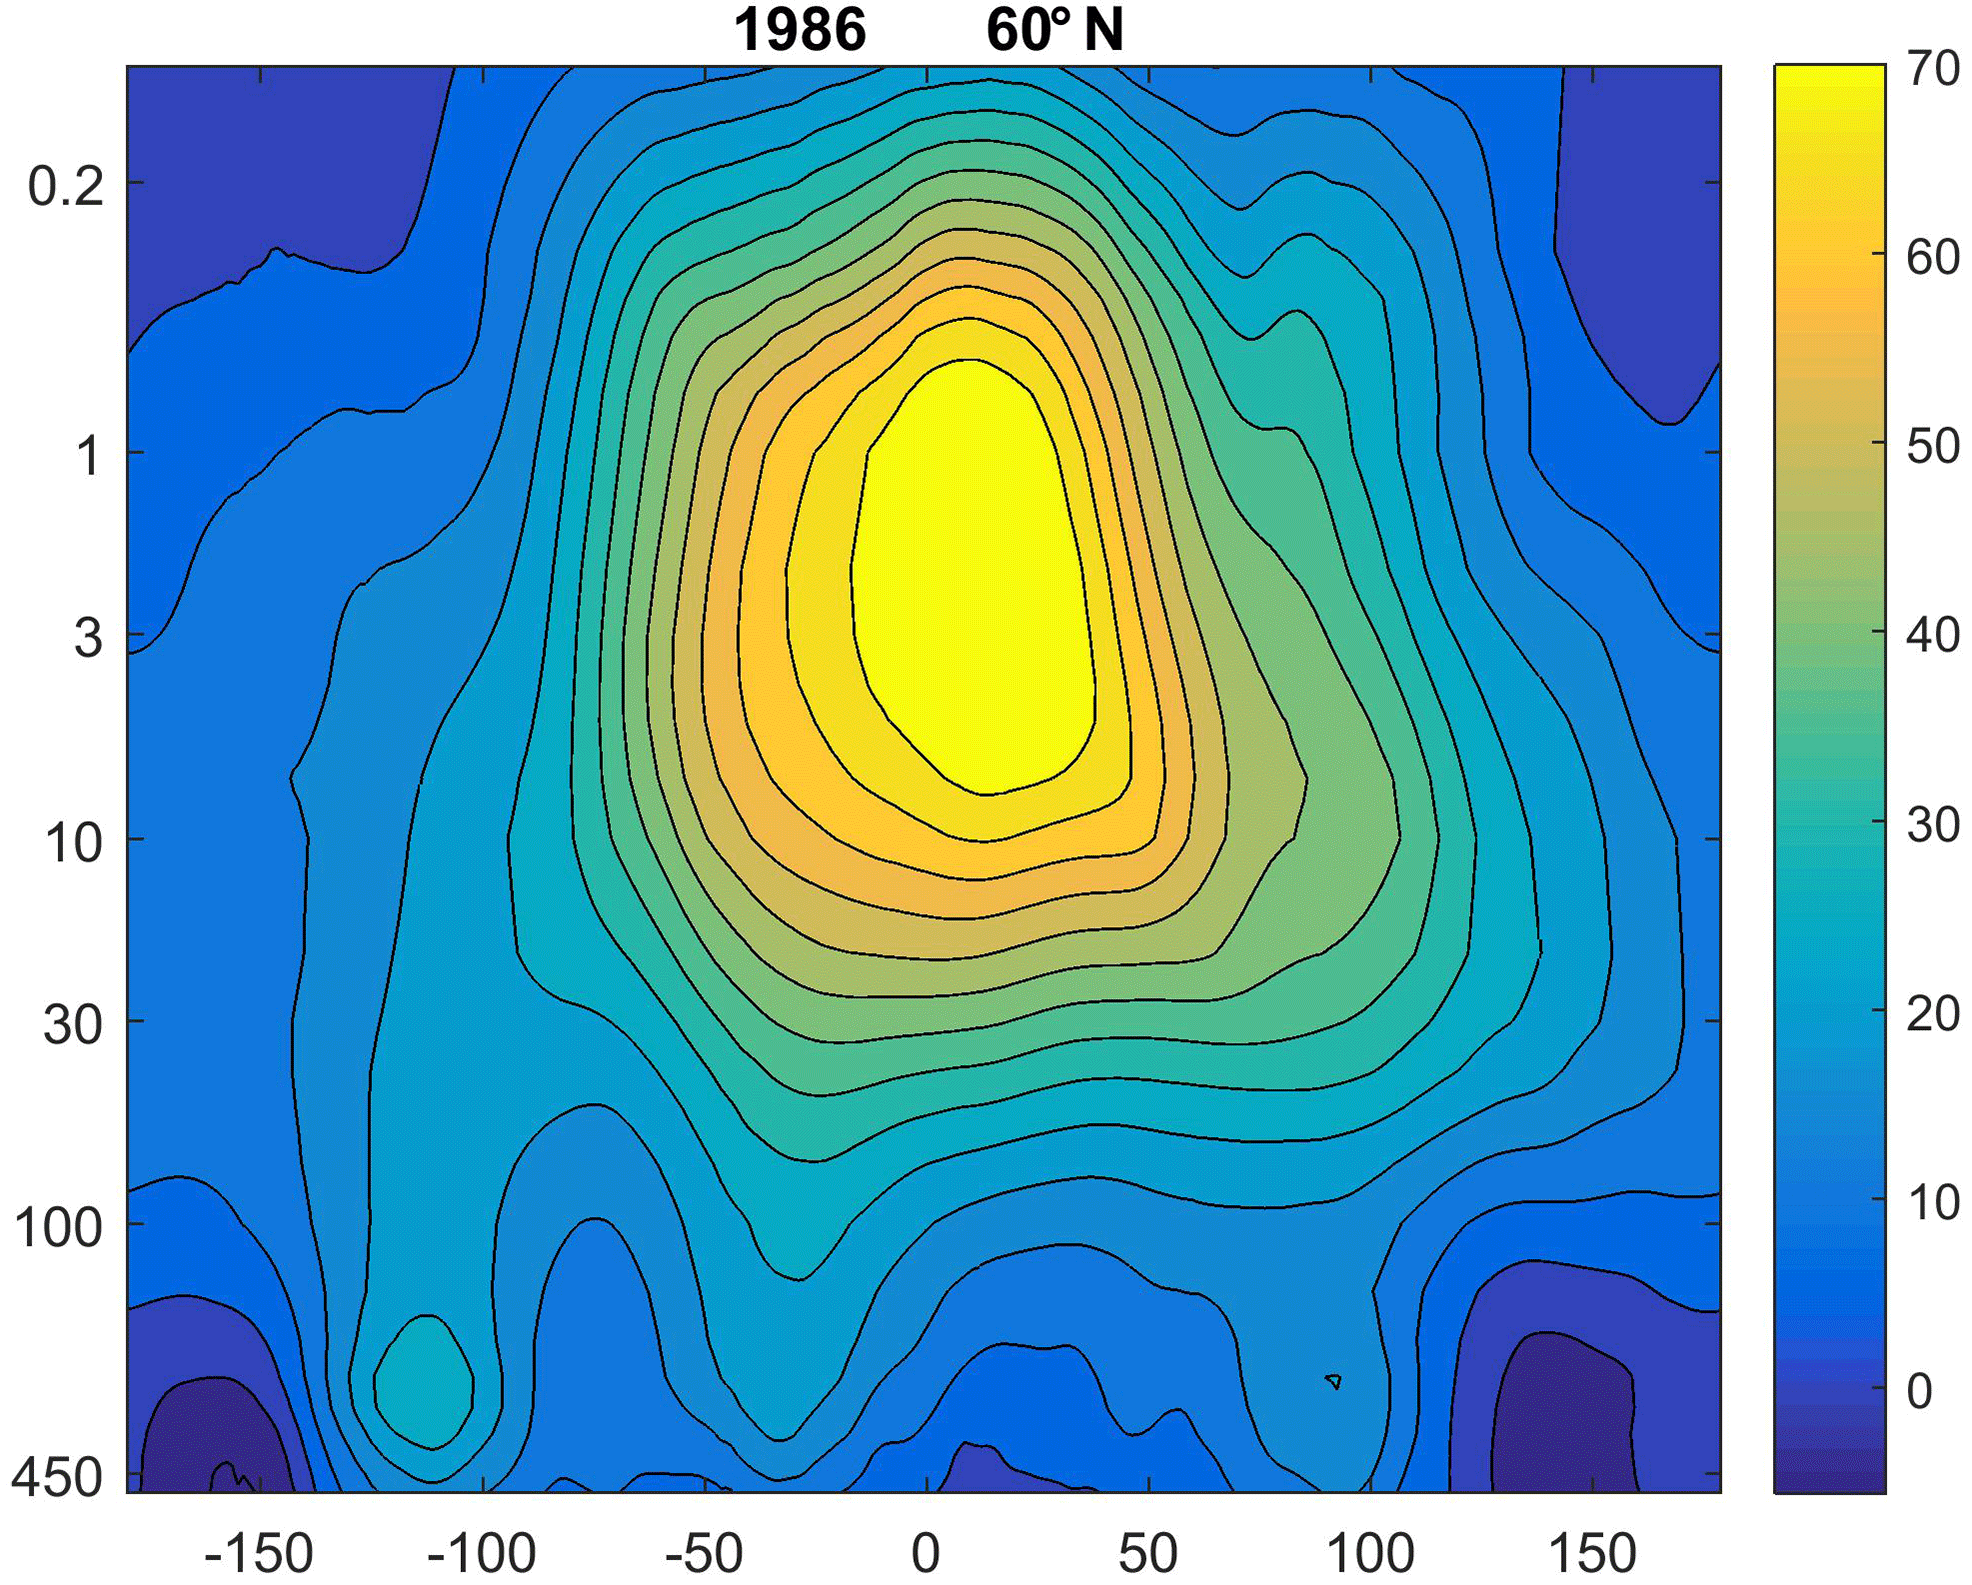
Figure 7Monthly mean zonal wind in “ordinary” January 1986. Strong stratospheric winds in the Euro-Atlantic sector and weak winds in the Aleutian sector are clearly visible.
According to Holton (1992) in a slightly simplified approach, the stationary planetary waves can propagate vertically upwards only in the presence of relatively weak mean zonal westerly winds with velocities between zero and the Rossby critical velocity and therefore they propagate clearly upward into the middle atmosphere only in winter, not in summer, which agrees with our results.
Let us now look at the monthly mean zonal winds in January, which are westerlies. Latitude 60∘ N is selected as representative latitude. In ordinary years there was a systematic difference between zonal winds in the Aleutian and Euro-Atlantic sectors in January. In the large majority of ordinary years the zonal wind in the Euro-Atlantic sector (centred at ∼ 0∘ E) was strong in the stratosphere and did not allow the upward propagation of the Euro-Atlantic peak of SPW well into the middle atmosphere, whereas the zonal westerlies in the Aleutian sector (centred at ∼ 180∘ E) are much weaker, as illustrated by Fig. 7 for 1986 and, therefore, allow the upward propagation of the Aleutian peak of SPW, thus creating the SPW1 structure at higher levels of the stratosphere and in the mesosphere. In a few remaining ordinary winters the difference is not so large but still the zonal westerlies in the Aleutian sector are evidently weaker than in the Euro-Atlantic sector.
Thus in the ordinary years (Januaries) the change from the SPW2 or mixed SPW1–SPW2 longitudinal structure to SPW1 structure with increasing altitude appears to be the consequence of zonally asymmetric wind filtering, which diminishes the Euro-Atlantic peak of SPW2. How is it in extraordinary years?
In 1991, when the Euro-Atlantic peak in geopotential heights is observed at 10 hPa but not at 1 hPa, a region of strong westerlies at 60∘ N is located above 10 hPa and filters out this peak, which thus cannot reach the 1 hPa level. In 1988, when the SPW structure appears at 10 hPa but no SPW peak penetrates to 1 hPa, strong zonal winds at all longitudes (which is quite unusual) block upward penetration of SPW up to 1 hPa. Even 50 and 70∘ N display such a blocking. In 1985 and 2004 stronger winds occur only above 1 hPa and in each sector there is a range of longitudes where winds are not strong enough to block the upward penetration of both SPW peaks. In 2005 and 2009 there are channels of weaker westerlies in both sectors, which allow upward propagation of both SPW peaks into the mesosphere. In 2005 such a channel for the Euro-Atlantic sector is narrow, and therefore the Euro-Atlantic peak in geopotential heights is probably much weaker than the Aleutian peak. Westerlies in years 1980 and 1996 clearly allow upward SPW peak propagation in the Aleutian sector and to a limited extent in the Euro-Atlantic sector; consequently the Euro-Atlantic peak still exists at higher altitudes, but it is substantially weaker than the Aleutian SPW peak. As for the year 1997, the zonal wind structure at 60∘ N should not allow the propagation of both SPW peaks above about 10 hPa. Therefore it is necessary to look at 50 and 70∘ N. In 1997 westerlies support upward propagation of the Aleutian peak at 50 and 60∘ N and the Euro-Atlantic peak at 70∘ N, so in some way a longitudinal structure with dominant Aleutian and minor Euro-Atlantic peak can be created.
Thus the different SPW filtering by zonal wind appears to explain the difference between the ordinary and extraordinary years. Why the zonal wind distribution and strength in different years differ is out of the scope of this paper.
The main results of this study based on MERRA data over 1979–2012 with some support by NOGAPS-ALPHA data, which is focused mainly on years which do not follow the dominant behaviour, are as follows:
-
The well-pronounced two-cell longitudinal structure of meridional wind, which is a consequence of the SPW1 in geopotential heights in the Aleutian sector, does exist northward of 40–45∘ N.
-
They occur only in the winter half of the year (October–March).
-
They cover the middle and upper stratosphere and most of the mesosphere with the lower boundary on average near 50 hPa and the upper boundary near or slightly below 0.01 hPa. Below 50–100 hPa, a SPW2 structure in geopotential heights exists with the other peak in Euro-Atlantic sector and related four-cell longitudinal structure in meridional wind.
-
The SPW1 in geopotential heights and two-cell longitudinal structure in meridional wind is a relatively persistent feature; only 9 out of 35 winters (Januaries) do not display this structure in a pure form. Even these nine winters predominantly exhibit a strong Aleutian peak and remarkably weaker Euro-Atlantic peak in geopotential heights, i.e. the mixture of dominant SPW1 with weaker SPW2 with respective mixture of the two- and four-cell structure in the meridional wind.
-
The ordinary and extraordinary Januaries do not differ systematically in the troposphere but they differ systematically in the stratosphere, particularly in the middle and upper stratosphere, and also in the mesosphere. The Euro-Atlantic SPW2 peak in geopotential heights increases in magnitude up to the tropopause region peak for both types of years. However, then the magnitude of the Euro-Atlantic peak in extraordinary years decreases much less than that of ordinary years (in 1996 and 2009 even continuously increases) and above 50–70 hPa it again increases contrary to ordinary years up to a peak at 1–10 hPa, while this peak in ordinary years diminishes until becoming non-detectable.
-
All extraordinary Januaries occurred under the positive phase of PNA. On the other hand, the positive phase of PNA occurred also in many non-extraordinary Januaries. Thus it seems to be a necessary but not sufficient condition for the appearance of extraordinary Januaries. Other meteorological, solar or geomagnetic indices as well as sudden stratospheric warmings did not reveal a relation to the occurrence of extraordinary Januaries.
-
The decisive role in the existence of extraordinary years (Januaries) appears to be played by the SPW filtering by the mean zonal wind pattern, which is strongly dependent on longitude. In all ordinary years the mean zonal wind pattern in January allows the upward propagation of SPW1 (Aleutian peak in geopotential heights) up to the mesosphere but it does not allow the upward propagation of the Euro-Atlantic SPW2 peak to and above the 10 hPa level. On the other hand, the mean zonal wind filtering in extraordinary Januaries is consistent with the observed pattern of geopotential heights at higher altitudes.
The existence of the well-pronounced longitudinal structure in meridional wind in the stratosphere at middle and high latitudes means some limitations to application of the zonal mean approach in studying the middle atmosphere.
MERRA reanalysis data can be downloaded from http://disc.sci.gsfc.nasa.gov. NOGAPS-ALPHA data are available on request from David E. Siskind (siskind@nrl.navy.mil).
All three authors worked in very close collaboration and all contributed to this paper substantially, but most ideas came from JL.
The authors declare that they have no conflict of interest.
Support by the Czech Science Foundation via grant 15-03909S is acknowledged.
We thank David E. Siskind for providing NOGAPS-ALPHA data. Data resources
are cited in Sect. 2.
The topical editor, Christoph Jacobi, thanks Alexander Pogoreltsev and one anonymous referee for help in evaluating this paper.
Demirhan Bari, D., Gabriel, A., Körnich, H., and Peters, D. W. H.: The effect of zonal asymmetries in the Brewer-Dobson circulation on ozone and water vapor distributions in the northern middle atmosphere, J. Geophys. Res.-Atmos., 118, 3447–3466, https://doi.org/10.1029/2012JD017709, 2013.
Eckermann, S. D., Hoppe, K. W., Coy, L., McCormack, J. P., Siskind, D. E., Nielsen, K, Kochenash, A., Stevens, M. H., Englert, C. R., Singer, W., and Hervig, M.: High-altitude data assimilation system experiments for the northern summer mesosphere season of 2007, J. Atmos. Sol.-Terr. Phys., 71, 531–551, https://doi.org/10.1016/j.jastp.2008.09.036, 2009.
Forbes, J. M., Zhang, X., Ward, W., and Talaat, E. R.: Climatological features of mesosphere and lower thermosphere stationary planetary waves within ±40 degrees latitude, J. Geophys. Res., 107, D174322, https://doi.org/10.1029/2001JD001232, 2002.
García-Comas, M., López-Puertas, M., Funke, B., Jurado-Navarro, Á. A., Gardini, A., Stiller, G. P., von Clarmann, T., and Höpfner, M.: Measurements of global distributions of polar mesospheric clouds during 2005–2012 by MIPAS/Envisat, Atmos. Chem. Phys., 16, 6701–6719, https://doi.org/10.5194/acp-16-6701-2016, 2016.
Guryanov, V. V. and Fakhrutdinova, A. N.: Height-latitude structure of stationary planetary waves in the stratosphere and lower mesosphere, Adv. Space Res., 53, 674–688, https://doi.org/10.1016/j.asr.2013.12.010, 2014.
Hall, C. M., Aso, T., Manson, A. H., Meek, C. E., Nozawa, S., and Tsutsumi, M.: High-latitude mesospheric mean winds: A comparison between Tromso (69∘ N) and Svalbard (78∘ N), J. Geophys. Res., 108, 4598, https://doi.org/10.1029/2003JD003509, 2003.
Harris, N. R. P., Kyrö, E., Staehelin, J., Brunner, D., Andersen, S.-B., Godin-Beekmann, S., Dhomse, S., Hadjinicolaou, P., Hansen, G., Isaksen, I., Jrrar, A., Karpetchko, A., Kivi, R., Knudsen, B., Krizan, P., Lastovicka, J., Maeder, J., Orsolini, Y., Pyle, J. A., Rex, M., Vanicek, K., Weber, M., Wohltmann, I., Zanis, P., and Zerefos, C.: Ozone trends at northern mid- and high latitudes – a European perspective, Ann. Geophys., 26, 1207–1220, https://doi.org/10.5194/angeo-26-1207-2008, 2008.
Harvey, V. L. and Hitchman, M. H.: A climatology of the Aleutian High, J. Atmos. Sci., 53, 2088–2101, https://doi.org/10.1175/1520-0469(1996)053<2088:ACOTAH>2.0.CO;2, 1996.
Harvey, V. L., Pierce, R. B., Fairlie, T. D., and Hitchman, M. H.: A climatology of stratospheric polar vortices and anticyclone, J. Geophys. Res.-Atmos., 107, https://doi.org/10.1029/2001JD001471, 2002.
Hoffmann, L., Alexander, M. J., Clerbaux, C., Grimsdell, A. W., Meyer, C. I., Rossler, T., and Tounier, B.: Intercomparison of stratospheric gravity wave observations with AIRS and IASI, Atmos. Meas. Tech., 7, 4517–4537, https://doi.org/10.5194/amt-7-4517-2014, 2014.
Holton, J. R.: An Introduction to Dynamic Meteorology, 3rd Edn., Academic Press, San Diego, 1992.
Hoppel, K. W., Baker, N. L., Coy, L., Eckermann, S. D., McCormack, J. P., Nedoluha, G. E., and Siskind, D. E.: Assimilation of stratospheric and mesospheric temperatures from MLS and SABER into a global NWP model, Atmos. Chem. Phys., 8, 6103–6116, https://doi.org/10.5194/acp-8-6103-2008, 2008.
Karami, K., Braesicke, P., Sinnhuber, M., and Versick, S.: On the climatological probability of the vertical propagation of stationary planetary waves, Atmos. Chem. Phys., 16, 8447–8460, https://doi.org/10.5194/acp-16-8447-2016, 2016.
Kozubek, M., Laštovicka, J., and Križan, P.: Differences in mid-latitude stratospheric winds between reanalysis data and versus radiosonde observations at Prague, Ann. Geophys., 32, 353–366, https://doi.org/10.5194/angeo-32-353-2014, 2014.
Kozubek, M., Krizan, P., and Lastovicka, J.: Northern Hemisphere stratospheric winds in higher midlatitudes: longitudinal distribution and long-term trends, Atmos. Chem. Phys., 15, 2203–2213, https://doi.org/10.5194/acp-15-2203-2015, 2015.
Krizan, P., Miksovsky, J., Kozubek, M., Wang, G. C., and Bai, J. H.: Long term variability of total ozone yearly minima and maxima in the latitudinal belt from 20 degrees N to 60 degrees N derived from the merged satellite data in the period 1979–2008, Adv. Space Res., 48, 2016–2022, https://doi.org/10.1016/j.asr.2011.07.010, 2011.
Labitzke, K.: On the solar cycle-QBO relationship: a summary, J. Atmos. Sol.-Terr. Phys., 67, 45–54, https://doi.org/10.1016/j.jastp.2004.07.016, 2005.
Lastovicka, J.: Non-zonality of ozone response to geomagnetic storms and Forbush decreases of cosmic rays, Adv. Space Res., 32, 1793–1802, https://doi.org/10.1016/S0273-1177(03)90478-9, 2003.
Mlch, P.: Total ozone response to major geomagnetic storms during non-winter periods, Studia Geophys. Geod., 38, 423–429, https://doi.org/10.1007/BF02296172, 1994.
Monier, E. and Weare, B. C.: Climatology and trends in the forcing of the stratospheric ozone transport, Atmos. Chem. Phys., 11, 6311–6323, https://doi.org/10.5194/acp-11-6311-2011, 2011.
Nigam, S. and Lindzen, R. S.: The sensitivity of stationary waves to variations in the basic state flow, J. Atmos. Sci., 46, 1746–1768, https://doi.org/10.1175/1520-0469(1989)046<1746:TSOSWT>2.0.CO;2, 1989.
Pogoreltsev, A. I., Vlasov, A. A., Froehlich, K., and Jacobi, C.: Planetary waves in coupling the lower and upper atmosphere, J. Atmos. Sol.-Terr. Phys., 69, 2083–2101, https://doi.org/10.1016/j.jastp.2007.05.014, 2007.
Portnyagin, Yu. I. and Solovjeva, T. V.: The role of vertical momentum fluxes in maintaining global meridional circulation in the lower thermosphere/upper mesosphere, J. Atmos. Sol.-Terr. Phys., 59, 511–525, https://doi.org/10.1016/S1364-6826(96)00024-7, 1997.
Reichle, R. H.: The MERRA-Land Data Product, version 1.1. GMAO Technical Report, NASA Global Modeling and Assimilation Office, Goddard Space Flight Center, Greenbelt, MD, USA, 2012.
Rienecker, M. M., Suarez, M. W., Gelaro, M., Todling R., Bacmeister, J., Liu, E., Bosilovich, M. G., Schubert, S. D., Takacs, L., Kim, G.-K., Bloom, S., Chen, J., Collins, D., Conaty, A., da Silva, A., Gu, W., Joiner,J., Koster, R. D., Lucchesi, R., Molod, A., Owens, T., Pawson, S., Pegion, P., Redder, C. R., Reichle, R., Robertson, F. R., Ruddick, A. G., Sienkiewicz, M., and Woollen, J.: MERRA: NASA's Modern-Era Retrospective analysis for Research and Applications, J. Clim., 24, 3624–3648, https://doi.org/10.1175/JCLI-D-11-00015.1, 2011.
Šácha, P., Kuchař, A., Jacobi, C., and Pišoft, P.: Enhanced internal gravity wave activity and breaking over the northeastern Pacific–eastern Asian region, Atmos. Chem. Phys., 15, 13097–13112, https://doi.org/10.5194/acp-15-13097-2015, 2015.
Shepherd, T. G.: Transport in the middle atmosphere, J. Meteorol. Soc. Jpn., 85B, 165–191, https://doi.org/10.2151/jmsj.85B.165, 2007.
Sun, C., Li, J. P., Jin, F. F., and Xie, F.: Contrasting meridional structures of stratospheric and tropospheric planetary wave variability in the Northern Hemisphere, Tellus A, 66, 25303, https://doi.org/10.3402/tellusa.v66.25303, 2014.
Urban, J., Lossow, S., Stiller, G., and Read, W.: Another drop in water vapor, EOS, 95, 245–246, https://doi.org/10.1002/2014EO27, 2014.
Weare, B. C.: Tropospheric-stratospheric wave propagation during El Niño-Southern Oscillation, J. Geophys. Res., 115, D18122, https://doi.org/10.1029/2009JD013647, 2010.